BAGGU Influencer Marketing Strategy
(2026 Data & Insights)
We analyzed 3.4k pieces of influencer content sponsored by BAGGU over the last 12 months.
This report breaks down where & how BAGGU invests in influencer marketing, which social platforms they prioritize, top geographical markets, and more.
The data in this report comes from Modash's Brand Collaborations API.
P.S. for a simple list of influencers who have collaborated with BAGGU, see here: BAGGU influencers.
Influencer activity throughout the year
BAGGU's influencer campaigns are active year-round with notable month-to-month fluctuation. The chart below shows month-by-month data for total sponsored posts tracked.
BAGGU's influencer activity by month
Number of sponsored posts
BAGGU's sponsored post volume peaks in March with 480 posts, 71% higher than the monthly average of 281. June recorded the lowest activity at 114 posts, 59% below average.
Social platforms breakdown
In our dataset (which only includes Instagram, YouTube, and TikTok), this is how the volume of BAGGU's sponsored influencer collaborations break down by social platform:
- TikTok: 2.5k posts (74.9%)
- Instagram: 823 posts (24.4%)
- YouTube: 25 posts (0.7%)
BAGGU's influencer activity by platform
Share of sponsored content by social network
TikTok influencer marketing is a clear focus for BAGGU.
Here are 3 examples of BAGGU's recent sponsored collaborations (one each for Instagram, TikTok, YouTube).
akko325 x BAGGU
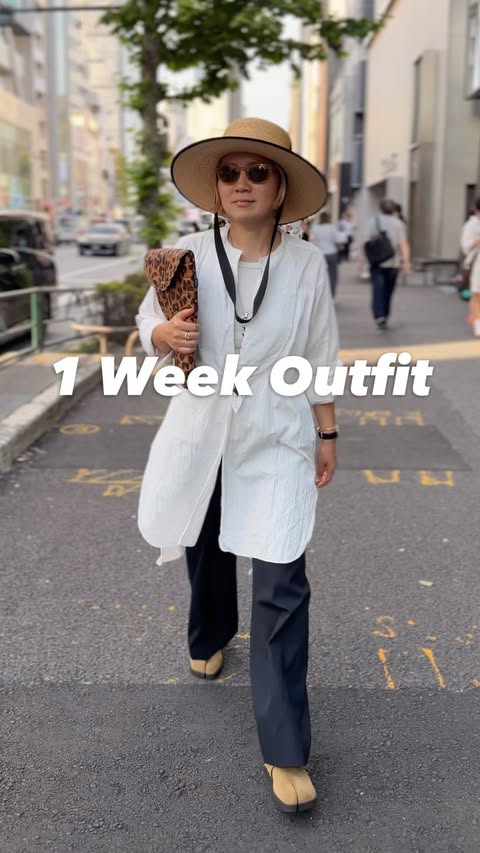
Influencer bio
156cm I '81 I mom I ▶︎大人カジュアル ▶︎骨格ストレート その他コーディネート&お買い物はこちら🛒 ⇩⇩⇩
Collaboration metrics
Get a free trial to find more data on influencer audiences, performance, and collaborations.
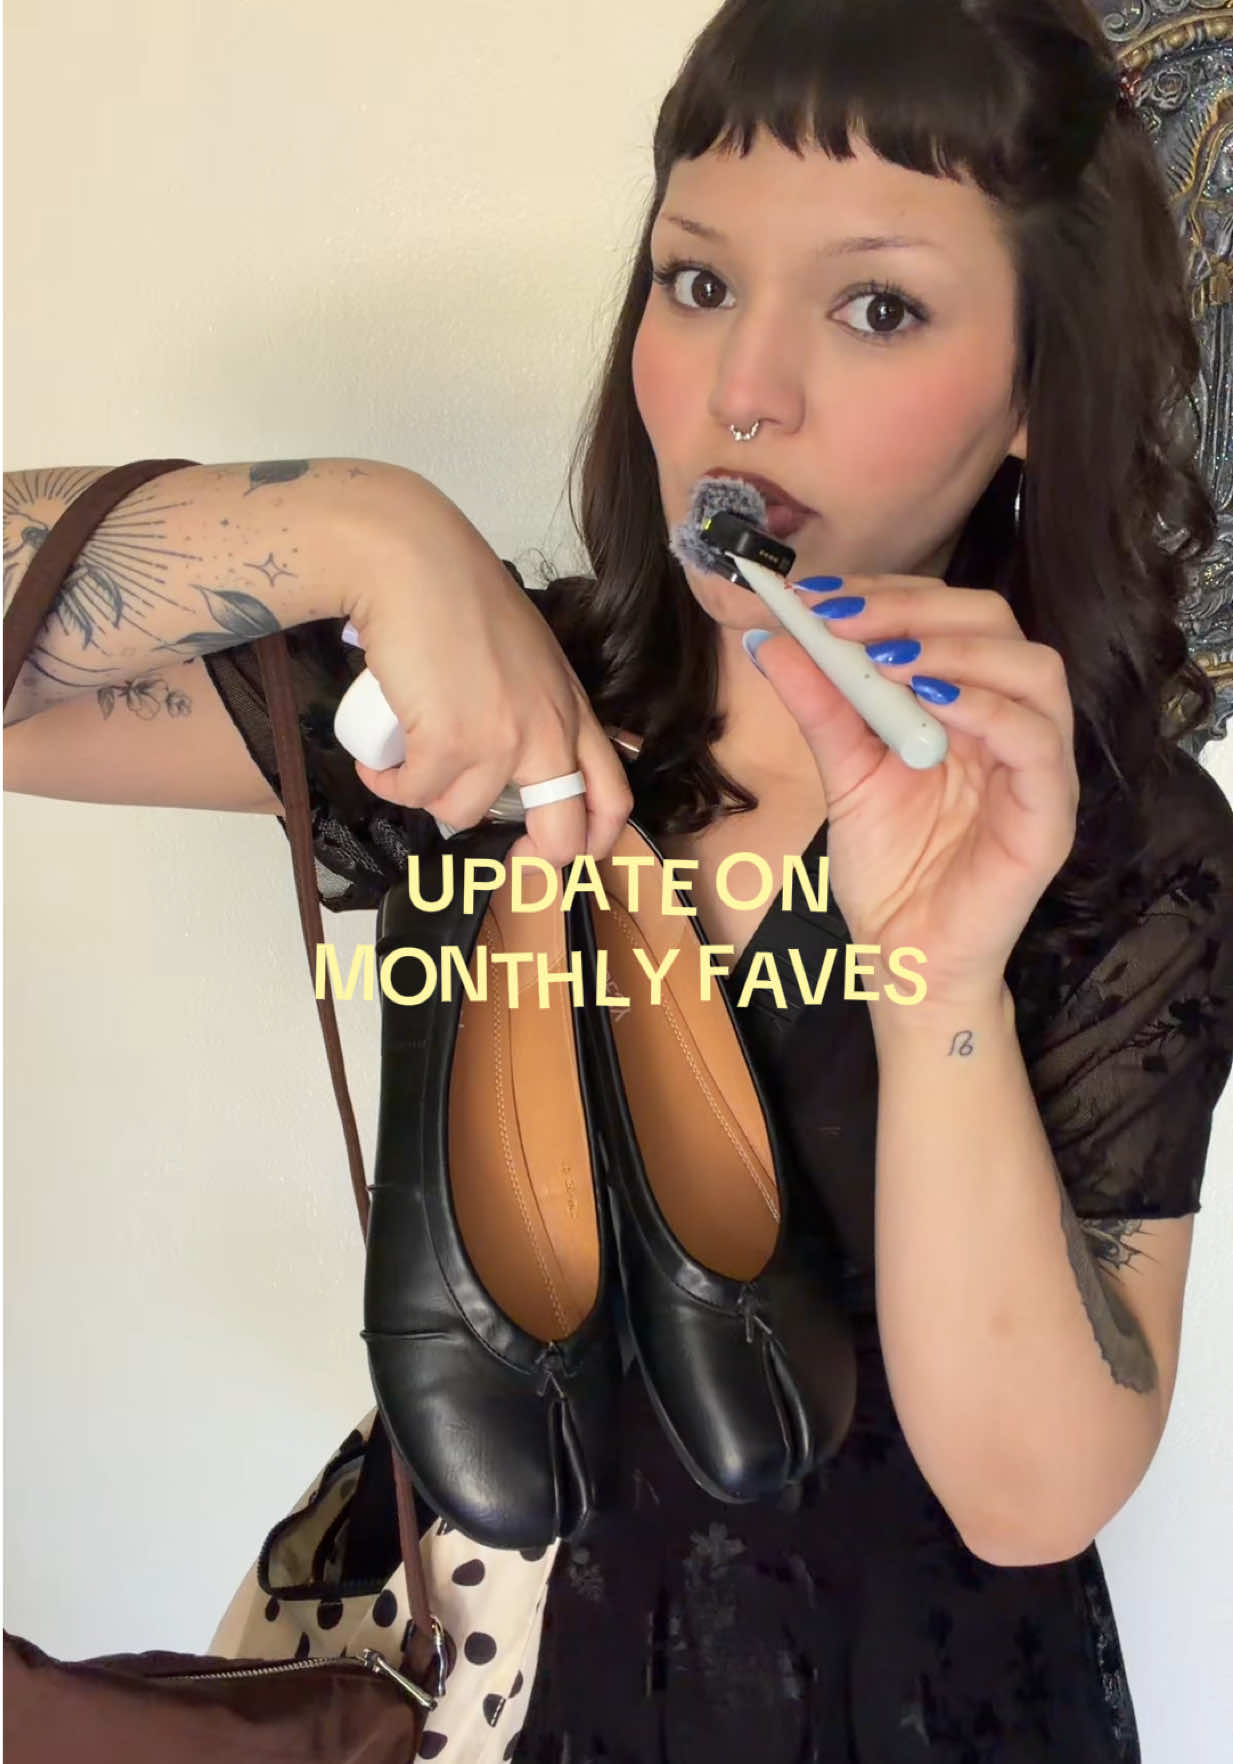
mmotherem x BAGGU
![TikTok post by @mmotherem for BAGGU. Caption reads: [...] clock out and clock IN . . @Yeokou @Gap....](https://images.od.modash.io/2ecd017c2536a3566f0ee817b1ae1d53c2c39b66)
Influencer bio
31, 5'2, styling all of your accessible fashion in CO emily@platformtalent.com LTK ⬇️💕
Collaboration metrics
Get a free trial to find more data on influencer audiences, performance, and collaborations.
AbbyAsselin x BAGGU
![YouTube post by @AbbyAsselin for BAGGU. Caption reads: [...] movement shorts: Pink set: hairstylist:....](https://images.od.modash.io/4d493072774e863f3bae64fa5f119fb30f3e8ca6)
Influencer bio
here to help you through the stuff nobody really talks about as a 20-something who has started over a few times: changing careers when it's scary, building a life that doesn't look like the plan, and figuring out what "living" actually means in your 20s new videos every week 🫶 come for the real talk & stay for the cozy vlogs! ABOUT ME: I grew up in Panama City Beach, Florida, and graduated from the University of Alabama with my bachelor's in 2020 (accounting & finance) and master's in 2021 (tax accounting). After graduating, I moved to Houston, TX, and took 6 months to study for & pass the CPA exams, worked at a Big 4 firm in tax for two years until December 2023, got married on 12/31/23, spent a year working for myself as a content creator, returned to the corporate world to work in tax for 7 months, and recently made a career change summer of 2025 to be a talent manager at the agency I was managed by for 7 years.
Collaboration metrics
Get a free trial to find more data on influencer audiences, performance, and collaborations.
If you break this down further by content type on TikTok, this is what it looks like:
- Videos: 92.2%
- Carousels: 7.8%
💡 Related resource: How To Find TikTok Influencers.
Influencer audience size breakdown (by views)
For their top social platform (TikTok), here is a breakdown of the type of influencers BAGGU are collaborating with, by audience size.
Note: this breakdown is based on each influencer's average views (not follower/subscriber count), because views typically correlate more closely with influencer pricing and impact.
BAGGU's influencers average views (TikTok)
Based on each influencer's average views per post
With 41.3% of partnerships featuring creators averaging 1K-5K views, BAGGU's strategy suggests niche targeting and authenticity, likely leveraging collaboration models like gifting and affiliates to work with smaller creators.
Here is an example of a sponsored collaboration with a larger-audience creator on TikTok (129.9k avg views/post):
jenna_bariatricbestie x BAGGU
![TikTok post by @jenna_bariatricbestie for BAGGU. Caption reads: [...] #presents #christmaseve @jakey_bestie @BAGGU....](https://images.od.modash.io/3ccf4c66b94c96196a0e1628a5b651a5c222c9d6)
Influencer bio
jennabestie@thesociablesociety.com ✨ down 179 lbs ✨ -67 natural, -112 WLS (7/23)
Collaboration metrics
Get a free trial to find more data on influencer audiences, performance, and collaborations.
And here is another example with a smaller creator on TikTok (9.3k avg views/post):
emilypolner x BAGGU
![TikTok post by @emilypolner for BAGGU. Caption reads: @BAGGU sent me a little gift (thanks to my [...].](https://images.od.modash.io/4b18c201968296b84f3f2937eba5fb02334d10e6)
Influencer bio
Native NYer. Maximalist who loves sharing outfits and styling tips. If I'm not home, I'm probably at a concert. 💌: emilypolner@gmail.com
Collaboration metrics
Get a free trial to find more data on influencer audiences, performance, and collaborations.
BAGGU's repeat partnerships
Out of 1.7k unique influencers in our dataset, 36 of them (2%) posted content for BAGGU in 3 or more separate calendar months. The most consistent partner is @ntomm, who has collaborated across 12 months with 88 total posts.
Here are 3 examples of BAGGU's repeat influencer partnerships, with links to the sponsored content.
paulajudithm x BAGGU
![TikTok post by @paulajudithm for BAGGU. Caption reads: [...] (my needoh) tagged: @Protémoa @BAGGU @SCUSTY....](https://images.od.modash.io/69675db0bac99e141c615edaec740b812823c200)
mmotherem x BAGGU
![TikTok post by @mmotherem for BAGGU. Caption reads: [...] #ootdinspo #fashiontiktok #baggu....](https://images.od.modash.io/83f8575ee3f7c31a85e747ac5410ad2d0f6160f1)
![TikTok post by @mmotherem for BAGGU. Caption reads: [...] . . @Gap @Free People @Nike @BAGGU....](https://images.od.modash.io/0a93b847dab199dd36e415a8f6b28b8c2d55e41d)
planzee_ x BAGGU
![TikTok post by @planzee_ for BAGGU. Caption reads: [...] USA dress @Dr. Martens @asos @BAGGU @Urban....](https://images.od.modash.io/0a8010ab1f7a1afbe4ff2dbe213189240e4e2ee1)
![TikTok post by @planzee_ for BAGGU. Caption reads: [...] pt 59492929!2293 @Dr. Martens @BAGGU @asos....](https://images.od.modash.io/e0369f5f57992c09d89a4cc57555f0e9fbaf3046)
![TikTok post by @planzee_ for BAGGU. Caption reads: [...] @Dr. Martens @hollister @LOFT @BAGGU @ZARA....](https://images.od.modash.io/48f31def737a51db6acf612519f41581ace9c51c)
💡 Related resource: Long-Term Influencer Partnerships: Pros, Cons & How The Pros Manage Them.
Geographical breakdown
In our dataset, United States is where BAGGU had the most influencer activity. 67.2% of their live influencer content in the last 12 months was posted by American influencers.
Based on the percentage of influencer content per market, other important markets include:
- United Kingdom (6%)
- Canada (4.3%)
- Japan (4.1%)
BAGGU's influencer activity by market
Here is another example of BAGGU collaborating with an influencer in United States.
sagehatesmilk x BAGGU
![TikTok post by @sagehatesmilk for BAGGU. Caption reads: [...] water spot from washing dishes @Levi’s....](https://images.od.modash.io/2ea5ab413989cfc7a2f5f4522d26843f816a773c)
BAGGU's influencer activity vs. related brands
BAGGU competes with Beyond The Vines and Dagne Dover in functional, design-forward bags used daily for commuting, travel, and errands. They share strong overlap in lifestyle creator content around “what’s in my bag,” organization, and outfit styling.
Total influencer content
BAGGU vs. related brands influencer activity
Total sponsored posts tracked (last 12 months)
BAGGU leads with 3.4k sponsored posts, significantly outpacing Beyond The Vines (1.4k posts) and Dagne Dover (703 posts). Across all three brands, the average volume is 1.8k posts, suggesting established influencer marketing investments. BAGGU has more than twice as many total posts as Beyond The Vines and several times more than Dagne Dover.
By social platform
BAGGU vs. related brands influencer activity (by social platform)
Sponsored posts by platform
BAGGU leads on TikTok and YouTube, while Beyond The Vines leads on Instagram. The gap is most notable on TikTok, with BAGGU at 2.5k, Dagne Dover at 294, Beyond The Vines at 231 posts. BAGGU's activity is particularly concentrated on TikTok. On TikTok, BAGGU has several times more posts than Beyond The Vines and Dagne Dover.
By geographical market
BAGGU vs. related brands influencer activity (by country)
Estimated sponsored posts in BAGGU's top markets
BAGGU has the highest estimated sponsored-post volume in United States (2.3k posts, 67.2%), United Kingdom (202 posts, 6%), Canada (145 posts, 4.3%), suggesting a North America focus, while Beyond The Vines has the highest estimated sponsored-post volume in Thailand (377 posts, 26.3%), Japan (321 posts, 22.4%), Indonesia (319 posts, 22.3%), suggesting a Asia focus. Looking at United States specifically, the split is BAGGU at 2.3k posts (67.2%), Dagne Dover at 556 posts (79.1%). BAGGU's strength in United States and United Kingdom may indicate a home-market focus, while Beyond The Vines shows broader regional investment.
Read more influencer strategy breakdowns
Looking for more like this? Here are 5 similar influencer marketing strategy breakdowns for other brands:
- Beyond The Vines's Influencer Marketing Strategy
- Dagne Dover's Influencer Marketing Strategy
- BUTTONSCARVES's Influencer Marketing Strategy
- Frankies Bikinis's Influencer Marketing Strategy
- Dossier's Influencer Marketing Strategy
Or, if you want to access data like this for your own software or processes, take a look at Modash's API products:
Frequently asked questions
Scaling your influencer program?
When you outgrow your mishmash of spreadsheets & free tools, try Modash. Find & email influencers, track campaigns, ship products & more - all in one place.