callitspring Influencer Marketing Strategy
(2026 Data & Insights)
We analyzed 1.0k pieces of influencer content sponsored by callitspring over the last 12 months.
This report breaks down where & how callitspring invests in influencer marketing, which social platforms they prioritize, top geographical markets, and more.
The data in this report comes from Modash's Brand Collaborations API.
P.S. for a simple list of influencers who have collaborated with callitspring, see here: callitspring influencers.
Influencer activity throughout the year
callitspring's influencer campaigns are active year-round with notable month-to-month fluctuation. The chart below shows month-by-month data for total sponsored posts tracked.
callitspring's influencer activity by month
Number of sponsored posts
callitspring's influencer output appears relatively consistent throughout the year, averaging about 85 sponsored posts per month. October recorded the highest volume at 112 posts (32% above average), while June was the quietest at 45 posts.
Social platforms breakdown
In our dataset (which only includes Instagram, YouTube, and TikTok), this is how the volume of callitspring's sponsored influencer collaborations break down by social platform:
- Instagram: 809 posts (79.3%)
- TikTok: 208 posts (20.4%)
- YouTube: 3 posts (0.3%)
callitspring's influencer activity by platform
Share of sponsored content by social network
Instagram influencer marketing is a clear focus for callitspring.
Here are 2 examples of callitspring's recent sponsored collaborations (one each for Instagram, TikTok).
elisabethrioux x callitspring
![Instagram post by @elisabethrioux for callitspring. Caption reads: [...] shopping sess with my boyfriend at....](https://images.od.modash.io/ffacb6691ac09f663f29210e937f622a16ccd16f)
Influencer bio
Elisabeth Rioux : Unfiltered on Amazon Prime video 🎥 Owner @hoaka_swimwear & @hoaka_apparel 💦🌸🌈✈️🌍🍌🐠 elisabeth@teamonwardtalent.com
Collaboration metrics
Get a free trial to find more data on influencer audiences, performance, and collaborations.
cadillacfairview x callitspring
![TikTok post by @cadillacfairview for callitspring. Caption reads: [...] stylist: @bestofthislife shoes:....](https://images.od.modash.io/4b9fd0923932d10b77612013bf66c41d875ff0a6)
Influencer bio
Rediscover that shop-til-you-drop feeling
Collaboration metrics
Get a free trial to find more data on influencer audiences, performance, and collaborations.
If you break this down further by content type on Instagram, this is what it looks like:
- Reels: 54.9%
- Posts: 45.1%
💡 Related resource: How To Find Instagram Influencers.
Influencer audience size breakdown (by views)
For their top social platform (Instagram), here is a breakdown of the type of influencers callitspring are collaborating with, by audience size.
Note: this breakdown is based on each influencer's average views (not follower/subscriber count), because views typically correlate more closely with influencer pricing and impact.
callitspring's influencers average views (Instagram)
Based on each influencer's average views per post
With 34.8% of partnerships featuring creators averaging 1K-5K views, callitspring's strategy suggests niche targeting and authenticity, likely leveraging collaboration models like gifting and affiliates to work with smaller creators. The 10K-50K views segment is also prominent at 25.6%, indicating investment across adjacent tiers.
Here is an example of a sponsored collaboration with a larger-audience creator on Instagram (87.9k avg views/post):
sophia.berk x callitspring
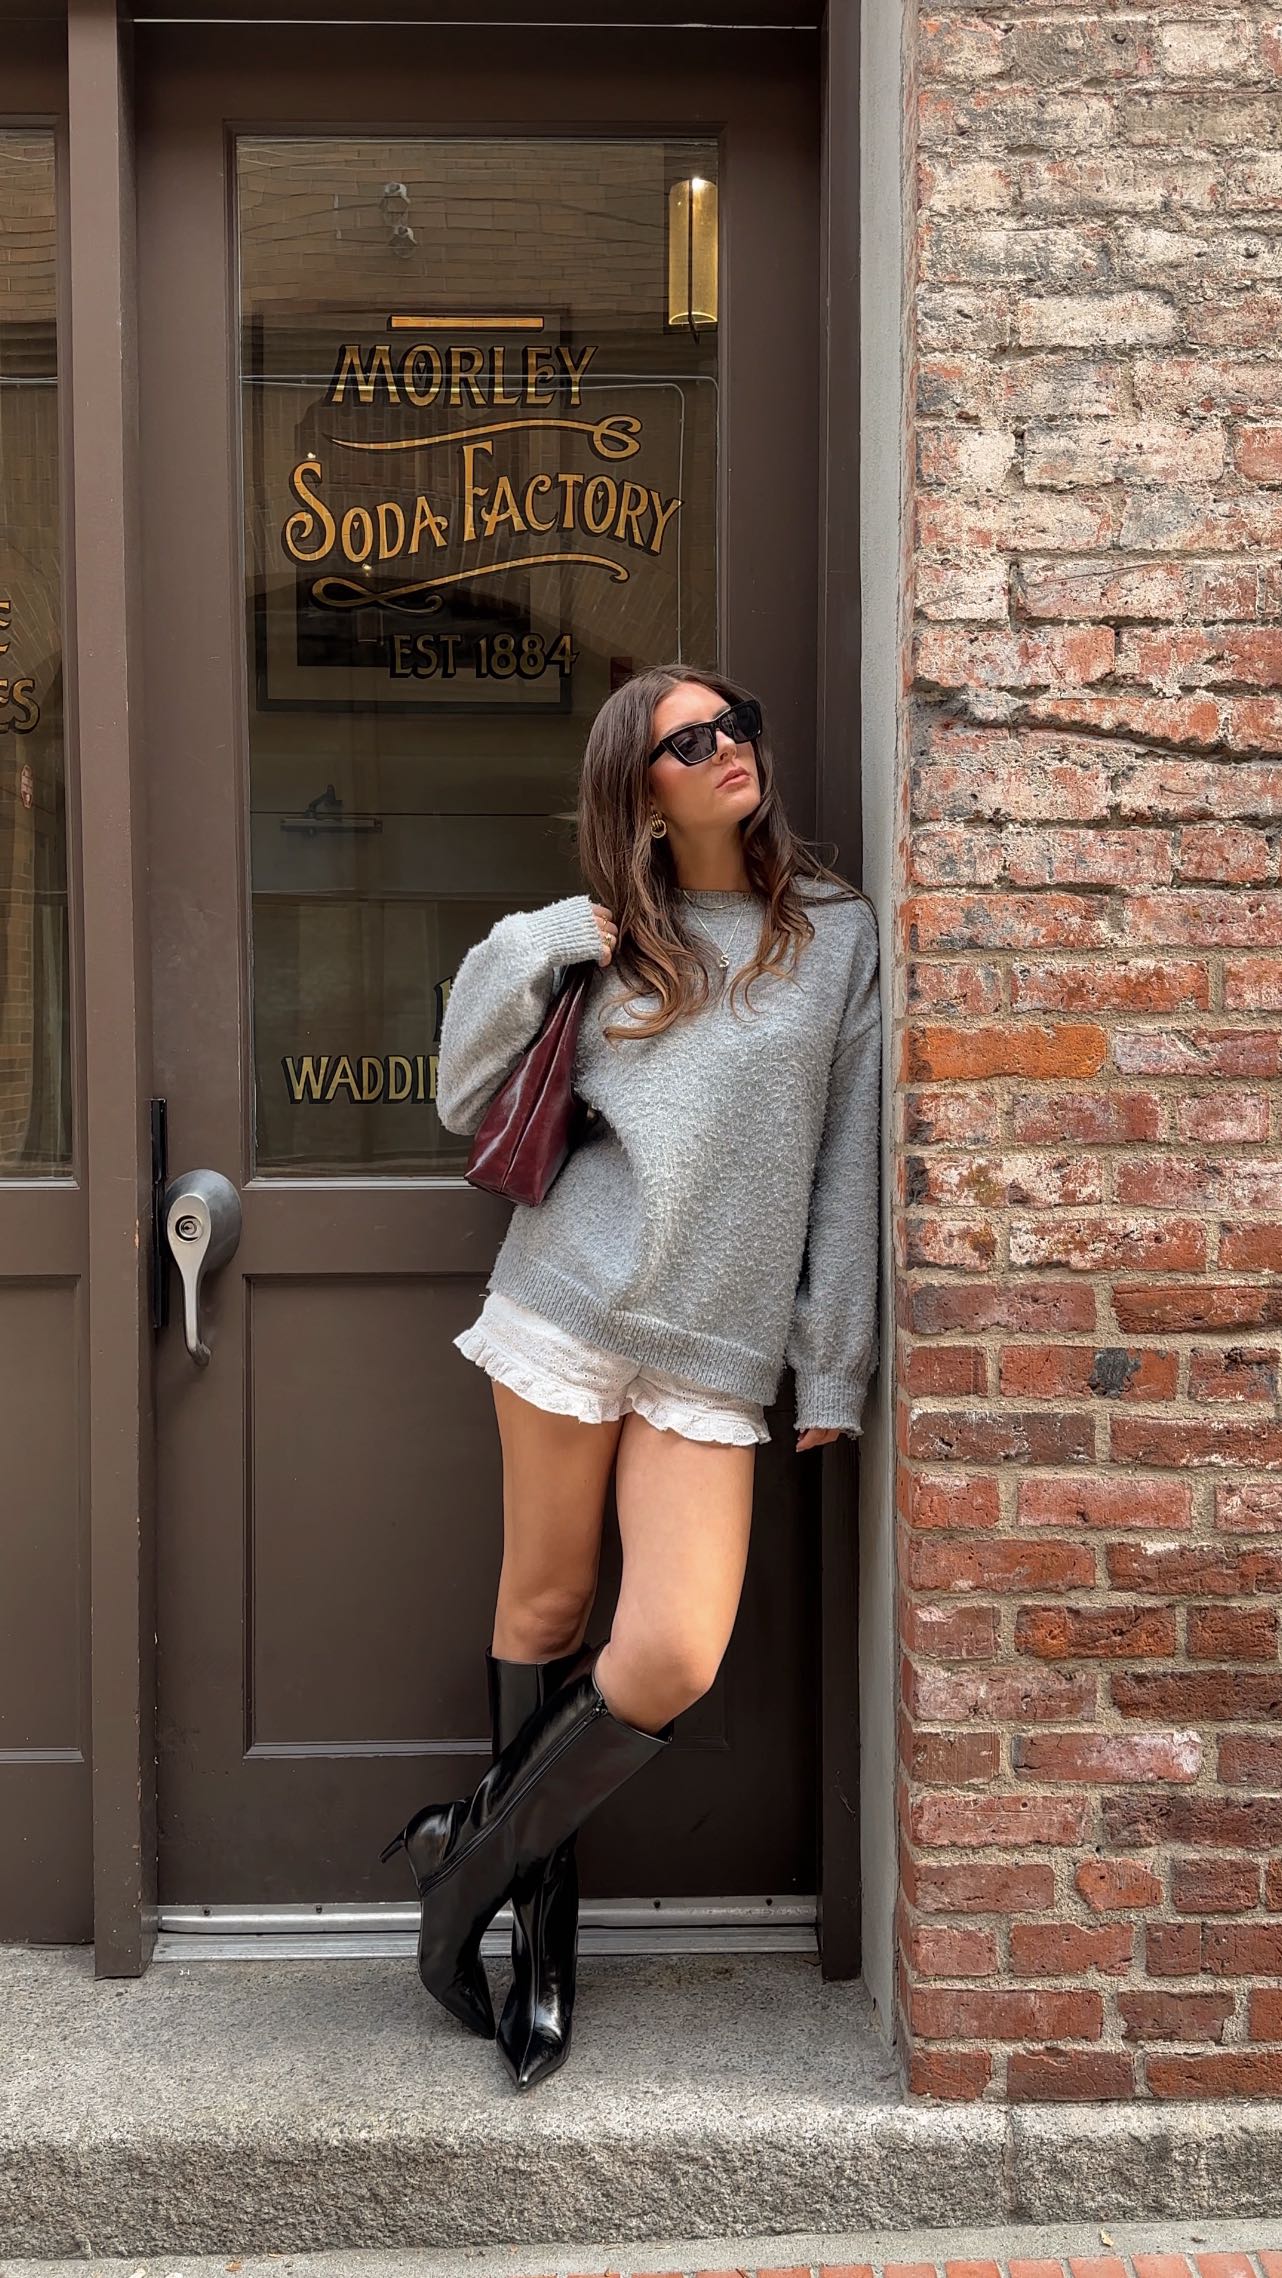
Influencer bio
just a girl in her fashion world ✨ + beauty & lifestyle victoria / vancouver tiktok: sophiaberkk (11.1k) 💌: sophiaberk@shinetalentgroup.com
Collaboration metrics
Get a free trial to find more data on influencer audiences, performance, and collaborations.
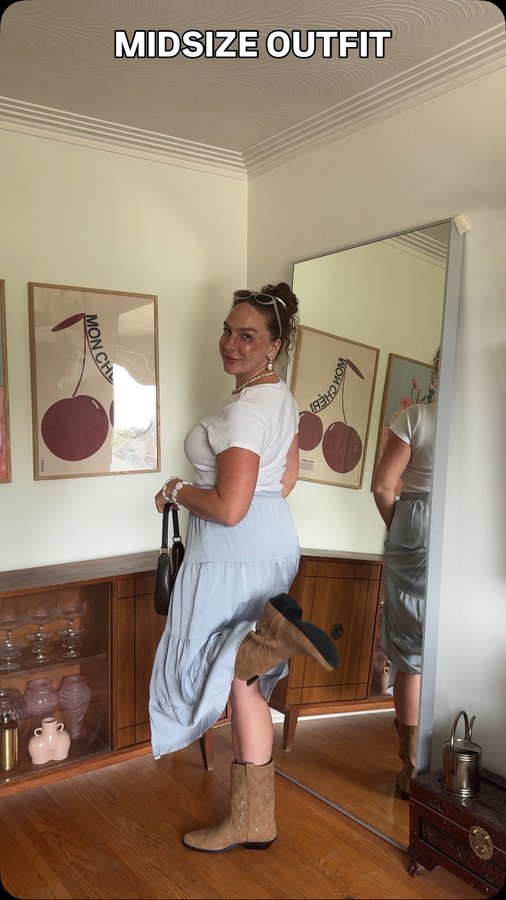
And here is another example with a smaller creator on Instagram (7.3k avg views/post):
juliadiaaz x callitspring
![Instagram post by @juliadiaaz for callitspring. Caption reads: [...] @tjmaxx • Shoes: @birkenstock • Bag:....](https://images.od.modash.io/0fdeb2af89e4c1c597cf06297fd577337916ad27)
Influencer bio
📍yvr ✨ frugally chic ✨| style, lifestyle & wellness | funny sometimes 💌: juliadenisediaz@gmail.com shop my faves 👇🏼
Collaboration metrics
Get a free trial to find more data on influencer audiences, performance, and collaborations.
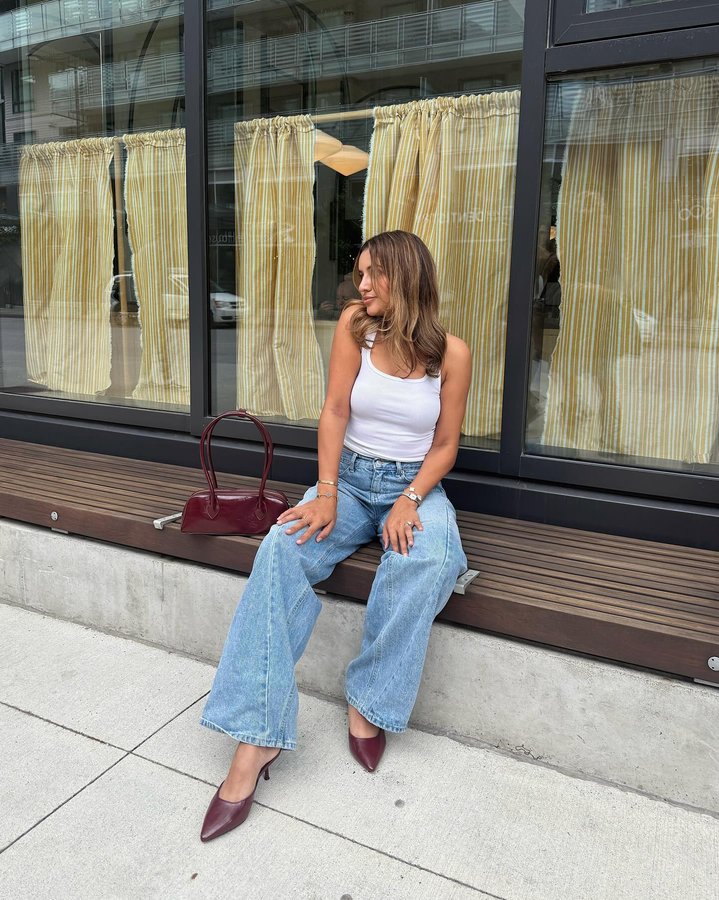
callitspring's repeat partnerships
Out of 617 unique influencers in our dataset, 22 of them (4%) posted content for callitspring in 3 or more separate calendar months. The most consistent partner is @edenlowther, who has collaborated across 7 months with 10 total posts.
Here are 3 examples of callitspring's repeat influencer partnerships, with links to the sponsored content.
tamannababani x callitspring
![Instagram post by @tamannababani for callitspring. Caption reads: [...] @lululemon Outfit 1 Boots: @callitspring....](https://images.od.modash.io/faeb318c13635fad4c34bbc1264d7657fad4d344)
![Instagram post by @tamannababani for callitspring. Caption reads: [...] : @sheinofficial Heels : @callitspring....](https://images.od.modash.io/627a3ef142949f059108542c7dbd7f3d580d0f1a)
![Instagram post by @tamannababani for callitspring. Caption reads: [...] Dress : @hollister Boots : @callitspring [....](https://images.od.modash.io/9f0662084aa9e0bd584c87456e6fc68c6fe7fa40)
emilyrhiannonmallett x callitspring
![Instagram post by @emilyrhiannonmallett for callitspring. Caption reads: [...] boots & bag gifted from @callitspring....](https://images.od.modash.io/8fa63e4c02472b3567b80038ade20fab190e2c02)
![Instagram post by @emilyrhiannonmallett for callitspring. Caption reads: [...] boots 👢😈🖤 gifted from @callitspring....](https://images.od.modash.io/1d87840bae9f01c79f9b28582d37cf01ffc8ae45)
davneetdhillon x callitspring
![Instagram post by @davneetdhillon for callitspring. Caption reads: [...] bag also in Bordo from @callitspring 🍂....](https://images.od.modash.io/d6ffca220d0c5f45a5bcce20259b1bfcda850224)
💡 Related resource: Long-Term Influencer Partnerships: Pros, Cons & How The Pros Manage Them.
Geographical breakdown
In our dataset, Canada is where callitspring had the most influencer activity. 34.8% of their live influencer content in the last 12 months was posted by Canadian influencers.
Based on the percentage of influencer content per market, other important markets include:
- United States (24.1%)
- India (9.9%)
- United Kingdom (3.5%)
callitspring's influencer activity by market
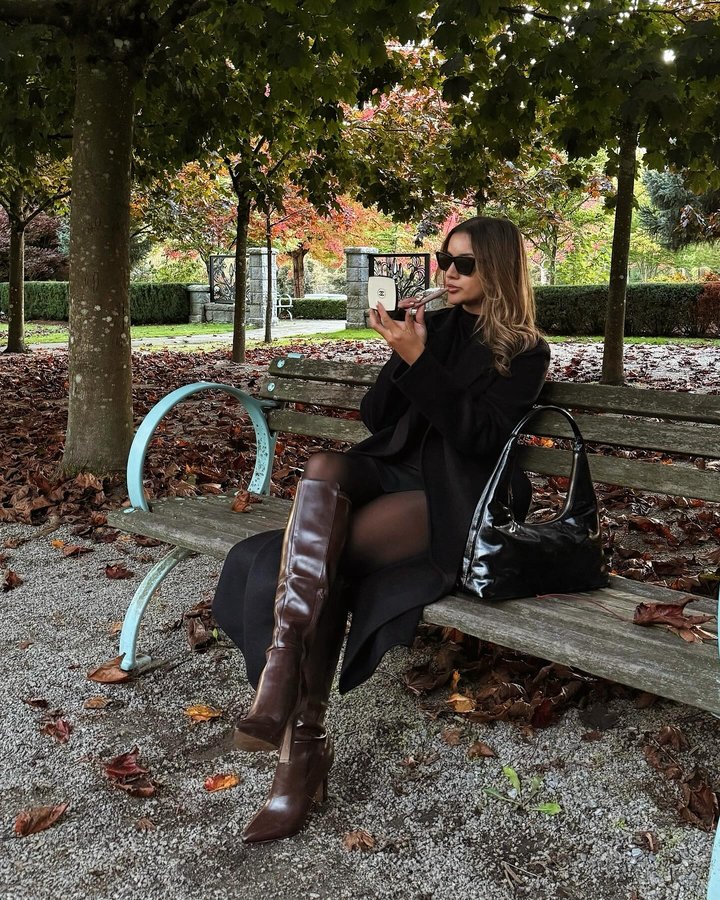
Here is another example of callitspring collaborating with an influencer in Canada.
kp.lehal x callitspring
![Instagram post by @kp.lehal for callitspring. Caption reads: [...] but refuse to change your shoes....](https://images.od.modash.io/d296be026d88bb1a3f0eb8951b4eeacf09162581)
callitspring's influencer activity vs. related brands
callitspring overlaps heavily with ALDO Shoes and Nine West in fashion footwear targeting style-conscious shoppers at accessible price points. Their influencer strategies often center on outfit styling, seasonal drops, and trend-led hauls.
Total influencer content
callitspring vs. related brands influencer activity
Total sponsored posts tracked (last 12 months)
ALDO Shoes leads with 4.1k sponsored posts, significantly outpacing Nine West (1.2k posts) and callitspring (1k posts). Across all three brands, the average volume is 2.1k posts, indicating mature, scaled influencer programs. ALDO Shoes has several times more total posts than callitspring and Nine West.
By social platform
callitspring vs. related brands influencer activity (by social platform)
Sponsored posts by platform
Among these brands, ALDO Shoes leads on Instagram and TikTok and Nine West leads on YouTube. The gap is most notable on Instagram, with ALDO Shoes at 3.1k, Nine West at 888, callitspring at 809 posts. callitspring's activity is particularly concentrated on Instagram. On Instagram and TikTok, ALDO Shoes has several times more posts than callitspring and Nine West.
By geographical market
callitspring vs. related brands influencer activity (by country)
Estimated sponsored posts in callitspring's top markets
ALDO Shoes has the highest estimated sponsored-post volume in United States (1k posts, 25.7%), India (871 posts, 21.5%), Indonesia (300 posts, 7.4%), suggesting a Asia focus, while callitspring leads in Canada with 355 posts (34.8%), while Nine West leads in Australia with 76 posts (6.1%). Looking at United States specifically, the split is ALDO Shoes at 1k posts (25.7%), Nine West at 591 posts (47.5%), callitspring at 246 posts (24.1%).
Read more influencer strategy breakdowns
Looking for more like this? Here are 5 similar influencer marketing strategy breakdowns for other brands:
- ALDO Shoes's Influencer Marketing Strategy
- Nine West's Influencer Marketing Strategy
- Frankies Bikinis's Influencer Marketing Strategy
- Nadine Merabi's Influencer Marketing Strategy
- Magic Mind's Influencer Marketing Strategy
Or, if you want to access data like this for your own software or processes, take a look at Modash's API products:
Frequently asked questions
Scaling your influencer program?
When you outgrow your mishmash of spreadsheets & free tools, try Modash. Find & email influencers, track campaigns, ship products & more - all in one place.