Everlane Influencer Marketing Strategy
(2026 Data & Insights)
We analyzed 1.5k pieces of influencer content sponsored by Everlane over the last 12 months.
This report breaks down where & how Everlane invests in influencer marketing, which social platforms they prioritize, top geographical markets, and more.
The data in this report comes from Modash's Brand Collaborations API.
P.S. for a simple list of influencers who have collaborated with Everlane, see here: Everlane influencers.
Influencer activity throughout the year
Everlane's influencer campaigns are active year-round with notable month-to-month fluctuation. The chart below shows month-by-month data for total sponsored posts tracked.
Everlane's influencer activity by month
Number of sponsored posts
Everlane's influencer output appears relatively consistent throughout the year, averaging about 124 sponsored posts per month. October recorded the highest volume at 200 posts (61% above average), while June was the quietest at 69 posts.
Social platforms breakdown
In our dataset (which only includes Instagram, YouTube, and TikTok), this is how the volume of Everlane's sponsored influencer collaborations break down by social platform:
- Instagram: 881 posts (59.1%)
- TikTok: 537 posts (36%)
- YouTube: 73 posts (4.9%)
Everlane's influencer activity by platform
Share of sponsored content by social network
Instagram influencer marketing is a clear focus for Everlane.
Here are 3 examples of Everlane's recent sponsored collaborations (one each for Instagram, TikTok, YouTube).
blancaarimany x Everlane
![Instagram post by @blancaarimany for Everlane. Caption reads: [...] staples 🫶🏽🎄The Holiday Edit 001 by....](https://images.od.modash.io/0627730f0bc3912f26c76c8d7bb5e165fd285222)
Influencer bio
Ensaimada lover Represented by TWIC - info@blancaarimany.com My YT Life:
Collaboration metrics
Get a free trial to find more data on influencer audiences, performance, and collaborations.
elizammcewen x Everlane
Influencer bio
Just another girl & her outfits on tiktok management@elizamcewen.com
Collaboration metrics
Get a free trial to find more data on influencer audiences, performance, and collaborations.
lauravonv x Everlane
![YouTube post by @lauravonv for Everlane. Caption reads: [...] and purchases Everything Worn/Mentioned....](https://images.od.modash.io/c820b70cb02e9231ffc3205cf69c7351067bd7a8)
Influencer bio
Quality over Quantity - Fashion brand reviews and methodical purchases with a touch of fashion history - lauravonv@gmail.com
Collaboration metrics
Get a free trial to find more data on influencer audiences, performance, and collaborations.
If you break this down further by content type on Instagram, this is what it looks like:
- Reels: 62.9%
- Posts: 37.1%
💡 Related resource: How To Find Instagram Influencers.
Influencer audience size breakdown (by views)
For their top social platform (Instagram), here is a breakdown of the type of influencers Everlane are collaborating with, by audience size.
Note: this breakdown is based on each influencer's average views (not follower/subscriber count), because views typically correlate more closely with influencer pricing and impact.
Everlane's influencers average views (Instagram)
Based on each influencer's average views per post
With 37.7% of partnerships featuring creators averaging 10K-50K views, Everlane's strategy suggests cost-efficiency and engagement-focused partnerships.
Here is an example of a sponsored collaboration with a larger-audience creator on Instagram (343.3k avg views/post):
maayajardon x Everlane

Influencer bio
📍nyc @wilhelminamodels @sutherlandmodel @foliomanagement Mayajardon98@gmail.com💌
Collaboration metrics
Get a free trial to find more data on influencer audiences, performance, and collaborations.
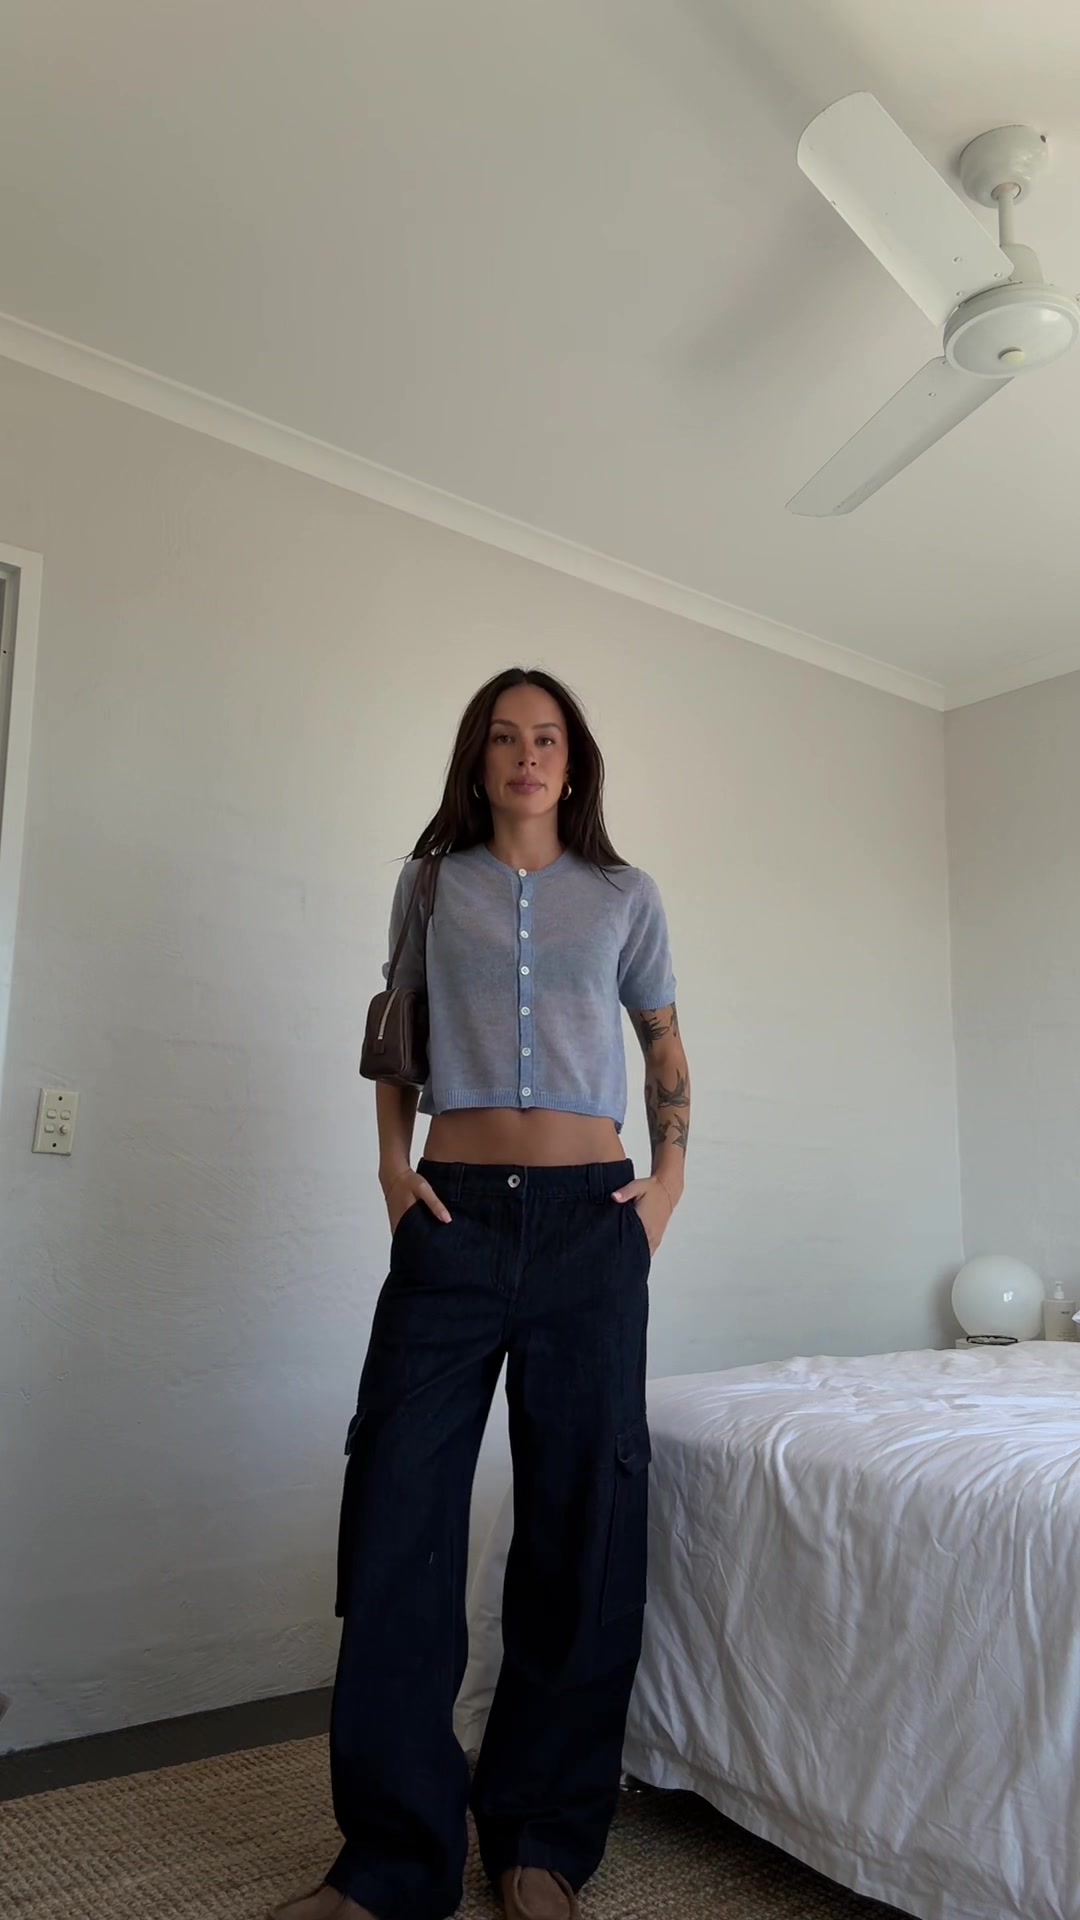
And here is another example with a smaller creator on Instagram (9.7k avg views/post):
1mon16 x Everlane
![Instagram post by @1mon16 for Everlane. Caption reads: [...] fall looks in The Fall Edit 001 🤎 ft.....](https://images.od.modash.io/9268a4f75f67422c842199f5613e388ec88c1c2c)
Influencer bio
monica@genflow.com tiktok - themonicawang vancouver
Collaboration metrics
Get a free trial to find more data on influencer audiences, performance, and collaborations.
Everlane's repeat partnerships
Out of 717 unique influencers in our dataset, 69 of them (10%) posted content for Everlane in 3 or more separate calendar months. The most consistent partner is @tamaramory, who has collaborated across 7 months with 13 total posts.
Here are 3 examples of Everlane's repeat influencer partnerships, with links to the sponsored content.
tamaramory x Everlane
![Instagram post by @tamaramory for Everlane. Caption reads: [...] 🖤 The Fall Edit 002 @everlane....](https://images.od.modash.io/8c1a84b11b6aa0c2913af6a802296cadd12bdce3)
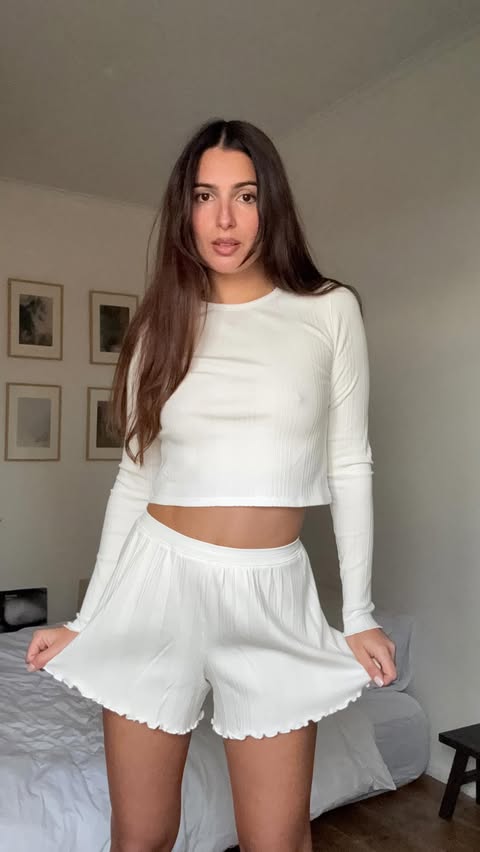
![Instagram post by @tamaramory for Everlane. Caption reads: [...] festive luxury collection by @everlane....](https://images.od.modash.io/930fb308698d79def27817ed354dfbf60ea99e86)
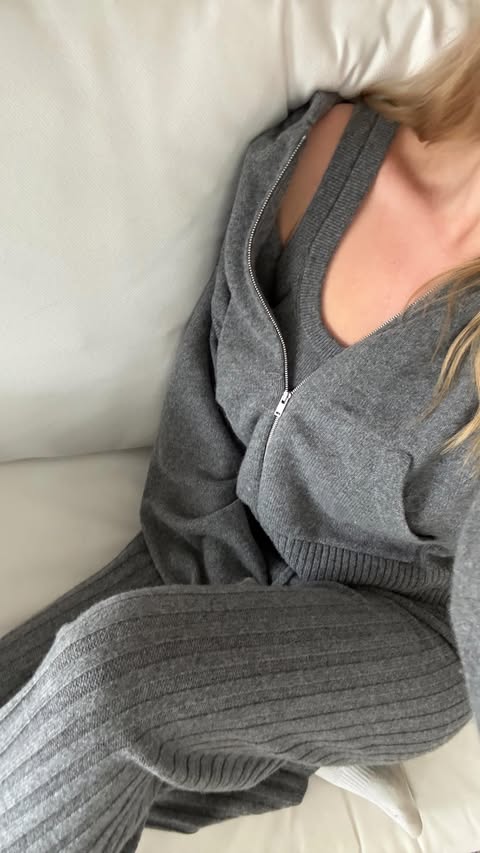
kiaralindeborg x Everlane
![Instagram post by @kiaralindeborg for Everlane. Caption reads: [...] outfits made easy with @everlane 🎄🥂✨....](https://images.od.modash.io/996bc4075a9f6db5b3c56d74b47605adde7ab9a8)
![Instagram post by @kiaralindeborg for Everlane. Caption reads: [...] color palette 🍵🤎🍁 @everlane Fall Edit 002....](https://images.od.modash.io/4fbf636cead3922d4a887f71182a0a9d283cb5c9)
![Instagram post by @kiaralindeborg for Everlane. Caption reads: OOTD with @everlane ‘s Fall Edit 002 [...].](https://images.od.modash.io/8806c450081ae522f3150bf9a372c9f0045d713a)
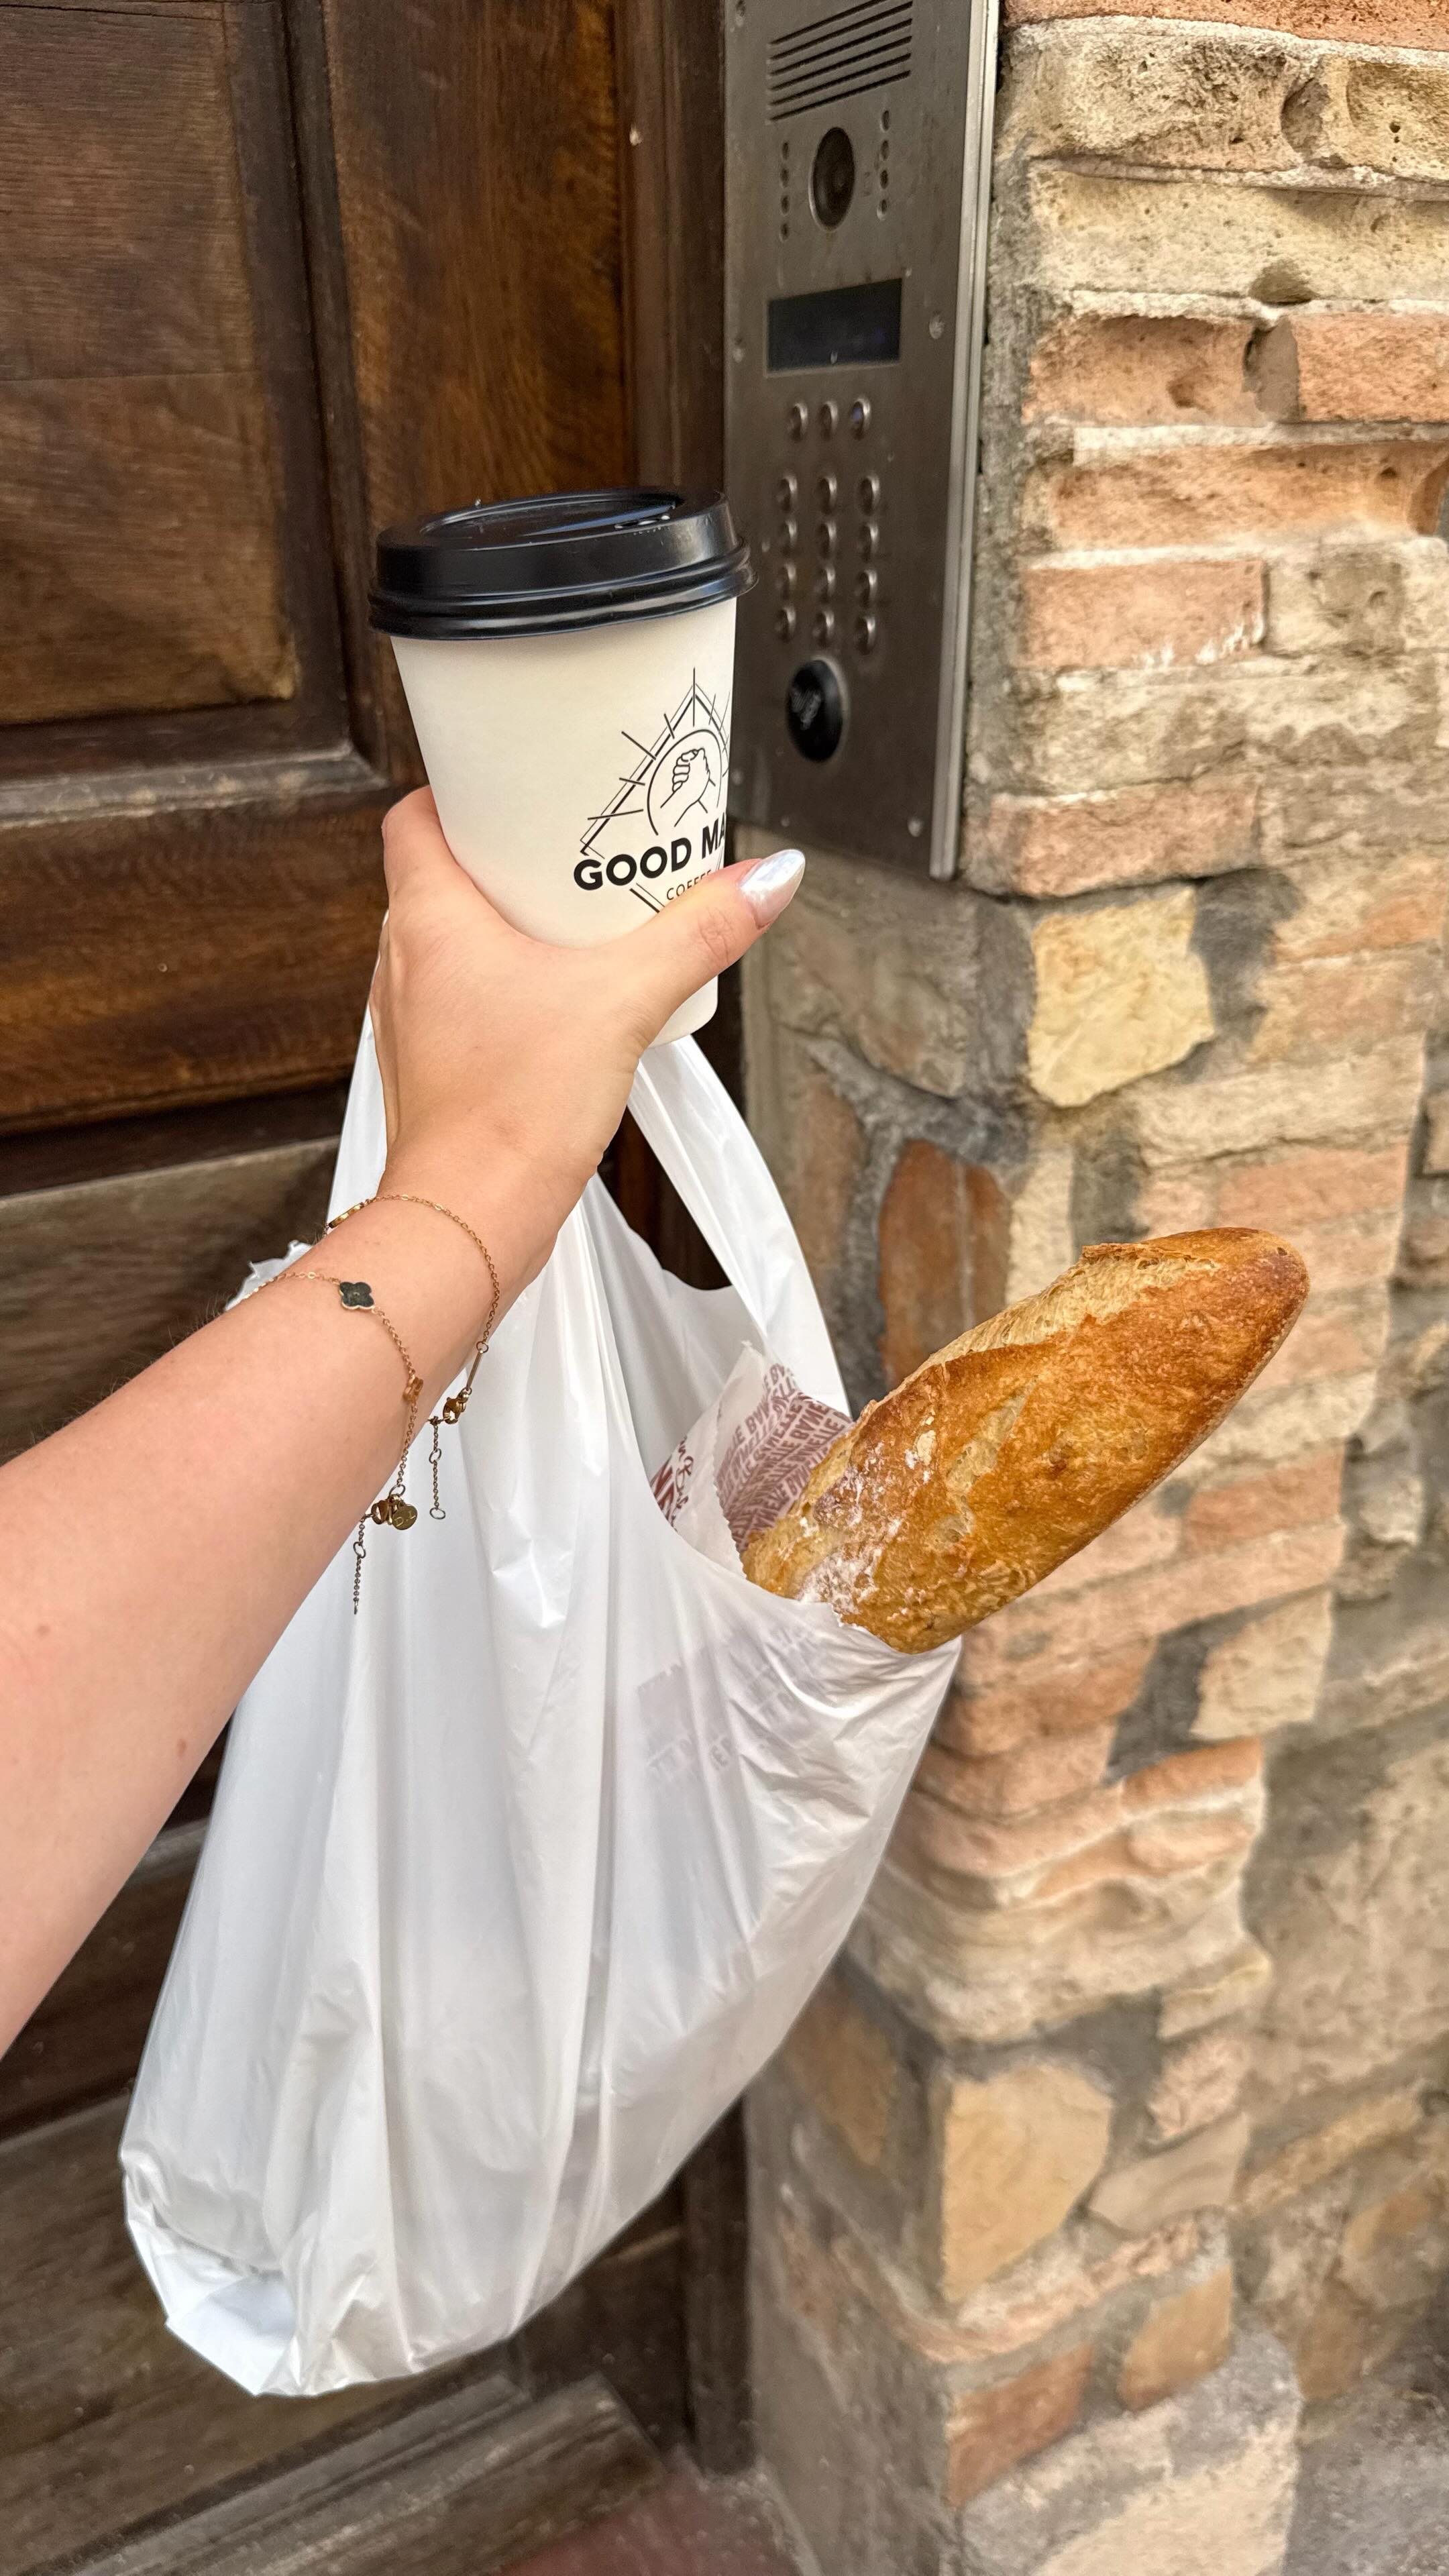
helenelane_ x Everlane
![Instagram post by @helenelane_ for Everlane. Caption reads: @everlane haul 🤍🛍️ #everlanepartner [...].](https://images.od.modash.io/32400f447c3f730118b4a7fcd533fbe7ae35e67f)
💡 Related resource: Long-Term Influencer Partnerships: Pros, Cons & How The Pros Manage Them.
Geographical breakdown
In our dataset, United States is where Everlane had the most influencer activity. 67.4% of their live influencer content in the last 12 months was posted by American influencers.
Based on the percentage of influencer content per market, other important markets include:
- United Kingdom (7.3%)
- Canada (4.6%)
- Brazil (3.3%)
Everlane's influencer activity by market
Here is another example of Everlane collaborating with an influencer in United States.
maddison__lynn x Everlane
![TikTok post by @maddison__lynn for Everlane. Caption reads: [...] layer and this cotton cashmere from....](https://images.od.modash.io/9dce4e9c8d6ebcd99103f89b80820dec44b5291e)
Everlane's influencer activity vs. related brands
Everlane competes for fashion-conscious consumers with brands like ZARA and Kith, especially around wardrobe staples and elevated everyday style. These brands are strong influencer benchmarks for outfit styling, capsule wardrobe content, and drop-driven demand.
Total influencer content
Everlane vs. related brands influencer activity
Total sponsored posts tracked (last 12 months)
ZARA leads with 14.9k sponsored posts, significantly outpacing Kith (1.8k posts) and Everlane (1.5k posts). Across all three brands, the average volume is 6k posts, indicating mature, scaled influencer programs. ZARA has far more total posts than Everlane and Kith.
By social platform
Everlane vs. related brands influencer activity (by social platform)
Sponsored posts by platform
Everlane leads on YouTube, while Kith has the most activity on Instagram and ZARA has the most activity on TikTok. The gap is most notable on TikTok, with ZARA at 14.3k, Everlane at 537, Kith at 372 posts. ZARA's activity is particularly concentrated on TikTok. TikTok is the main driver of ZARA’s post volume, with far more posts there than Everlane and Kith.
By geographical market
Everlane vs. related brands influencer activity (by country)
Estimated sponsored posts in Everlane's top markets
ZARA has the highest estimated sponsored-post volume in United States (4k posts, 27.2%), India (1.6k posts, 10.6%), Italy (1.4k posts, 9.4%), while Kith has the highest estimated sponsored-post volume in Japan (215 posts, 12.1%), Brazil (98 posts, 5.5%), while Everlane has the highest estimated sponsored-post volume in United Kingdom (109 posts, 7.3%), Canada (69 posts, 4.6%). Looking at United States specifically, the split is ZARA at 4k posts (27.2%), Everlane at 1k posts (67.4%), Kith at 844 posts (47.6%). Everlane's strength in United Kingdom may indicate a home-market focus, while ZARA shows broader regional investment.
Read more influencer strategy breakdowns
Looking for more like this? Here are 5 similar influencer marketing strategy breakdowns for other brands:
- ZARA's Influencer Marketing Strategy
- Kith's Influencer Marketing Strategy
- COSRX's Influencer Marketing Strategy
- Vograce's Influencer Marketing Strategy
- FrostBuddy's Influencer Marketing Strategy
Or, if you want to access data like this for your own software or processes, take a look at Modash's API products:
Frequently asked questions
Scaling your influencer program?
When you outgrow your mishmash of spreadsheets & free tools, try Modash. Find & email influencers, track campaigns, ship products & more - all in one place.