KATCH ME Influencer Marketing Strategy
(2026 Data & Insights)
We analyzed 8.7k pieces of influencer content sponsored by KATCH ME over the last 12 months.
This report breaks down where & how KATCH ME invests in influencer marketing, which social platforms they prioritize, top geographical markets, and more.
The data in this report comes from Modash's Brand Collaborations API.
P.S. for a simple list of influencers who have collaborated with KATCH ME, see here: KATCH ME influencers.
Influencer activity throughout the year
KATCH ME's influencer campaigns are active year-round with notable month-to-month fluctuation. The chart below shows month-by-month data for total sponsored posts tracked.
KATCH ME's influencer activity by month
Number of sponsored posts
KATCH ME's sponsored post volume appears to trend upward over the 12-month period, rising from 1k posts in January to 905 in December. The peak month, November, reached 1.1k posts, 54% higher than the monthly average of 721.
Social platforms breakdown
In our dataset (which only includes Instagram, YouTube, and TikTok), this is how the volume of KATCH ME's sponsored influencer collaborations break down by social platform:
- TikTok: 8.5k posts (98.1%)
- Instagram: 165 posts (1.9%)
KATCH ME's influencer activity by platform
Share of sponsored content by social network
TikTok influencer marketing is a clear focus for KATCH ME.
Here are 2 examples of KATCH ME's recent sponsored collaborations (one each for Instagram, TikTok).
molralston x KATCH ME
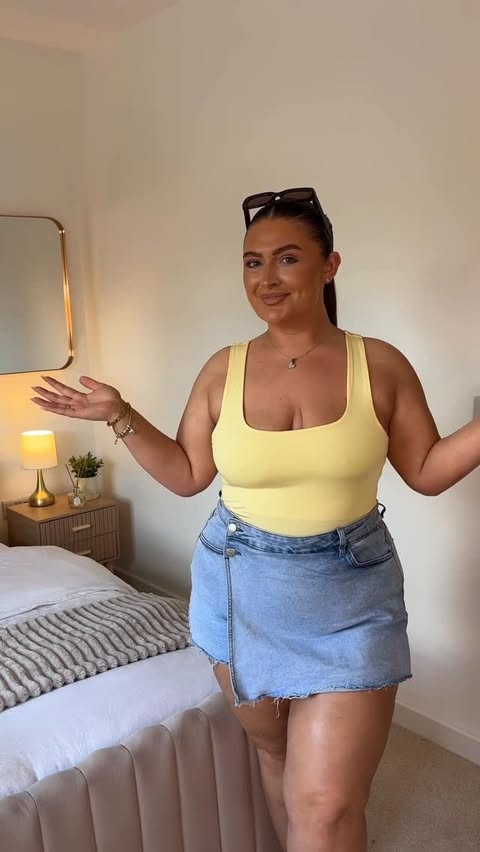
Influencer bio
Postpartum curves + hyper feminine fashion ✨ Style inspiration for REAL bodies 🤍 𝐌𝐎𝐋𝐋𝐘𝐑𝐀 𝐟𝐨𝐫 𝟏𝟓% 𝐨𝐟𝐟 @boohoo 💌 molralstonmedia@gmail.com
Collaboration metrics
Get a free trial to find more data on influencer audiences, performance, and collaborations.
hanandkal x KATCH ME
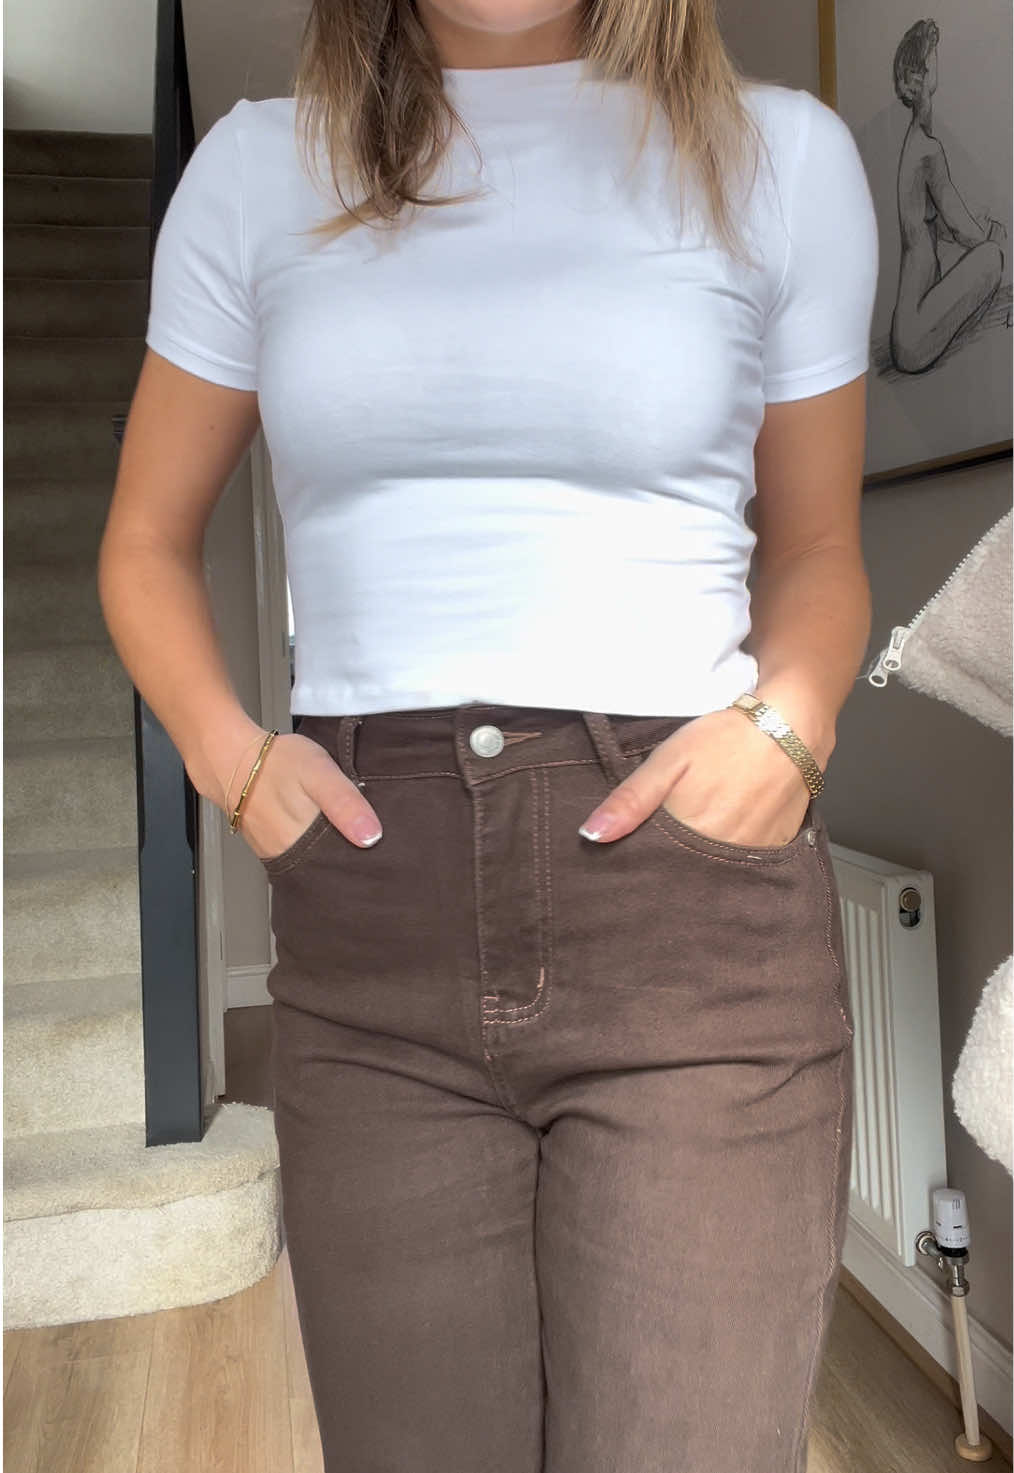
Influencer bio
Two best friends sharing their tiktok finds 🌟 For enquiries: hanandkal@joinmarvellous.com
Collaboration metrics
Get a free trial to find more data on influencer audiences, performance, and collaborations.
If you break this down further by content type on TikTok, this is what it looks like:
- Videos: 99%
- Carousels: 1%
💡 Related resource: How To Find TikTok Influencers.
Influencer audience size breakdown (by views)
For their top social platform (TikTok), here is a breakdown of the type of influencers KATCH ME are collaborating with, by audience size.
Note: this breakdown is based on each influencer's average views (not follower/subscriber count), because views typically correlate more closely with influencer pricing and impact.
KATCH ME's influencers average views (TikTok)
Based on each influencer's average views per post
With 47% of partnerships featuring creators averaging <1K views, KATCH ME's strategy suggests niche targeting and authenticity, likely leveraging collaboration models like gifting and affiliates to work with smaller creators.
Here is an example of a sponsored collaboration with a larger-audience creator on TikTok (534.5k avg views/post):
desireebaca_2 x KATCH ME
![TikTok post by @desireebaca_2 for KATCH ME. Caption reads: [...] comfort and perfect for the curves @Katch Me....](https://images.od.modash.io/264c47a28d8e192f7bd5e69a1f079a527efdae07)
Influencer bio
Mom Lifestyle | Fashion | Affiliate Marketing 💌 desireebacacollab@gmail.com
Collaboration metrics
Get a free trial to find more data on influencer audiences, performance, and collaborations.
And here is another example with a smaller creator on TikTok (9.8k avg views/post):
yordanka_aa x KATCH ME
![TikTok post by @yordanka_aa for KATCH ME. Caption reads: [...] o realizar cualquier actividad diaria!....](https://images.od.modash.io/0a82505feb6568a1ace468e78390c4631fd55d16)
Influencer bio
Collaboration metrics
Get a free trial to find more data on influencer audiences, performance, and collaborations.
KATCH ME's repeat partnerships
Out of 2.8k unique influencers in our dataset, 497 of them (18%) posted content for KATCH ME in 3 or more separate calendar months. The most consistent partner is @amys_beautiful_chaos, who has collaborated across 12 months with 137 total posts.
Here are 3 examples of KATCH ME's repeat influencer partnerships, with links to the sponsored content.
amys_beautiful_chaos x KATCH ME
![TikTok post by @amys_beautiful_chaos for KATCH ME. Caption reads: [...] a comfier pair of jeans! @Katch Me....](https://images.od.modash.io/f11d71a8e9cb200332b06a89671305e9c9b14341)
![TikTok post by @amys_beautiful_chaos for KATCH ME. Caption reads: [...] Don’t walk!!!!!! 😮💨 @Katch Me....](https://images.od.modash.io/6469ad6c4732d1df496f864203b8caf5b745baab)
jaabbex x KATCH ME
![TikTok post by @jaabbex for KATCH ME. Caption reads: [...] never heard this before 😂 #katchme....](https://images.od.modash.io/a6d42a45e552bfecafdd80baee44219639bf8c97)
![TikTok post by @jaabbex for KATCH ME. Caption reads: [...] down for a more snug fit 😍 #katchme....](https://images.od.modash.io/4a59523babc58a05f226f9c106da907e32cf46d0)
![TikTok post by @jaabbex for KATCH ME. Caption reads: [...] Perfect fit all day long 😍 #katchme....](https://images.od.modash.io/24e213b87439038bc95e018404895b1046f41e40)
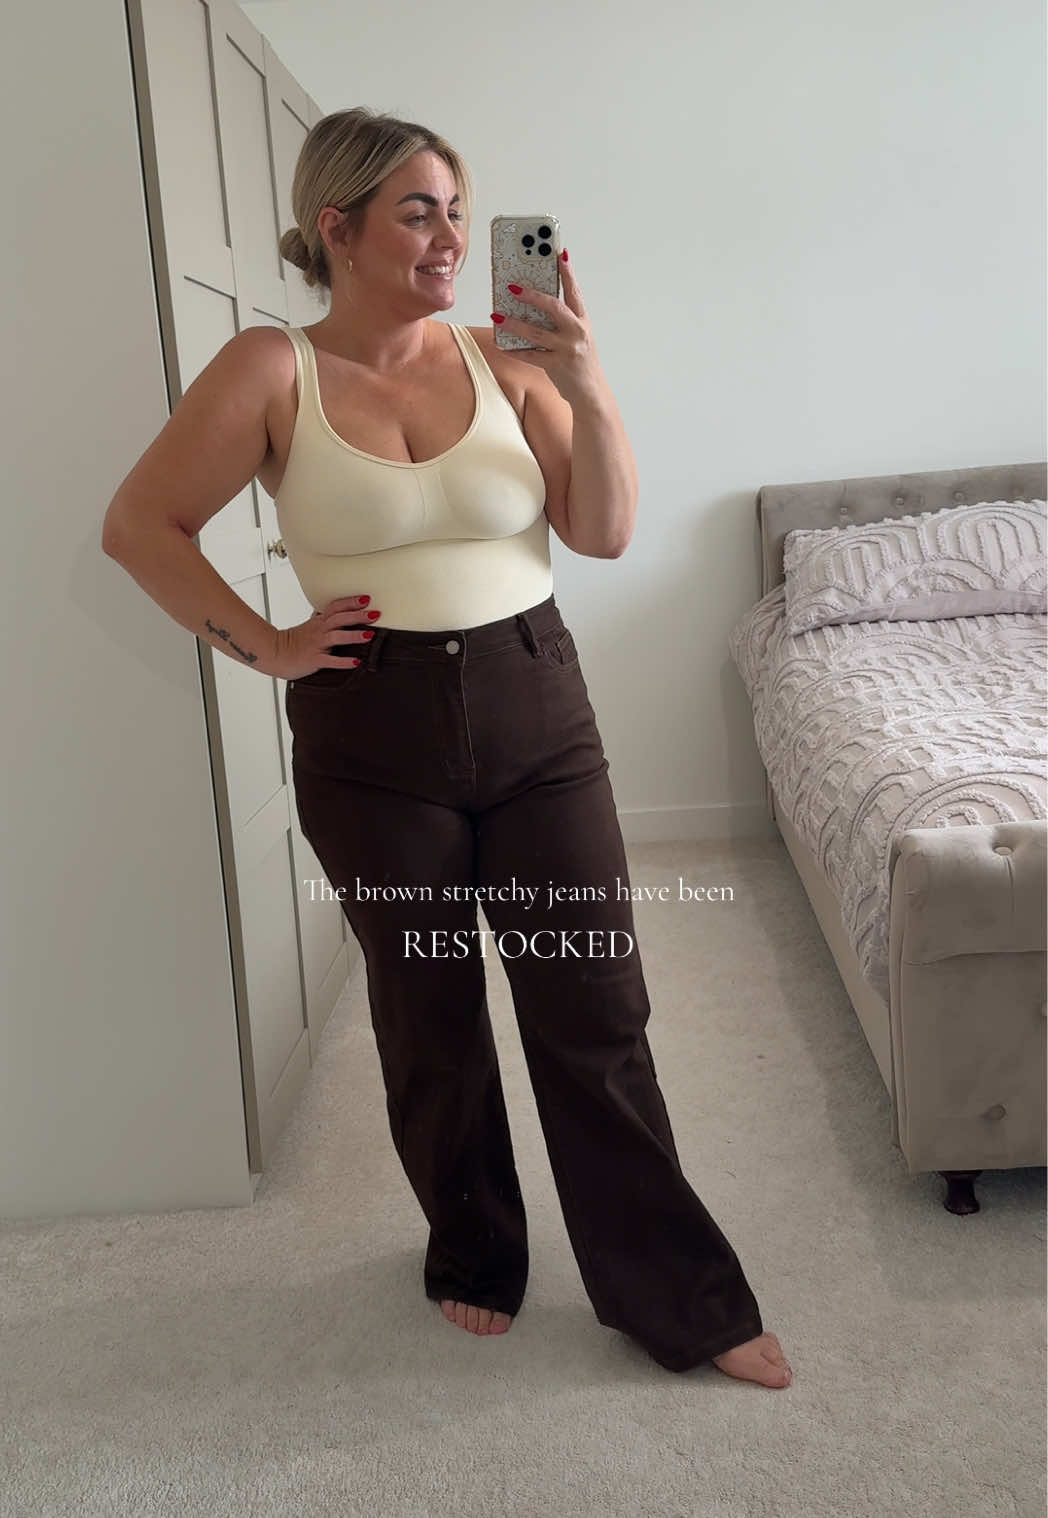
hanandkal x KATCH ME
![TikTok post by @hanandkal for KATCH ME. Caption reads: Katchme jeans! Kallie wearing size 6 [...].](https://images.od.modash.io/a847a8b741400354f29e5ec7fa781b6ace249e33)

💡 Related resource: Long-Term Influencer Partnerships: Pros, Cons & How The Pros Manage Them.
Geographical breakdown
In our dataset, United Kingdom is where KATCH ME had the most influencer activity. 50.2% of their live influencer content in the last 12 months was posted by British influencers.
Based on the percentage of influencer content per market, other important markets include:
- United States (24.1%)
- Spain (3.3%)
- Nigeria (2.7%)
KATCH ME's influencer activity by market
Here is another example of KATCH ME collaborating with an influencer in United Kingdom.
amys_beautiful_chaos x KATCH ME
KATCH ME's influencer activity vs. related brands
KATCH ME competes in women’s fashion with an occasionwear and going-out focus that relies heavily on try-ons. Club L London and OH POLLY target the same dressed-up, social-first audience and are strong influencer benchmarks for event-ready styling.
Total influencer content
KATCH ME vs. related brands influencer activity
Total sponsored posts tracked (last 12 months)
OH POLLY leads with 10.2k sponsored posts, notably outpacing KATCH ME (8.7k posts) and Club L London (2.4k posts). Across all three brands, the average volume is 7.1k posts, indicating mature, scaled influencer programs.
By social platform
KATCH ME vs. related brands influencer activity (by social platform)
Sponsored posts by platform
KATCH ME leads on TikTok, while OH POLLY has the most activity on Instagram and YouTube. The gap is most notable on TikTok, with KATCH ME at 8.5k, OH POLLY at 4.1k, Club L London at 645 posts. KATCH ME's activity is particularly concentrated on TikTok. TikTok activity is led by KATCH ME with 8,494 posts, while Instagram activity is led by OH POLLY with 6,012 posts, each multiple times higher than the next brand on that platform.
By geographical market
KATCH ME vs. related brands influencer activity (by country)
Estimated sponsored posts in KATCH ME's top markets
KATCH ME has the highest estimated sponsored-post volume in United Kingdom (4.3k posts, 50.2%), Spain (286 posts, 3.3%), suggesting a Europe focus, while OH POLLY has the highest estimated sponsored-post volume in United States (4.2k posts, 41.3%), Brazil (406 posts, 4%), while Club L London leads in France with 110 posts (4.5%). Looking at United Kingdom specifically, the split is KATCH ME at 4.3k posts (50.2%), OH POLLY at 2.1k posts (20.7%), Club L London at 676 posts (27.6%). KATCH ME's strength in United Kingdom may indicate a home-market focus, while OH POLLY shows broader regional investment.
Read more influencer strategy breakdowns
Looking for more like this? Here are 5 similar influencer marketing strategy breakdowns for other brands:
- Club L London's Influencer Marketing Strategy
- OH POLLY's Influencer Marketing Strategy
- Coldest's Influencer Marketing Strategy
- Glossier's Influencer Marketing Strategy
- OLLY's Influencer Marketing Strategy
Or, if you want to access data like this for your own software or processes, take a look at Modash's API products:
Frequently asked questions
Scaling your influencer program?
When you outgrow your mishmash of spreadsheets & free tools, try Modash. Find & email influencers, track campaigns, ship products & more - all in one place.