Lull Influencer Marketing Strategy
(2026 Data & Insights)
We analyzed 96 pieces of influencer content sponsored by Lull over the last 12 months.
This report breaks down where & how Lull invests in influencer marketing, which social platforms they prioritize, top geographical markets, and more.
The data in this report comes from Modash's Brand Collaborations API.
P.S. for a simple list of influencers who have collaborated with Lull, see here: Lull influencers.
Influencer activity throughout the year
Lull's influencer campaigns are active year-round with notable month-to-month fluctuation. The chart below shows month-by-month data for total sponsored posts tracked.
Lull's influencer activity by month
Number of sponsored posts
Lull's sponsored post volume appears to trend upward over the 12-month period, rising from 11 posts in January to 8 in December. The peak month, November, reached 19 posts, 111% higher than the monthly average of 9. No sponsored posts were tracked in June, which may suggest a planned pause in influencer activity.
Social platforms breakdown
In our dataset (which only includes Instagram, YouTube, and TikTok), this is how the volume of Lull's sponsored influencer collaborations break down by social platform:
- Instagram: 65 posts (67.7%)
- TikTok: 25 posts (26%)
- YouTube: 6 posts (6.3%)
Lull's influencer activity by platform
Share of sponsored content by social network
Instagram influencer marketing is a clear focus for Lull.
Here are 3 examples of Lull's recent sponsored collaborations (one each for Instagram, TikTok, YouTube).
joechristianguy x Lull

Influencer bio
Jesus is King 🕊 | TX📍 Check out my reels!🎞 Email for business 📧: Joenavarrobusiness@gmail.com
Collaboration metrics
Get a free trial to find more data on influencer audiences, performance, and collaborations.
_alizej x Lull
![TikTok post by @_alizej for Lull. Caption reads: [...] your sleeping arrangements using @Lull Bed....](https://images.od.modash.io/b4493ad098dd57a034db9ac7095a1c67e0bc49d9)
Influencer bio
29 | ATH 🫶🏿 ATL | LIFESTYLE Black creative girlie stumbling through life. 💌: alize@acmtalent.com
Collaboration metrics
Get a free trial to find more data on influencer audiences, performance, and collaborations.
LynetteYoder x Lull
Influencer bio
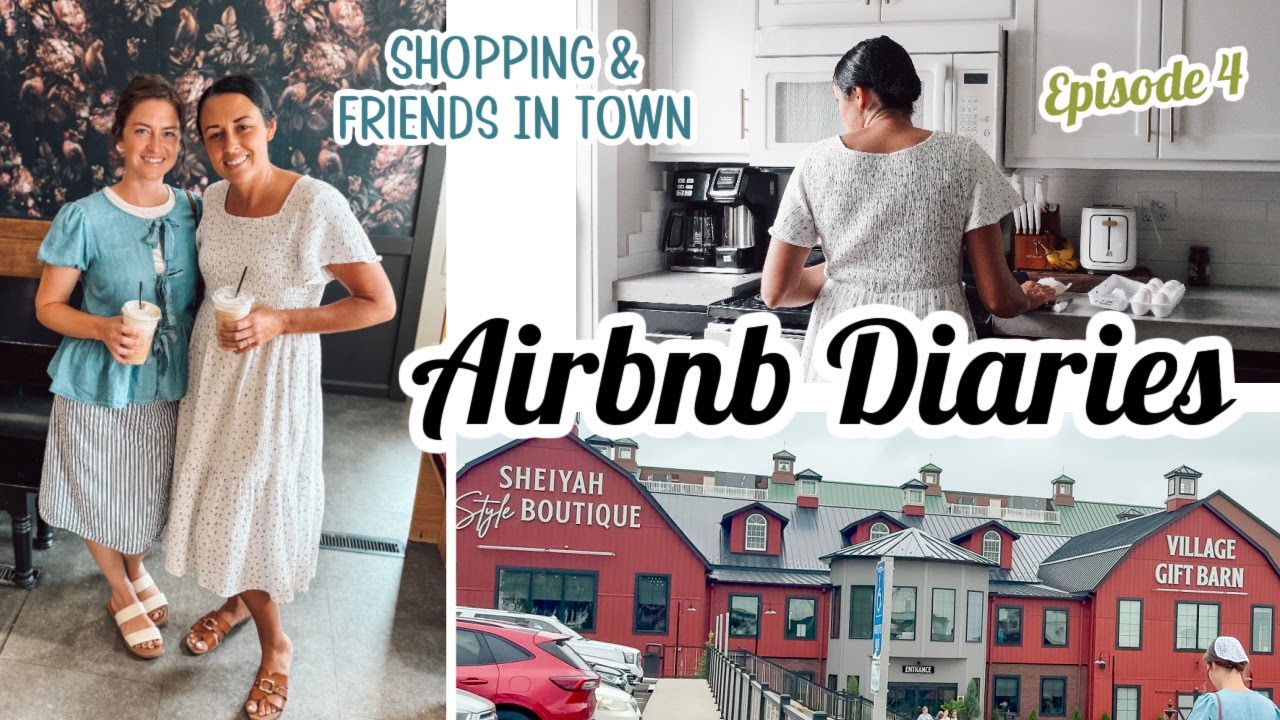
Hi Friends! I’m Lynette Yoder! I do lots of videos documenting our life as a family of 6. Homemaking, Cooking, Decorating & more. I try to Upload every Tuesday. I hope to be an encouragement to Moms and Women especially, in Home Making! We live in Sarasota, Florida and Love it Here! Always Seek Christ!
Collaboration metrics
Get a free trial to find more data on influencer audiences, performance, and collaborations.
If you break this down further by content type on Instagram, this is what it looks like:
- Reels: 95.4%
- Posts: 4.6%
💡 Related resource: How To Find Instagram Influencers.
Influencer audience size breakdown (by views)
For their top social platform (Instagram), here is a breakdown of the type of influencers Lull are collaborating with, by audience size.
Note: this breakdown is based on each influencer's average views (not follower/subscriber count), because views typically correlate more closely with influencer pricing and impact.
Lull's influencers average views (Instagram)
Based on each influencer's average views per post
With 42.1% of partnerships featuring creators averaging 10K-50K views, Lull's strategy suggests cost-efficiency and engagement-focused partnerships. Notably, there appears to be minimal activity in the 500K+ segment.
Here is an example of a sponsored collaboration with a larger-audience creator on Instagram (29.0k avg views/post, 622.2k followers):
educator_andrea x Lull
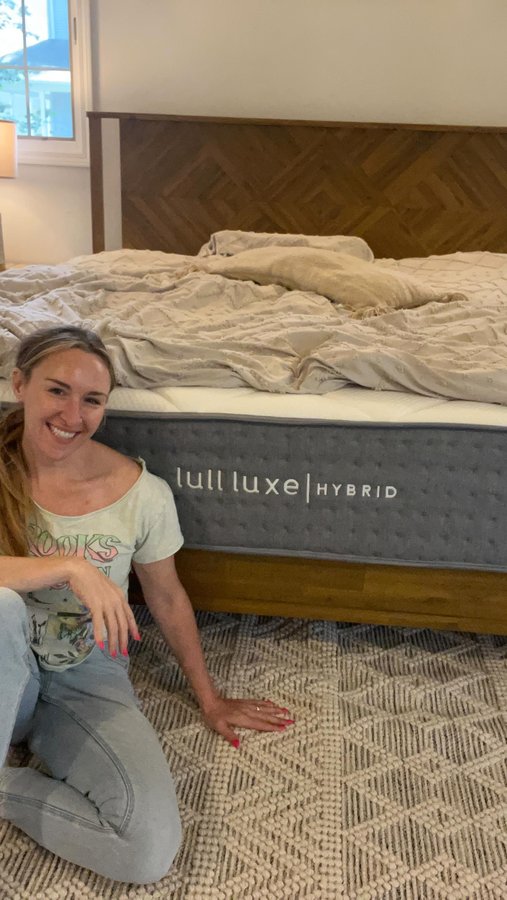
Influencer bio
Educator Andrea BOOK IS OUT NOW! ✨Comedian, educator, podcaster, & teacher bestie✨ Married to @hey_hoosier_daddy Andreamichelle@educatorandrea.com
Collaboration metrics
Get a free trial to find more data on influencer audiences, performance, and collaborations.
And here is another example with a smaller creator on Instagram (2.5k avg views/post, 7.6k followers):
ebonyshamar x Lull
![Instagram post by @ebonyshamar for Lull. Caption reads: [...] is probably the best time to do it 😭🤍....](https://images.od.modash.io/7402ed0acd47bb674e2e2ffc350f2561f600b6df)
Influencer bio
inspired & inspiring✨ 📍nj — phl My Youtube Channel⬇️
Collaboration metrics
Get a free trial to find more data on influencer audiences, performance, and collaborations.
Geographical breakdown
In our dataset, United States is where Lull had the most influencer activity. 78.1% of their live influencer content in the last 12 months was posted by American influencers.
Based on the percentage of influencer content per market, other important markets include:
- United Kingdom (4.2%)
- Brazil (4.1%)
- Canada (3.6%)
Lull's influencer activity by market
Here is another example of Lull collaborating with an influencer in United States.
marissawenzler x Lull
![Instagram post by @marissawenzler for Lull. Caption reads: [...] been quite the adventure but shoutout....](https://images.od.modash.io/e3c80e63e7ab67a9eafa0505b23b43aede521fa6)
Lull's influencer activity vs. related brands
Lull competes in the sleep and comfort category with Brooklinen and Blissy, which similarly use creator-led bedroom makeovers, sleep routine content, and comfort-focused product comparisons.
Total influencer content
Lull vs. related brands influencer activity
Total sponsored posts tracked (last 12 months)
Blissy leads with 2.7k sponsored posts, significantly outpacing Brooklinen (1.2k posts) and Lull (96 posts). Across all three brands, the average volume is 1.3k posts, suggesting established influencer marketing investments. Brooklinen and Blissy have each published many more posts than Lull overall.
By social platform
Lull vs. related brands influencer activity (by social platform)
Sponsored posts by platform
Among these brands, Brooklinen leads on Instagram and YouTube and Blissy leads on TikTok. The gap is most notable on TikTok, with Blissy at 2.7k, Brooklinen at 676, Lull at 25 posts. Blissy's activity is particularly concentrated on TikTok. On TikTok, Blissy has published far more posts than Brooklinen and Lull.
By geographical market
Lull vs. related brands influencer activity (by country)
Estimated sponsored posts in Lull's top markets
Brooklinen has the highest estimated sponsored-post volume in United States (910 posts, 76.9%), Canada (81 posts, 6.8%), United Kingdom (65 posts, 5.5%), suggesting a North America focus, while Lull leads in Brazil with 4 posts (4.1%). Looking at United States specifically, the split is Brooklinen at 910 posts (76.9%), Lull at 75 posts (78.1%).
Read more influencer strategy breakdowns
Looking for more like this? Here are 5 similar influencer marketing strategy breakdowns for other brands:
- Brooklinen's Influencer Marketing Strategy
- Blissy's Influencer Marketing Strategy
- Ooni's Influencer Marketing Strategy
- callitspring's Influencer Marketing Strategy
- AYBL's Influencer Marketing Strategy
Or, if you want to access data like this for your own software or processes, take a look at Modash's API products:
Frequently asked questions
Scaling your influencer program?
When you outgrow your mishmash of spreadsheets & free tools, try Modash. Find & email influencers, track campaigns, ship products & more - all in one place.