AYBL Influencer Marketing Strategy
(2026 Data & Insights)
We analyzed 45.2k pieces of influencer content sponsored by AYBL over the last 12 months.
This report breaks down where & how AYBL invests in influencer marketing, which social platforms they prioritize, top geographical markets, and more.
The data in this report comes from Modash's Brand Collaborations API.
P.S. for a simple list of influencers who have collaborated with AYBL, see here: AYBL influencers.
Influencer activity throughout the year
AYBL's influencer campaigns are active year-round with notable month-to-month fluctuation. The chart below shows month-by-month data for total sponsored posts tracked.
AYBL's influencer activity by month
Number of sponsored posts
AYBL's influencer output appears relatively consistent throughout the year, averaging about 3.8k sponsored posts per month. March recorded the highest volume at 5.6k posts (48% above average), while June was the quietest at 1.6k posts.
Social platforms breakdown
In our dataset (which only includes Instagram, YouTube, and TikTok), this is how the volume of AYBL's sponsored influencer collaborations break down by social platform:
- TikTok: 24.0k posts (53.1%)
- Instagram: 21.1k posts (46.7%)
- YouTube: 73 posts (0.2%)
AYBL's influencer activity by platform
Share of sponsored content by social network
TikTok influencer marketing is a clear focus for AYBL.
Here are 3 examples of AYBL's recent sponsored collaborations (one each for Instagram, TikTok, YouTube).
leanedsns x AYBL
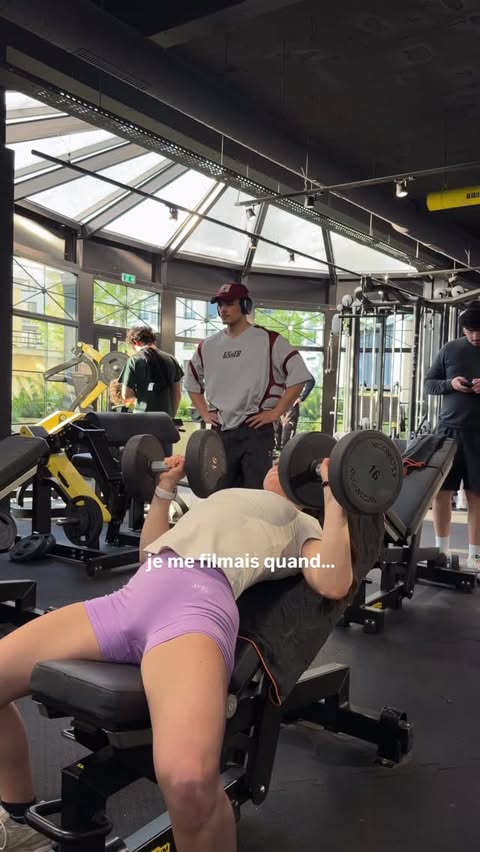
Influencer bio
mini fitgirl @aybl athlete | cd : leane @nutripurefr @holysquad.fr | cd : leane 💌 leanedsnspro@gmail.com
Collaboration metrics
Get a free trial to find more data on influencer audiences, performance, and collaborations.
danifitnesss_ x AYBL
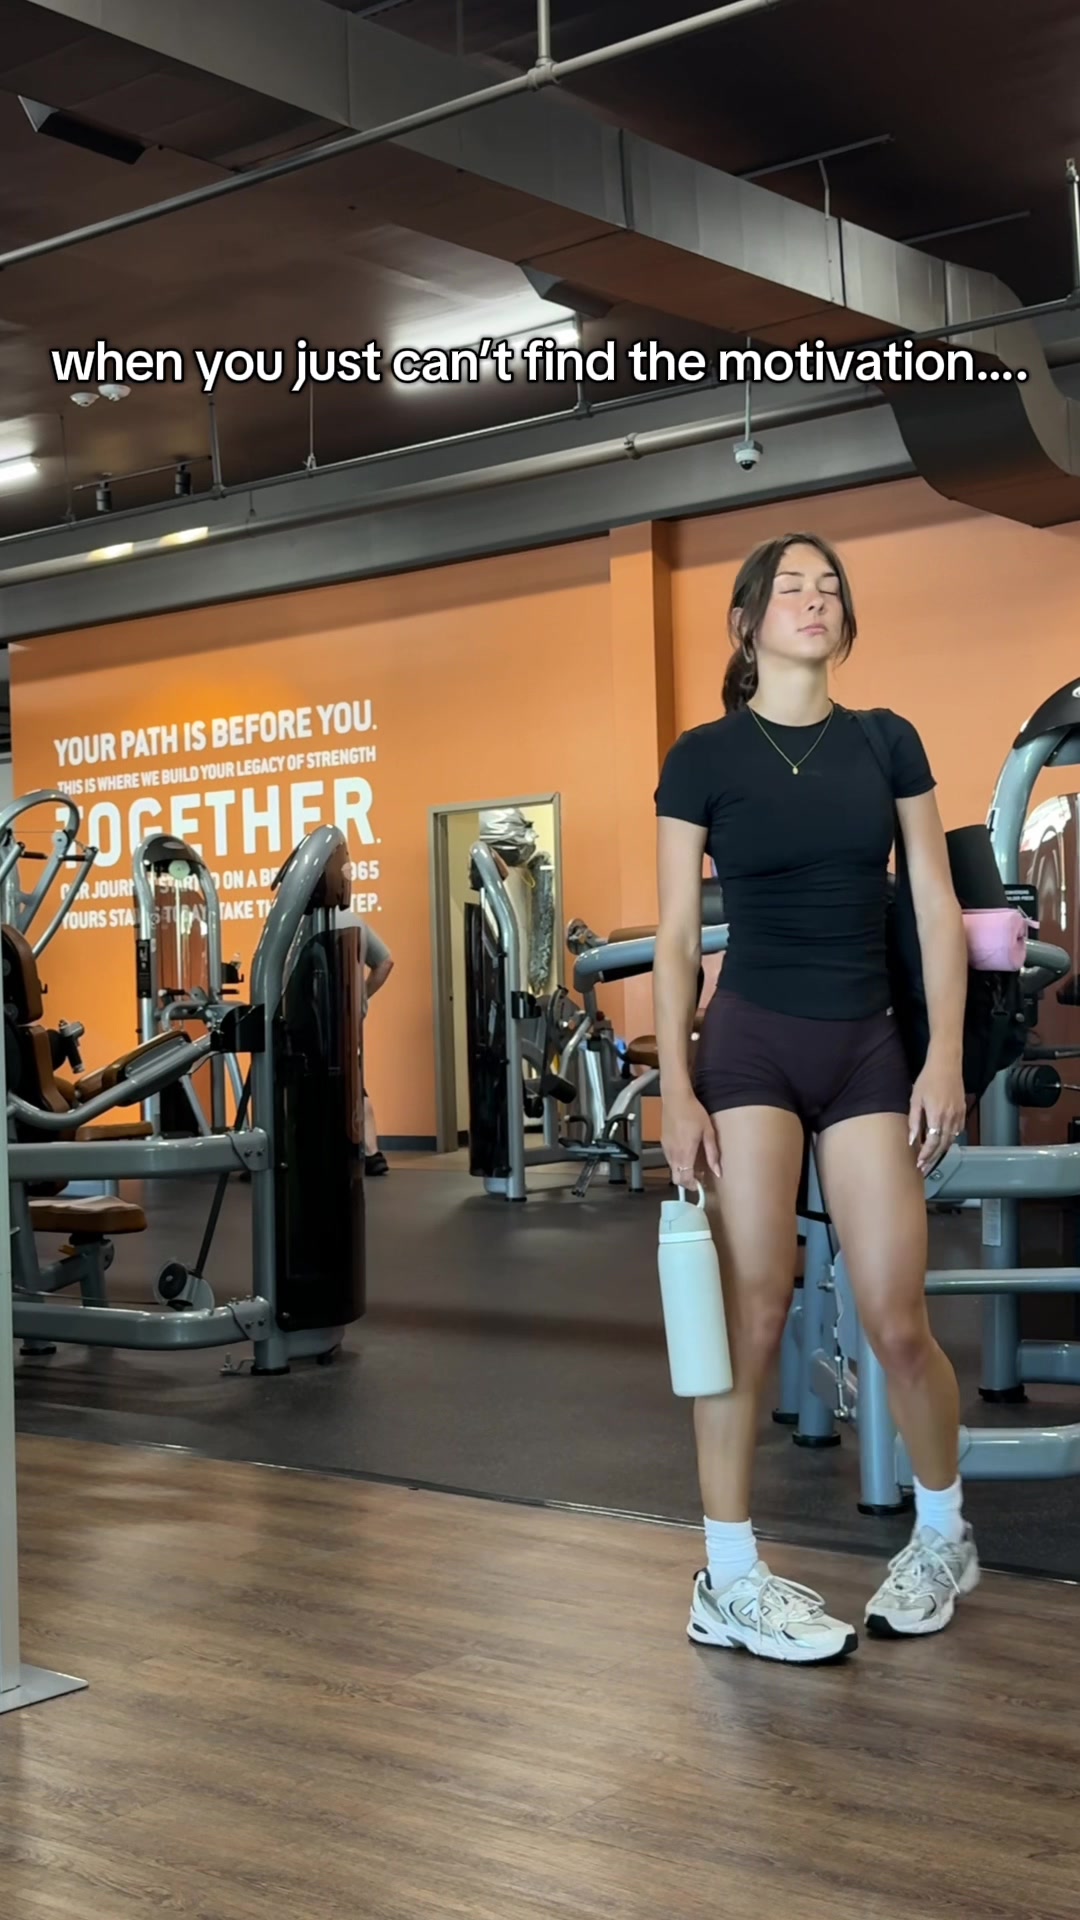
Influencer bio
FITNESS 4 THE GIRLS💗 IG: danifitnesss_ @DFYNE @AYBL dc: DANI
Collaboration metrics
Get a free trial to find more data on influencer audiences, performance, and collaborations.
VintageGenetics x AYBL
![YouTube post by @VintageGenetics for AYBL. Caption reads: [...] 👕Get the best workout clothing at AYBL: |....](https://images.od.modash.io/b8c1c1122d3303802ac52374548425a095c815df)
Influencer bio
Official YouTube Channel of IFBB Pro and 2x Arnold Classic CHampion "The Dutch Oak" Wesley Vissers. The best supplements on the market: https://www.esn.com/ Code: Wesley My Clothing: https://vintagegenetics.com/ My own Gym: https://www.vintagegym.nl/
Collaboration metrics
Get a free trial to find more data on influencer audiences, performance, and collaborations.
If you break this down further by content type on TikTok, this is what it looks like:
- Videos: 90.8%
- Carousels: 9.2%
💡 Related resource: How To Find TikTok Influencers.
Influencer audience size breakdown (by views)
For their top social platform (TikTok), here is a breakdown of the type of influencers AYBL are collaborating with, by audience size.
Note: this breakdown is based on each influencer's average views (not follower/subscriber count), because views typically correlate more closely with influencer pricing and impact.
AYBL's influencers average views (TikTok)
Based on each influencer's average views per post
With 37.3% of partnerships featuring creators averaging 1K-5K views, AYBL's strategy suggests niche targeting and authenticity, likely leveraging collaboration models like gifting and affiliates to work with smaller creators.
Here is an example of a sponsored collaboration with a larger-audience creator on TikTok (506.4k avg views/post):
juliiaannne x AYBL
![TikTok post by @juliiaannne for AYBL. Caption reads: [...] was a much needed quick workout! Try it!....](https://images.od.modash.io/1e758d71416b34bc8d3f5923b50059a139191245)
Influencer bio
Buckedup code-Jules14-20% Funny/Fit/tall gym girl
Collaboration metrics
Get a free trial to find more data on influencer audiences, performance, and collaborations.
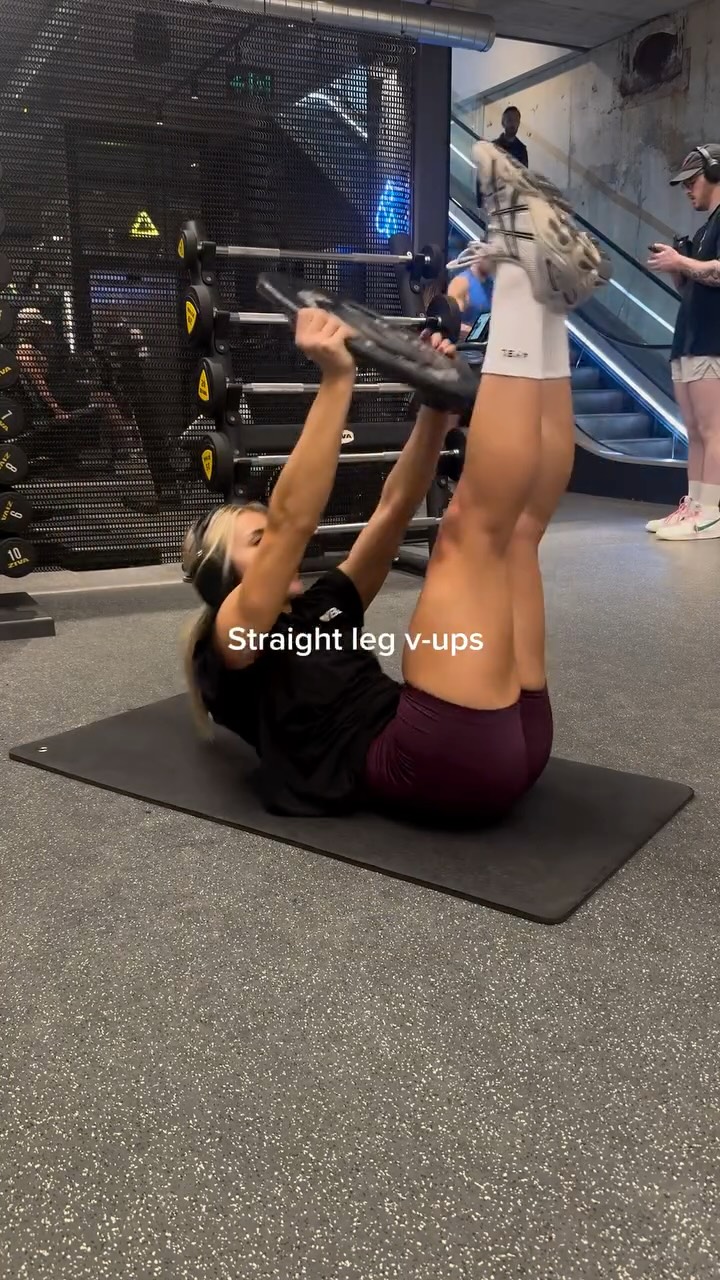
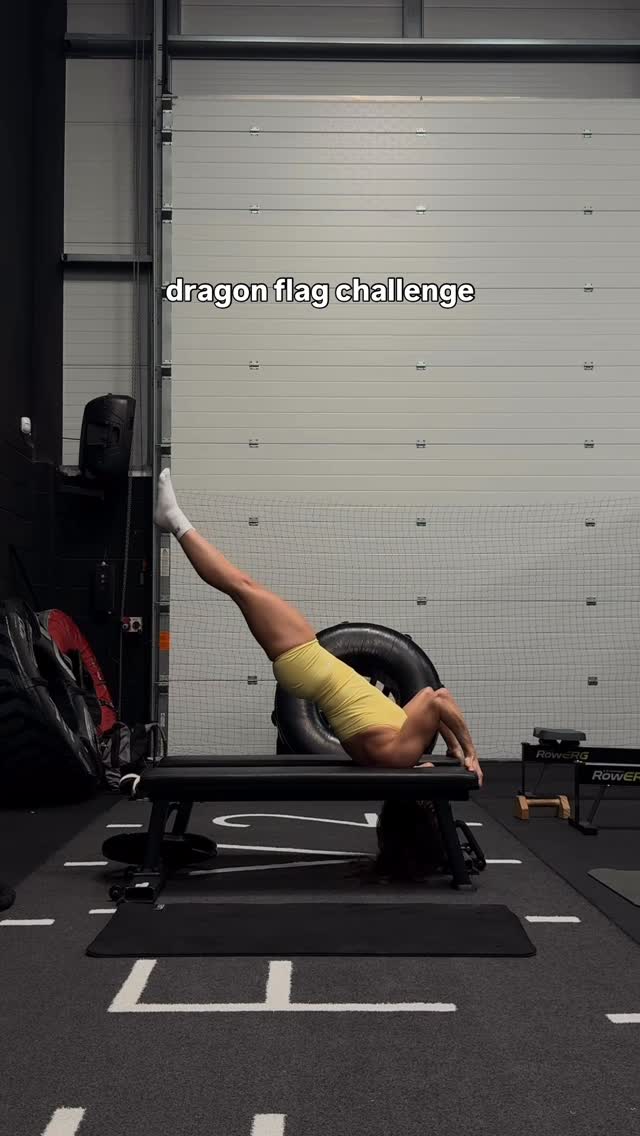
And here is another example with a smaller creator on TikTok (10.0k avg views/post):
reesemckennafaz x AYBL
![TikTok post by @reesemckennafaz for AYBL. Caption reads: [...] thankful!! #wieiadrealistic #vdayedition....](https://images.od.modash.io/582b13b03ec69d462c61b7c5581e8bdfcbaa903d)
Influencer bio
follower of Christ you are a product of your own efforts @AYBL "REESEM" more on insta! 💌 reesefazio08@yahoo.com
Collaboration metrics
Get a free trial to find more data on influencer audiences, performance, and collaborations.
AYBL's repeat partnerships
Out of 2.8k unique influencers in our dataset, 680 of them (24%) posted content for AYBL in 3 or more separate calendar months. The most consistent partner is @nurse_sunee, who has collaborated across 13 months with 263 total posts.
Here are 3 examples of AYBL's repeat influencer partnerships, with links to the sponsored content.
gofitan x AYBL
dailyjlh x AYBL
![Instagram post by @dailyjlh for AYBL. Caption reads: [...] perfect weddingym outfit from @aybl 👰♀️....](https://images.od.modash.io/9d482f63fb894d3b8699a5ea628b3416b836aac6)
![Instagram post by @dailyjlh for AYBL. Caption reads: [...] my app @traindailyjlh Wearing @AYBL form....](https://images.od.modash.io/8f65159996b990718ca2d571bbc5129db0ed1520)
food.fit.maya x AYBL
![Instagram post by @food.fit.maya for AYBL. Caption reads: [...] version of themselves 💖 @aybl code MAYA10....](https://images.od.modash.io/7652edd288645403d007ad19627fca4a8ca0defa)
![Instagram post by @food.fit.maya for AYBL. Caption reads: [...] that passion of yours 🏃♀️ @aybl code....](https://images.od.modash.io/823d6afcc370caf9e891df3d724d34227444b398)
![Instagram post by @food.fit.maya for AYBL. Caption reads: [...] to power through glutes💖🥰 @aybl giving me....](https://images.od.modash.io/6592d2308c4951e8cd4c8d0fb4ee86f5e5c9df16)
💡 Related resource: Long-Term Influencer Partnerships: Pros, Cons & How The Pros Manage Them.
Geographical breakdown
In our dataset, United States is where AYBL had the most influencer activity. 46.9% of their live influencer content in the last 12 months was posted by American influencers.
Based on the percentage of influencer content per market, other important markets include:
- United Kingdom (20.5%)
- Canada (4%)
- The Netherlands (3.4%)
AYBL's influencer activity by market
Here is another example of AYBL collaborating with an influencer in United States.
gabbyy.lifts x AYBL
![TikTok post by @gabbyy.lifts for AYBL. Caption reads: [...] #gymrat @Gymshark @DFYNE @NVGTN @AYBL....](https://images.od.modash.io/bb0d8504bdbd9d054029a7ba120f108075a2c730)
AYBL's influencer activity vs. related brands
AYBL competes in women’s gymwear and athleisure sets, where boandtee and Nvgtn target the same fit-focused audience. All three brands are heavily driven by influencer try-ons, gym lifestyle creators, and community challenges.
Total influencer content
AYBL vs. related brands influencer activity
Total sponsored posts tracked (last 12 months)
AYBL leads with 45.2k sponsored posts, significantly outpacing boandtee (2.5k posts) and Nvgtn (2k posts). Across all three brands, the average volume is 16.5k posts, indicating mature, scaled influencer programs. AYBL has far more total posts than boandtee and Nvgtn combined.
By social platform
AYBL vs. related brands influencer activity (by social platform)
Sponsored posts by platform
AYBL leads on Instagram, TikTok, and YouTube. The gap is most notable on TikTok, with AYBL at 24k, boandtee at 699, Nvgtn at 537 posts. boandtee's activity is particularly concentrated on Instagram. Across Instagram and TikTok, AYBL has many more posts than boandtee and Nvgtn.
By geographical market
AYBL vs. related brands influencer activity (by country)
Estimated sponsored posts in AYBL's top markets
AYBL has the highest estimated sponsored-post volume in United States (21k posts, 46.9%), United Kingdom (9.3k posts, 20.5%), Canada (1.8k posts, 4%), suggesting a North America focus, while boandtee leads in Australia with 102 posts (4.1%). Looking at United States specifically, the split is AYBL at 21k posts (46.9%), Nvgtn at 1.4k posts (71.4%), boandtee at 869 posts (34.9%). AYBL's strength in United States and United Kingdom may indicate a home-market focus, while boandtee shows broader regional investment.
Read more influencer strategy breakdowns
Looking for more like this? Here are 5 similar influencer marketing strategy breakdowns for other brands:
- boandtee's Influencer Marketing Strategy
- Nvgtn's Influencer Marketing Strategy
- La La Land Kind Cafe's Influencer Marketing Strategy
- OneSkin's Influencer Marketing Strategy
- BK Beauty's Influencer Marketing Strategy
Or, if you want to access data like this for your own software or processes, take a look at Modash's API products:
Frequently asked questions
Scaling your influencer program?
When you outgrow your mishmash of spreadsheets & free tools, try Modash. Find & email influencers, track campaigns, ship products & more - all in one place.