Briogeo Influencer Marketing Strategy
(2026 Data & Insights)
We analyzed 1.9k pieces of influencer content sponsored by Briogeo over the last 12 months.
This report breaks down where & how Briogeo invests in influencer marketing, which social platforms they prioritize, top geographical markets, and more.
The data in this report comes from Modash's Brand Collaborations API.
P.S. for a simple list of influencers who have collaborated with Briogeo, see here: Briogeo influencers.
Influencer activity throughout the year
Briogeo's influencer campaigns are active year-round with notable month-to-month fluctuation. The chart below shows month-by-month data for total sponsored posts tracked.
Briogeo's influencer activity by month
Number of sponsored posts
Briogeo's influencer output appears relatively consistent throughout the year, averaging about 154 sponsored posts per month. April recorded the highest volume at 194 posts (26% above average), while June was the quietest at 78 posts.
Social platforms breakdown
In our dataset (which only includes Instagram, YouTube, and TikTok), this is how the volume of Briogeo's sponsored influencer collaborations break down by social platform:
- TikTok: 1.1k posts (62.1%)
- Instagram: 696 posts (37.6%)
- YouTube: 6 posts (0.3%)
Briogeo's influencer activity by platform
Share of sponsored content by social network
TikTok influencer marketing is a clear focus for Briogeo.
Here are 2 examples of Briogeo's recent sponsored collaborations (one each for Instagram, TikTok).
chelleyb x Briogeo
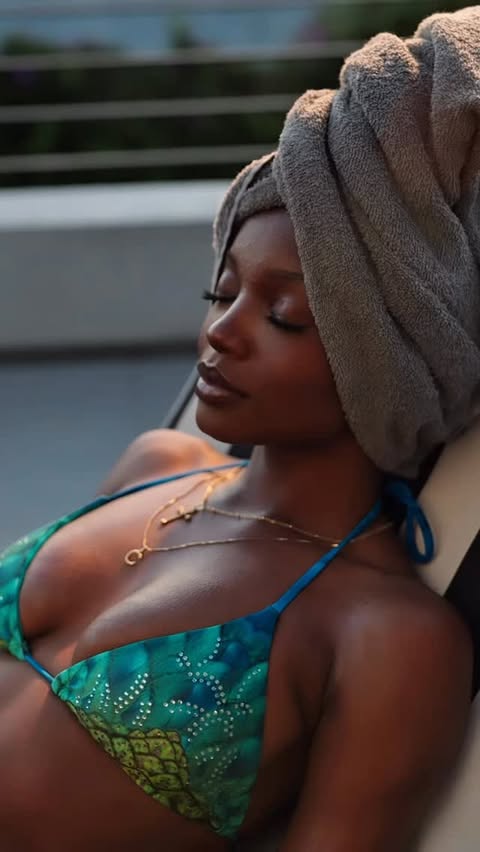
Influencer bio
miami | new york | los angeles most loved 🇭🇹
Collaboration metrics
Get a free trial to find more data on influencer audiences, performance, and collaborations.
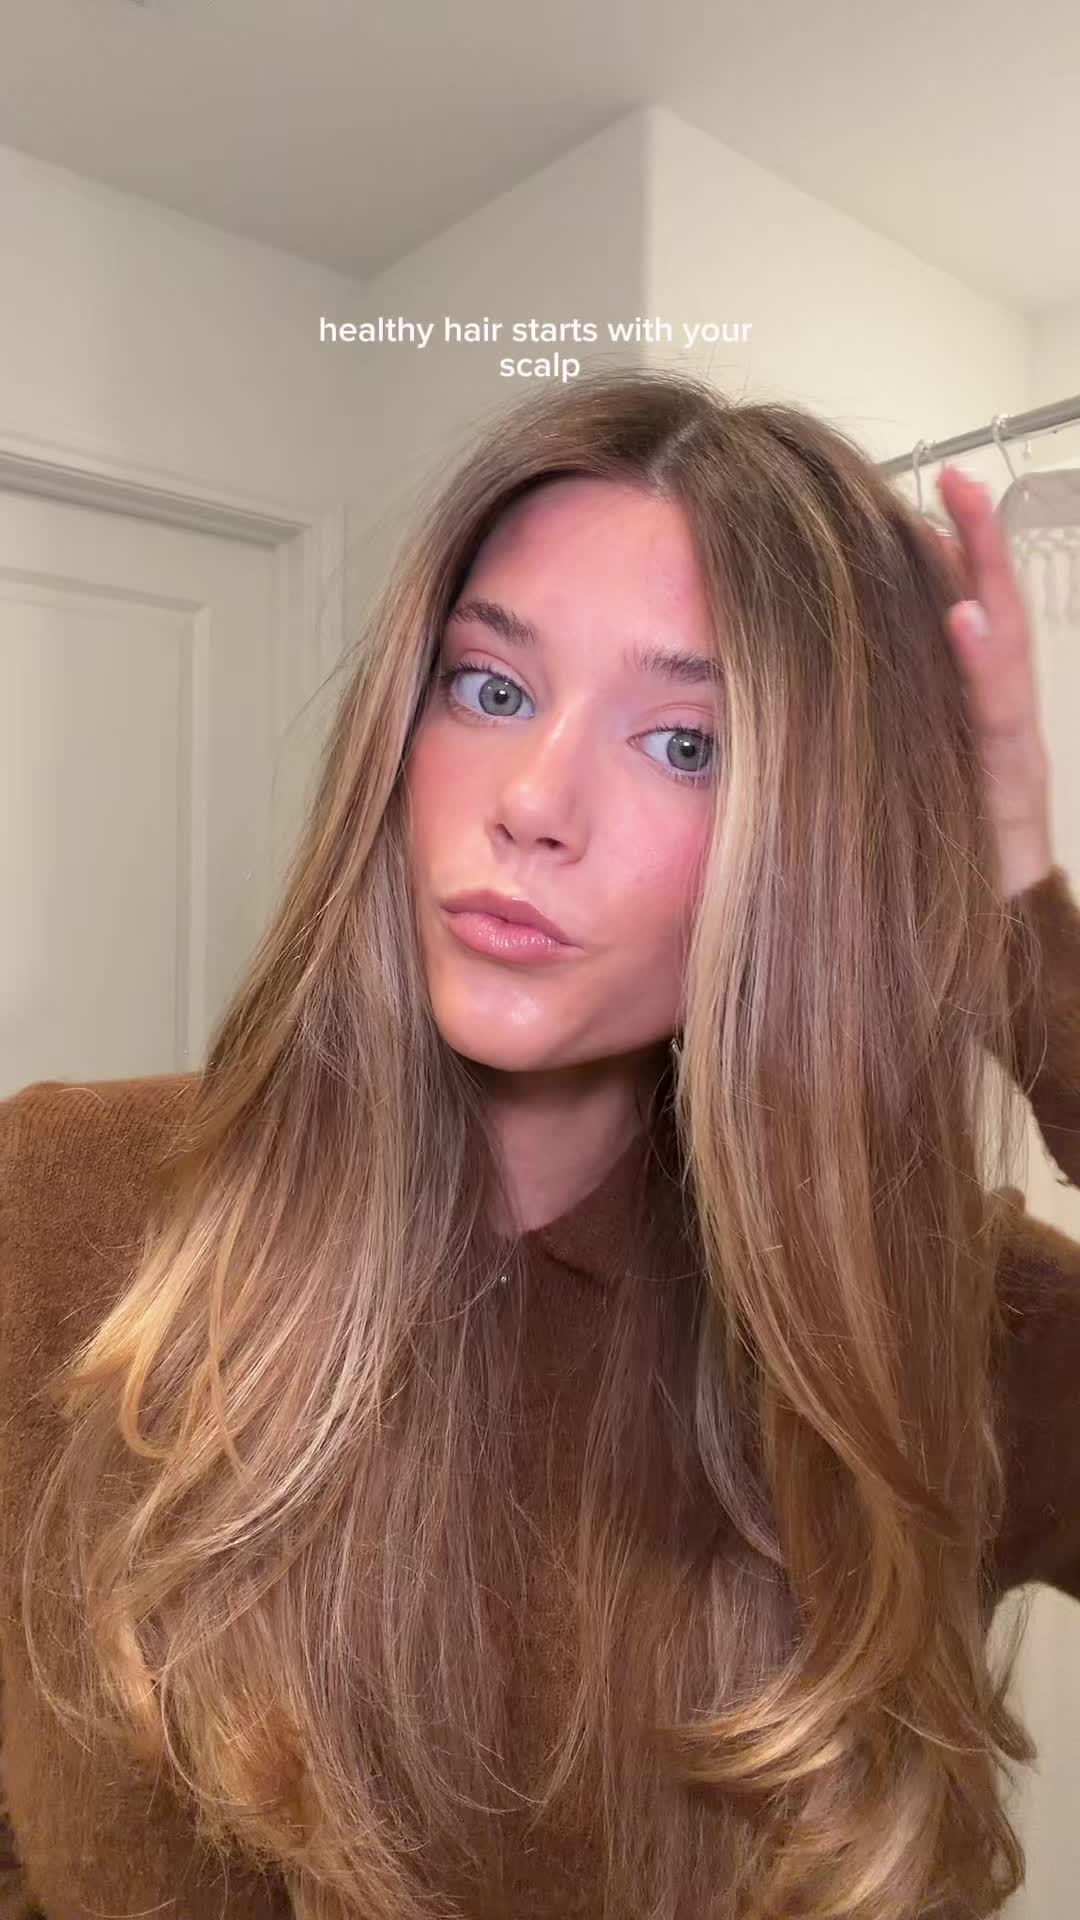
camrynelyse_ x Briogeo
![TikTok post by @camrynelyse_ for Briogeo. Caption reads: [...] products that actually perform from @Briogeo....](https://images.od.modash.io/c9fdfaa483fe44491df053f03d8d05c86f74bed3)
Influencer bio
be the light. fragrance ⋆ beauty ⋆ natural hair camrynelysemanagement@gmail.com
Collaboration metrics
Get a free trial to find more data on influencer audiences, performance, and collaborations.
If you break this down further by content type on TikTok, this is what it looks like:
- Videos: 96.3%
- Carousels: 3.7%
💡 Related resource: How To Find TikTok Influencers.
Influencer audience size breakdown (by views)
For their top social platform (TikTok), here is a breakdown of the type of influencers Briogeo are collaborating with, by audience size.
Note: this breakdown is based on each influencer's average views (not follower/subscriber count), because views typically correlate more closely with influencer pricing and impact.
Briogeo's influencers average views (TikTok)
Based on each influencer's average views per post
Briogeo's creator selection appears relatively diversified across size tiers, with no single segment dominating. This suggests a balanced approach to influencer partnerships, spreading investment across different audience sizes.
Here is an example of a sponsored collaboration with a larger-audience creator on TikTok (405.7k avg views/post):
dhivya.srii x Briogeo
![TikTok post by @dhivya.srii for Briogeo. Caption reads: [...] she loves it!! @sephora @sephoracanada....](https://images.od.modash.io/6dd584383122a32743e20f80a7a97885fe9e33c7)
Influencer bio
your brown girl bestie <3 📩 dhivya@abouttalentagency.com ON IG & YT & SNAP
Collaboration metrics
Get a free trial to find more data on influencer audiences, performance, and collaborations.
And here is another example with a smaller creator on TikTok (9.9k avg views/post):
itsdeepie x Briogeo
![TikTok post by @itsdeepie for Briogeo. Caption reads: [...] shiny hair is in this cute pink bottle:....](https://images.od.modash.io/a59c26704e4d4da34ea760bdaefefe8a34f8c9c9)
Influencer bio
Montreal your favorite PunjaBae 🪞🫧🦋 💌 deepieklair@gmail.com
Collaboration metrics
Get a free trial to find more data on influencer audiences, performance, and collaborations.
Briogeo's repeat partnerships
Out of 1.3k unique influencers in our dataset, 19 of them (1%) posted content for Briogeo in 3 or more separate calendar months. The most consistent partner is @chlogeddes, who has collaborated across 8 months with 11 total posts.
Here are 3 examples of Briogeo's repeat influencer partnerships, with links to the sponsored content.
mananamariee x Briogeo
![Instagram post by @mananamariee for Briogeo. Caption reads: Briogeo Rosemary Pre-Wash Oil before a [...].](https://images.od.modash.io/ce9246c23489ca9dd4ad6ba34bd69c76631b1f80)
![Instagram post by @mananamariee for Briogeo. Caption reads: [...] to a slick back hair is @briogeo Style +....](https://images.od.modash.io/bfcec30c374db94096c37c00ab94d58662bb6e8e)
alis.appetitee x Briogeo
![TikTok post by @alis.appetitee for Briogeo. Caption reads: [...] wellness vlog🍒🧚🎀🌷 @Gisou @Briogeo....](https://images.od.modash.io/5df3f5391bb7427f757bd30dbaa27a4ae342190d)
![TikTok post by @alis.appetitee for Briogeo. Caption reads: [...] @Bloom Nutrition @LolaVie @Briogeo @DFYNE....](https://images.od.modash.io/efaa4278d896361710b3e6640590b5bb5f0143fa)
![TikTok post by @alis.appetitee for Briogeo. Caption reads: [...] Good Patch haircare @LolaVie @Briogeo....](https://images.od.modash.io/c14d01c58e3e0712f5fce4c58a03ecb76bcba5db)
autymsanson x Briogeo
![Instagram post by @autymsanson for Briogeo. Caption reads: [...] in my routine 🤍 I use the @briogeo Scalp....](https://images.od.modash.io/ddd10fdad363cde737bdcd8c31ff826385350c93)
![Instagram post by @autymsanson for Briogeo. Caption reads: [...] humidity protection?! the NEW @briogeo Don’t....](https://images.od.modash.io/78f8deecde4eca2a0c13f57ab9ccf2463212a99f)
![Instagram post by @autymsanson for Briogeo. Caption reads: [...] way to try these iconic @briogeo products is....](https://images.od.modash.io/825875db2f3fbe70d3dd82907b548823c1119831)
💡 Related resource: Long-Term Influencer Partnerships: Pros, Cons & How The Pros Manage Them.
Geographical breakdown
In our dataset, United States is where Briogeo had the most influencer activity. 64.2% of their live influencer content in the last 12 months was posted by American influencers.
Based on the percentage of influencer content per market, other important markets include:
- Brazil (7.9%)
- United Kingdom (5.8%)
- Canada (4.8%)
Briogeo's influencer activity by market
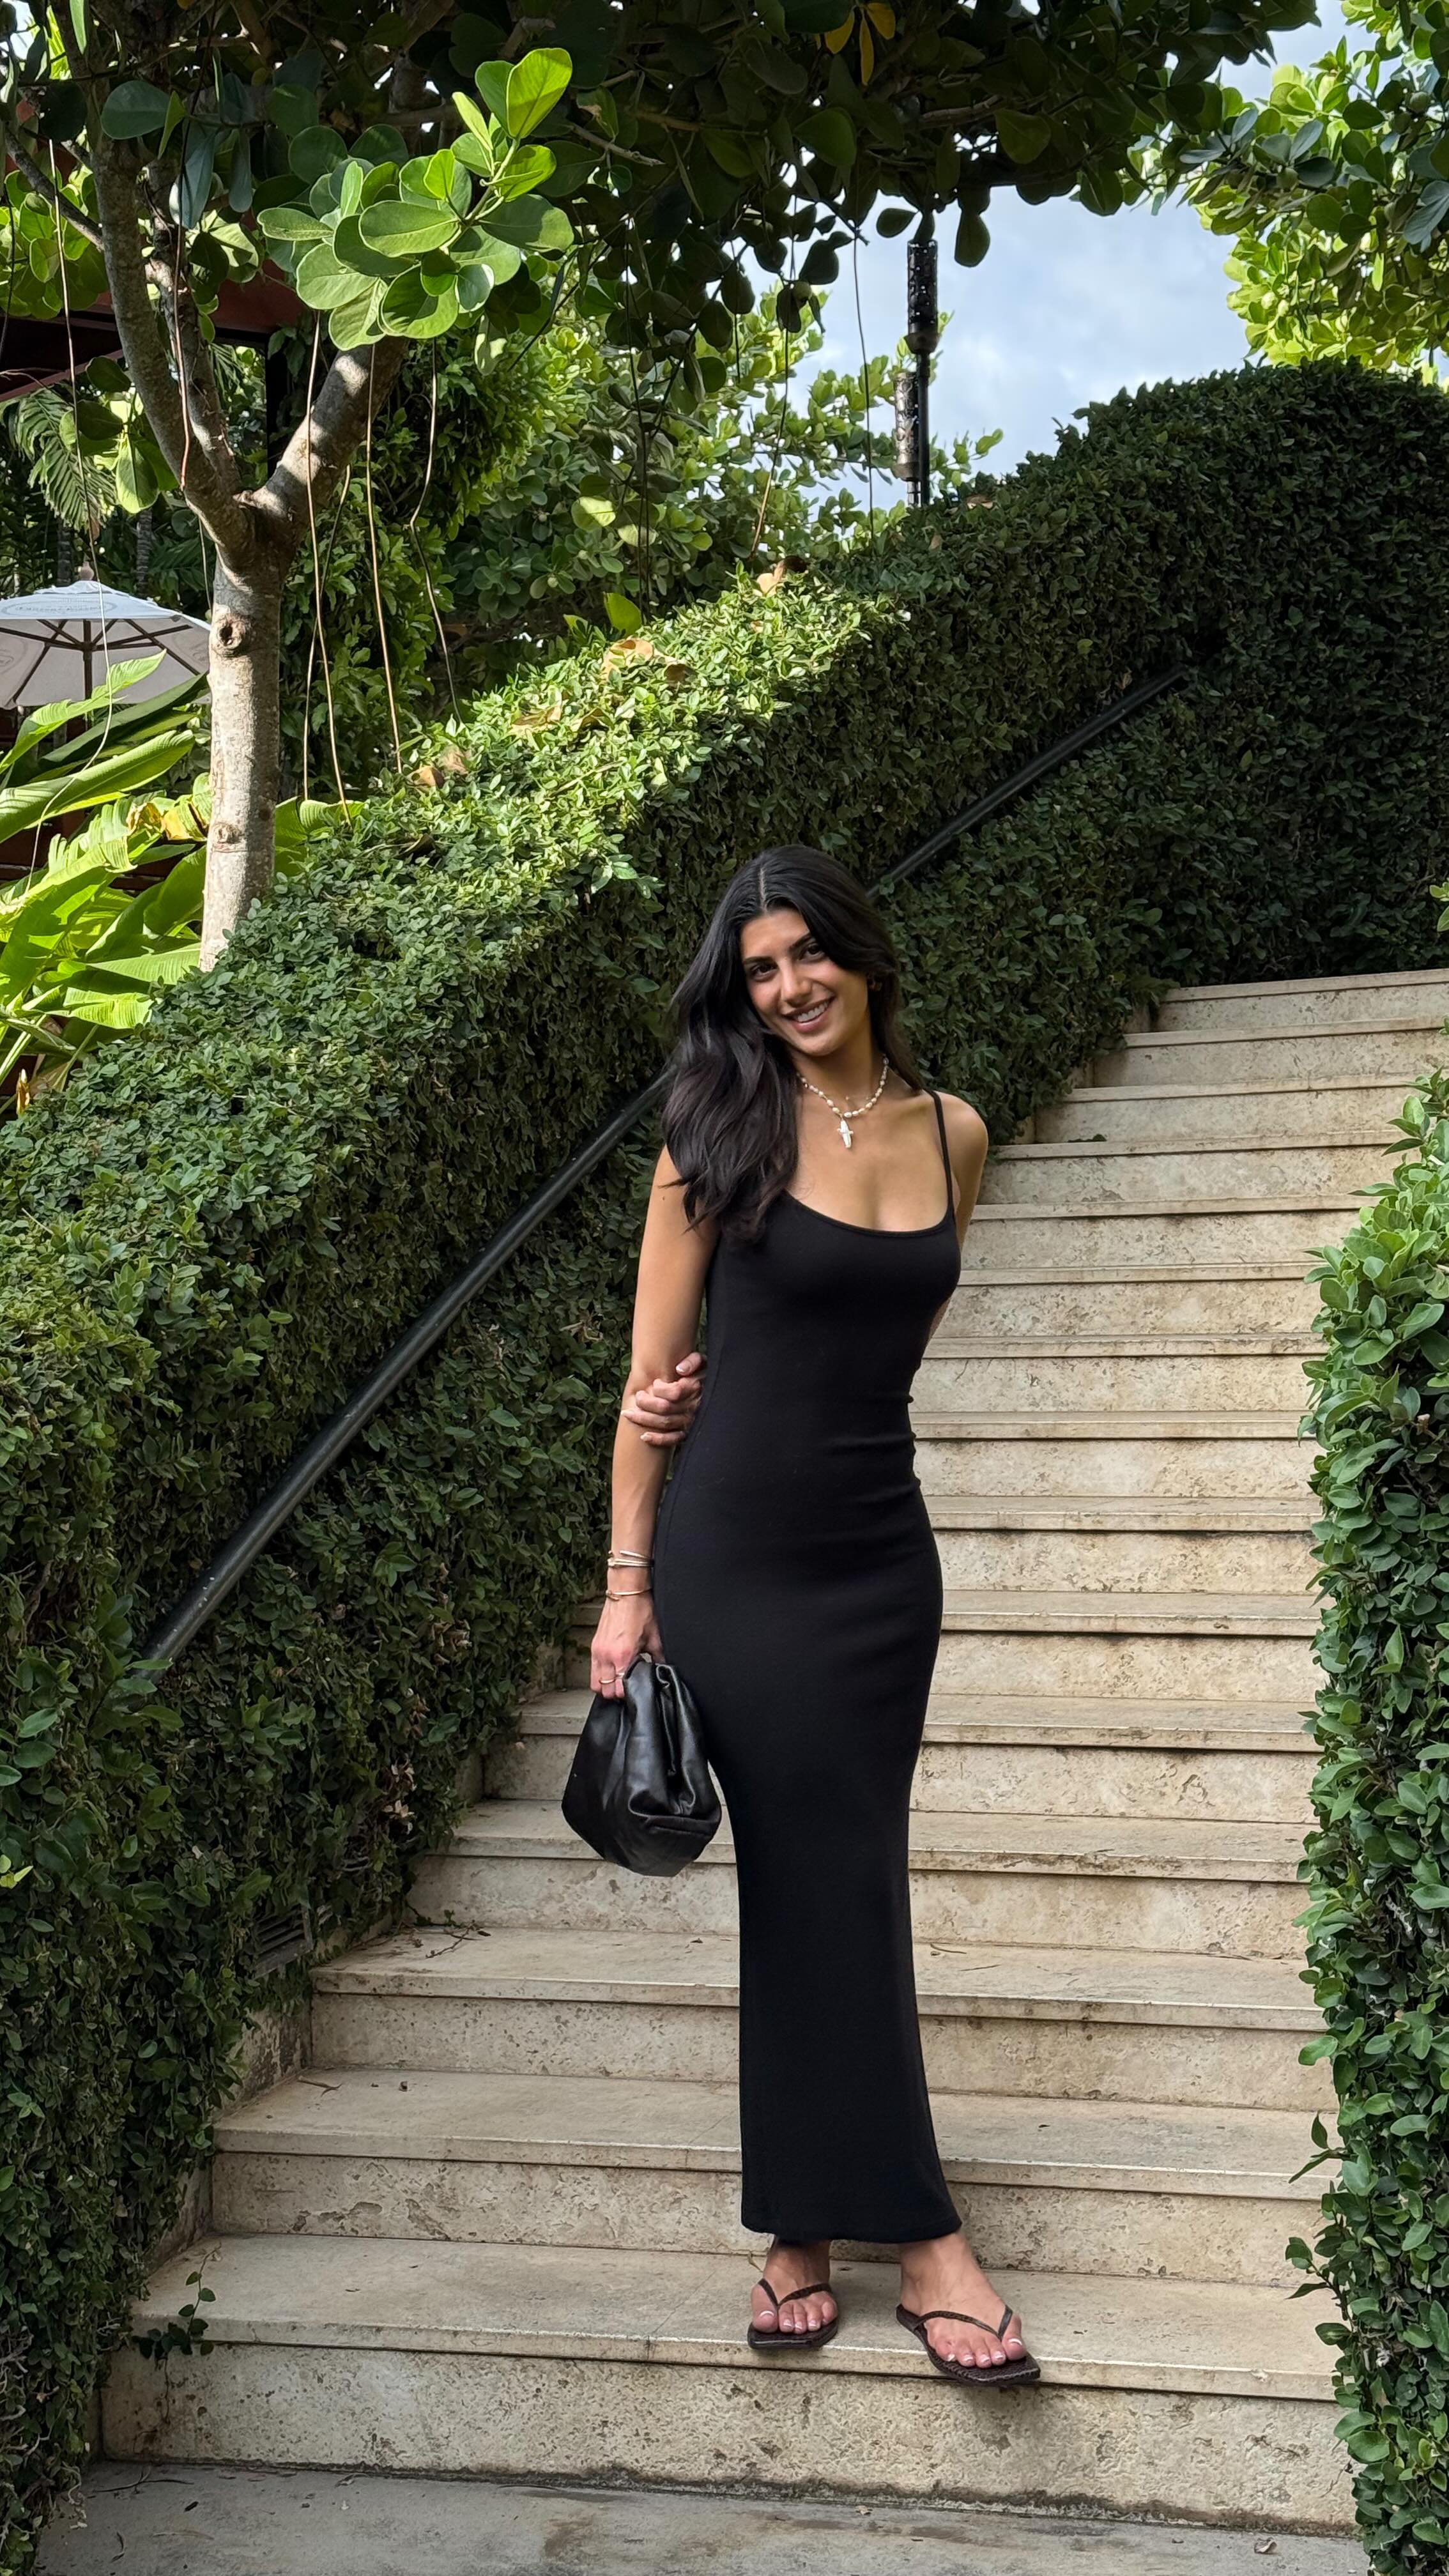
Here is another example of Briogeo collaborating with an influencer in United States.
maciesnell x Briogeo
Briogeo's influencer activity vs. related brands
Briogeo competes with OLAPLEX and K18 in hair repair and treatment-led routines where performance claims matter. These brands target the same beauty audience through creator education, transformation results, and regimen comparisons.
Total influencer content
Briogeo vs. related brands influencer activity
Total sponsored posts tracked (last 12 months)
OLAPLEX leads with 12.4k sponsored posts, marginally ahead of K18 Hair (12.4k posts) and Briogeo (1.9k posts). Across all three brands, the average volume is 8.9k posts, indicating mature, scaled influencer programs. OLAPLEX and K18 Hair each have several times more total posts than Briogeo.
By social platform
Briogeo vs. related brands influencer activity (by social platform)
Sponsored posts by platform
Among these brands, K18 Hair leads on Instagram and OLAPLEX leads on TikTok and YouTube. The gap is most notable on Instagram, with K18 Hair at 6.2k, OLAPLEX at 4.5k, Briogeo at 696 posts. On Instagram and TikTok, OLAPLEX and K18 Hair each have several times more posts than Briogeo, and on YouTube OLAPLEX has many more posts than Briogeo while K18 Hair has none.
By geographical market
Briogeo vs. related brands influencer activity (by country)
Estimated sponsored posts in Briogeo's top markets
K18 Hair has the highest estimated sponsored-post volume in United States (6.9k posts, 55.9%), United Kingdom (1.2k posts, 9.8%), while OLAPLEX leads in India with 583 posts (4.7%), while Briogeo leads in Brazil with 146 posts (7.9%). Looking at United States specifically, the split is K18 Hair at 6.9k posts (55.9%), OLAPLEX at 5.9k posts (47.7%), Briogeo at 1.2k posts (64.2%).
Read more influencer strategy breakdowns
Looking for more like this? Here are 5 similar influencer marketing strategy breakdowns for other brands:
- OLAPLEX's Influencer Marketing Strategy
- K18 Hair's Influencer Marketing Strategy
- Triquetra Health's Influencer Marketing Strategy
- WHOOP's Influencer Marketing Strategy
- TokyoTreat's Influencer Marketing Strategy
Or, if you want to access data like this for your own software or processes, take a look at Modash's API products:
Frequently asked questions
Scaling your influencer program?
When you outgrow your mishmash of spreadsheets & free tools, try Modash. Find & email influencers, track campaigns, ship products & more - all in one place.