DISSH Influencer Marketing Strategy
(2026 Data & Insights)
We analyzed 4.0k pieces of influencer content sponsored by DISSH over the last 12 months.
This report breaks down where & how DISSH invests in influencer marketing, which social platforms they prioritize, top geographical markets, and more.
The data in this report comes from Modash's Brand Collaborations API.
P.S. for a simple list of influencers who have collaborated with DISSH, see here: DISSH influencers.
Influencer activity throughout the year
DISSH's influencer campaigns are active year-round with notable month-to-month fluctuation. The chart below shows month-by-month data for total sponsored posts tracked.
DISSH's influencer activity by month
Number of sponsored posts
DISSH's influencer output appears relatively consistent throughout the year, averaging about 337 sponsored posts per month. August recorded the highest volume at 439 posts (30% above average), while June was the quietest at 181 posts.
Social platforms breakdown
In our dataset (which only includes Instagram, YouTube, and TikTok), this is how the volume of DISSH's sponsored influencer collaborations break down by social platform:
- Instagram: 2.6k posts (64.1%)
- TikTok: 1.4k posts (35%)
- YouTube: 37 posts (0.9%)
DISSH's influencer activity by platform
Share of sponsored content by social network
Instagram influencer marketing is a clear focus for DISSH.
Here are 3 examples of DISSH's recent sponsored collaborations (one each for Instagram, TikTok, YouTube).
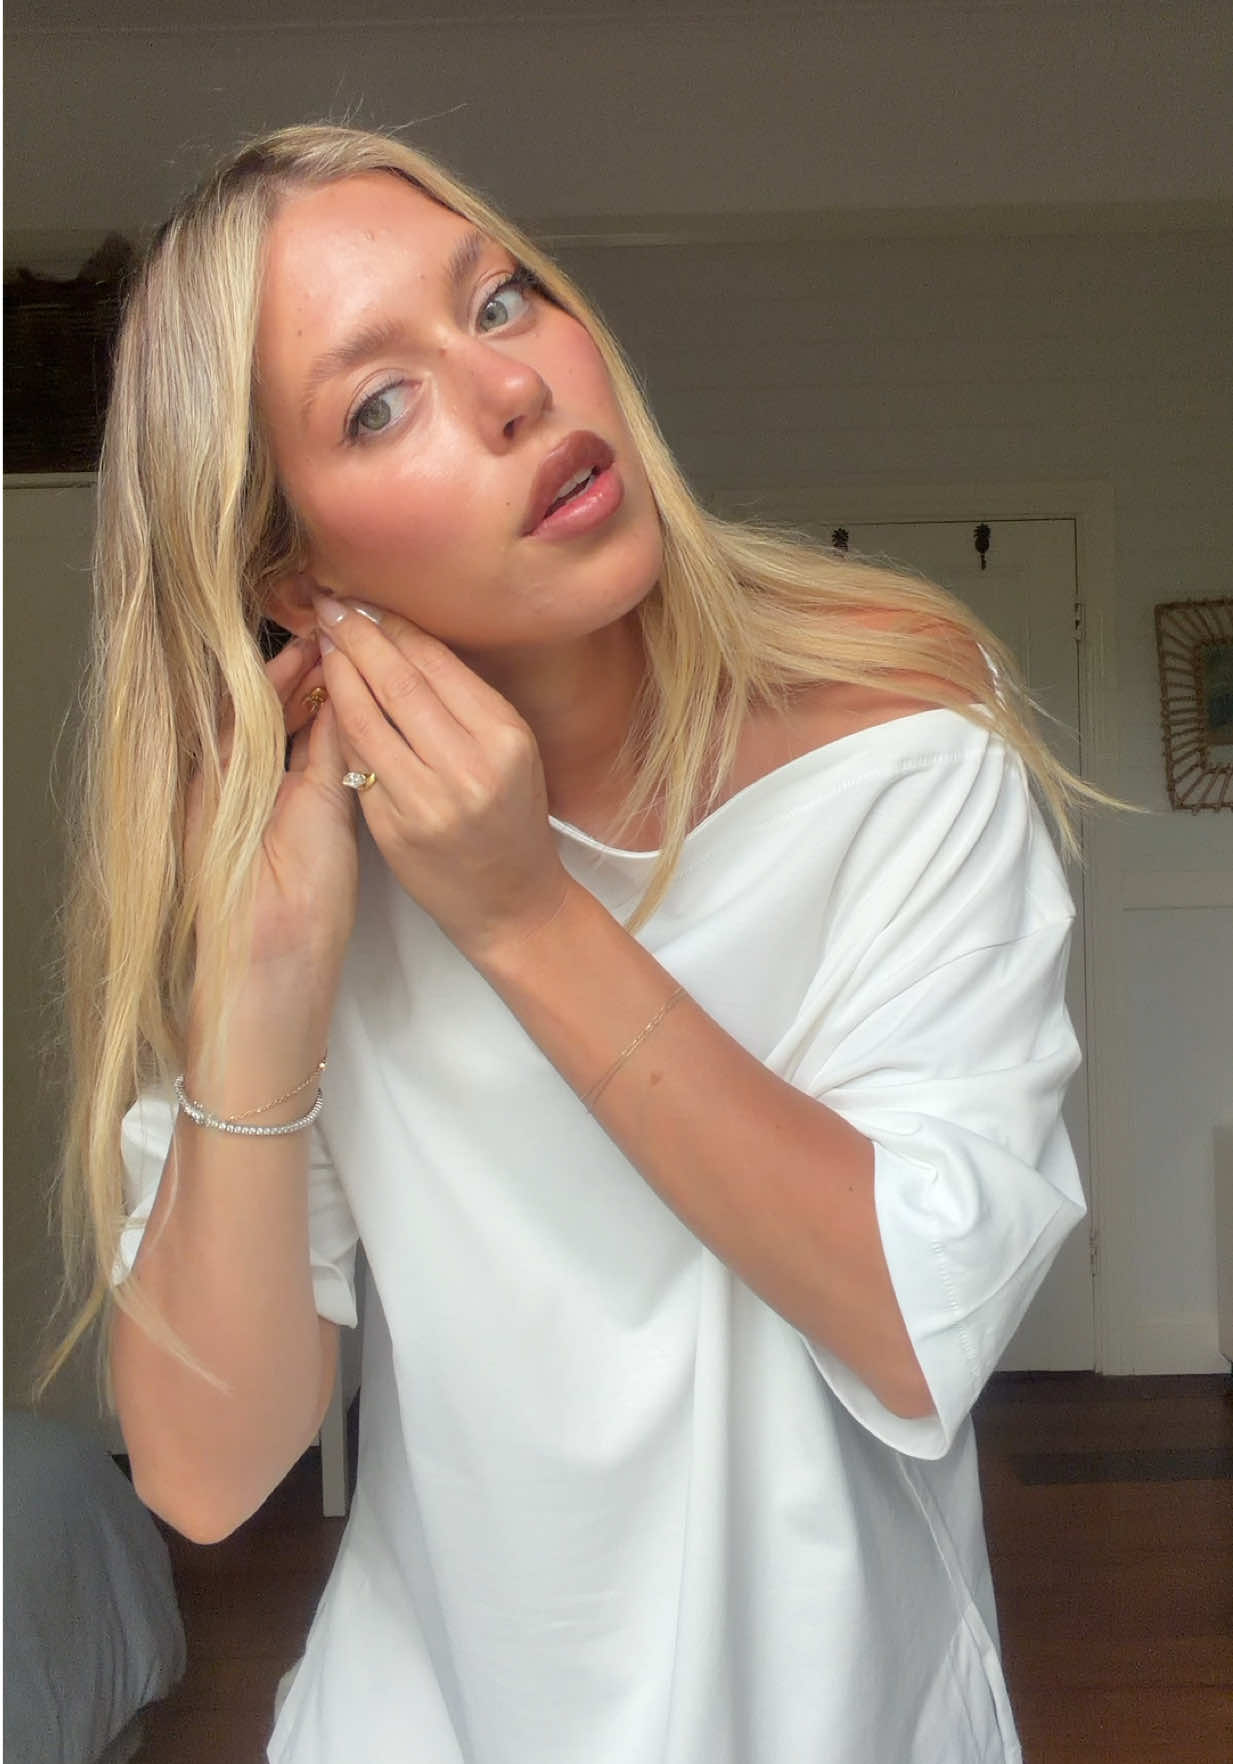
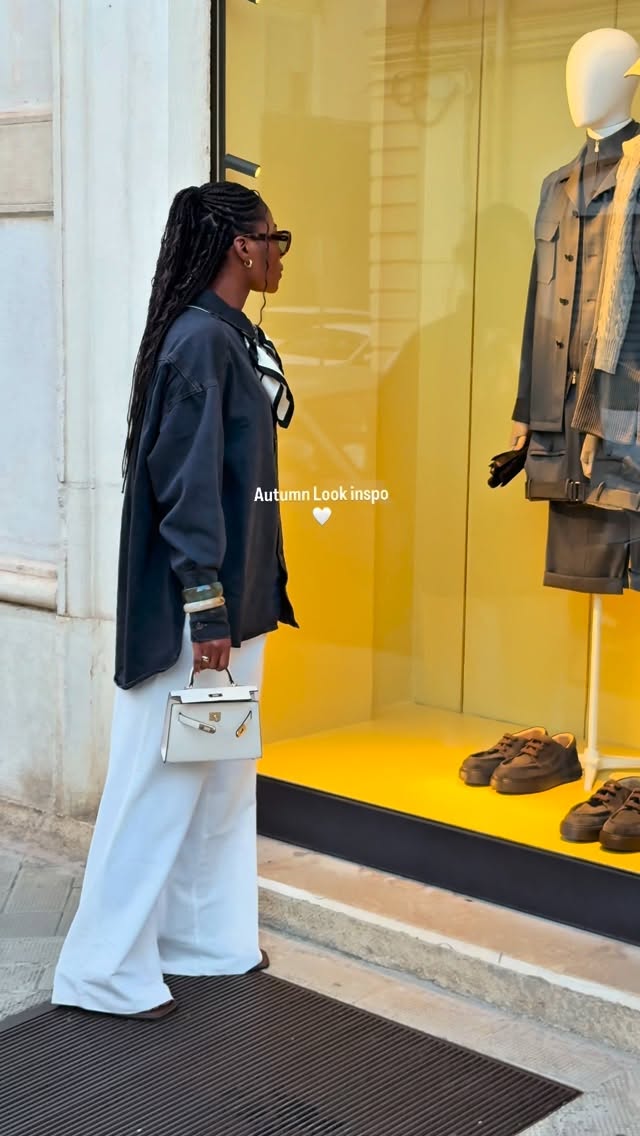
lydiafriberg x DISSH
![Instagram post by @lydiafriberg for DISSH. Caption reads: @dissh dressing me like the type of girl who [...].](https://images.od.modash.io/a5dd7b2b9edfe7d9b2cf966e0bd454029564d9ce)
Influencer bio
📍LA🧿 🪬 Lydiafriberg.socials@gmail.com
Collaboration metrics
Get a free trial to find more data on influencer audiences, performance, and collaborations.
georgiahayes____ x DISSH
Influencer bio
Melbourne | Australia Management | georgia@flaremp.com 💕❤️🔥✨🍒🩵🔥🪩
Collaboration metrics
Get a free trial to find more data on influencer audiences, performance, and collaborations.
JosieIrons x DISSH
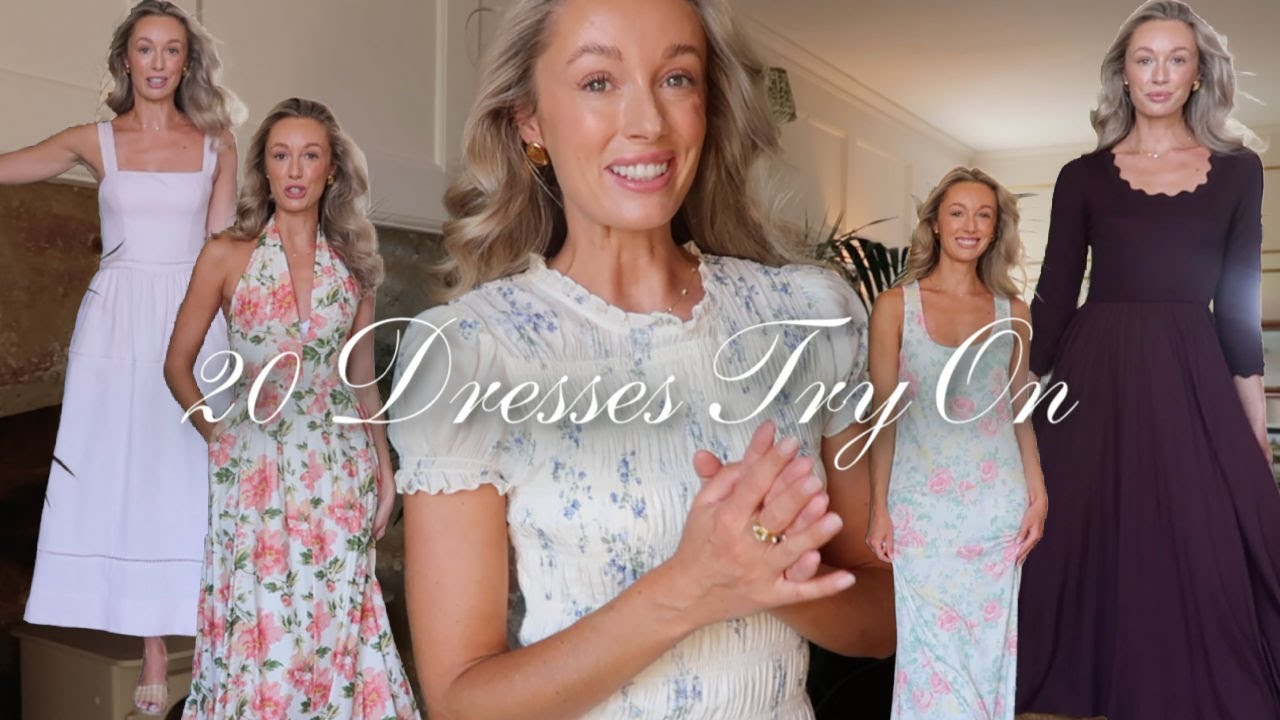
Influencer bio
Hi I'm Josie! Subscribe for daily vlogs of our life in the Cotswolds Cotswolds based Beauty, Fashion & Lifestyle blogger. - - - PR & General Enquiries - - - If you'd like to work with me or just fancy saying hello, then drop me an email to Josie@theperennial.com.
Collaboration metrics
Get a free trial to find more data on influencer audiences, performance, and collaborations.
If you break this down further by content type on Instagram, this is what it looks like:
- Reels: 50.6%
- Posts: 49.4%
💡 Related resource: How To Find Instagram Influencers.
Influencer audience size breakdown (by views)
For their top social platform (Instagram), here is a breakdown of the type of influencers DISSH are collaborating with, by audience size.
Note: this breakdown is based on each influencer's average views (not follower/subscriber count), because views typically correlate more closely with influencer pricing and impact.
DISSH's influencers average views (Instagram)
Based on each influencer's average views per post
DISSH's creator selection appears relatively diversified across size tiers, with no single segment dominating. This suggests a balanced approach to influencer partnerships, spreading investment across different audience sizes.
Here is an example of a sponsored collaboration with a larger-audience creator on Instagram (160.5k avg views/post):
dcopperman x DISSH
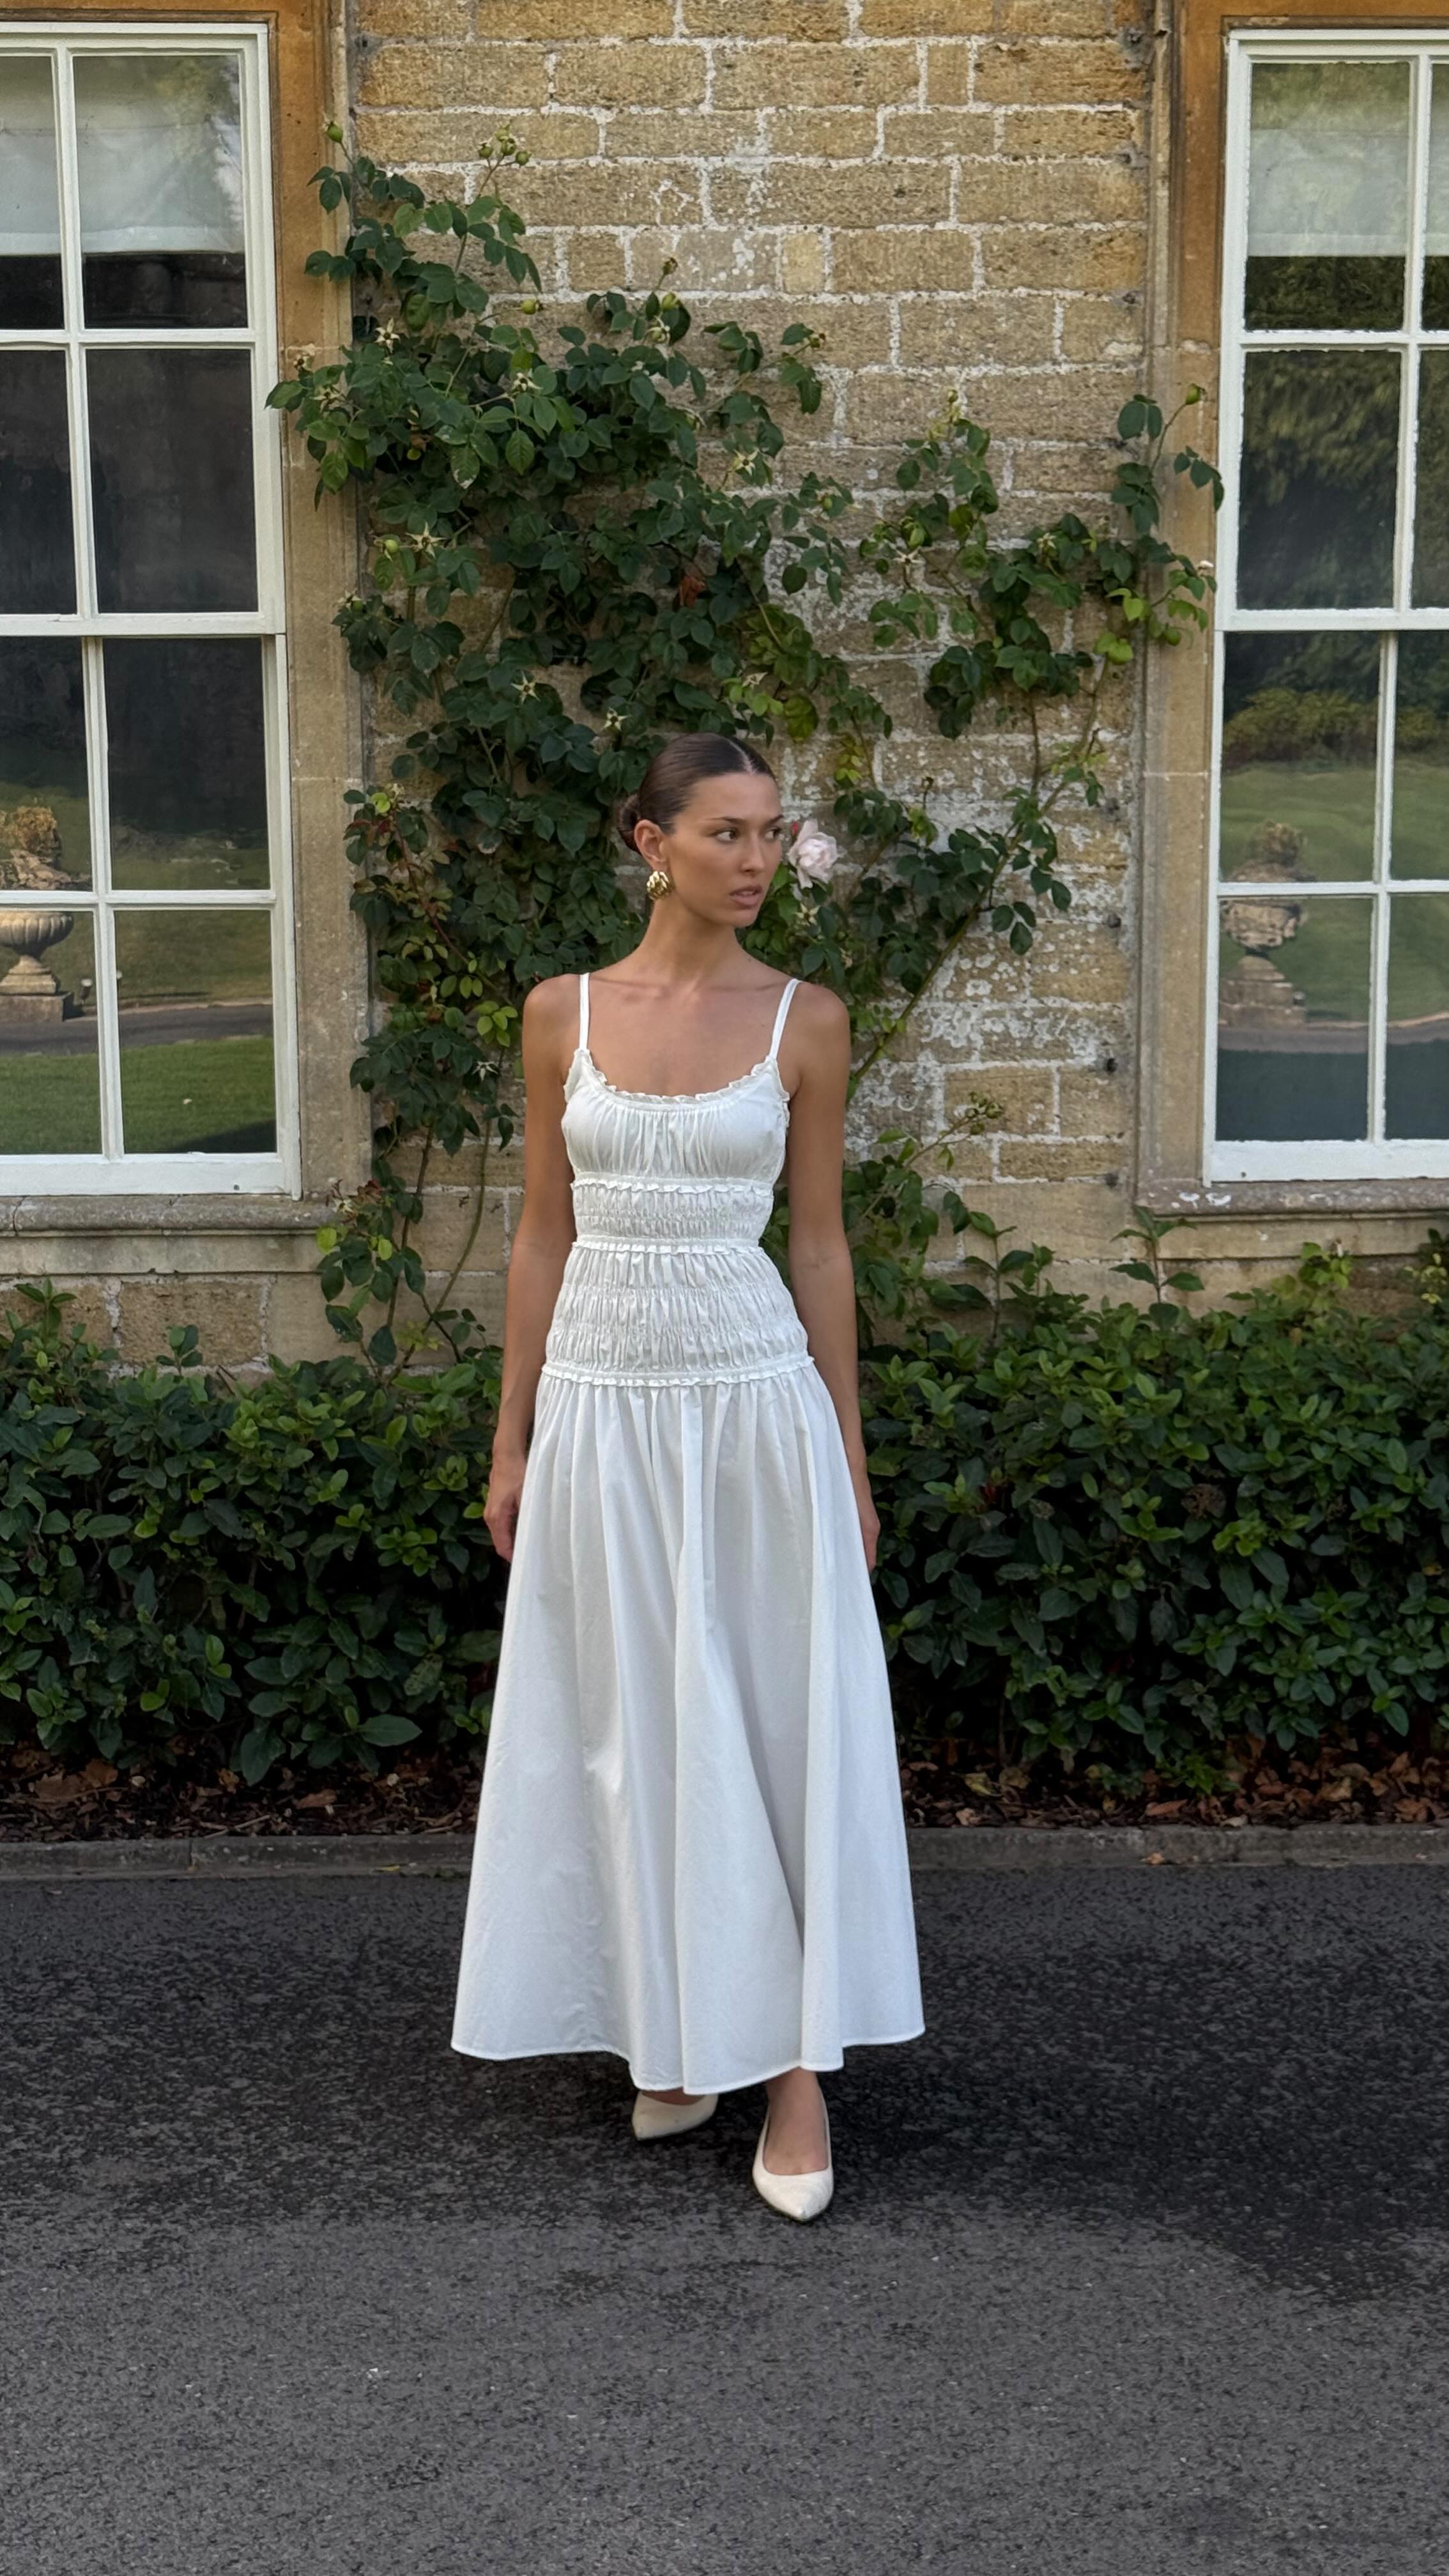
Influencer bio
Curated occasionwear & bridal style 💫 Model | Creative Director • @dirt.charity
Collaboration metrics
Get a free trial to find more data on influencer audiences, performance, and collaborations.
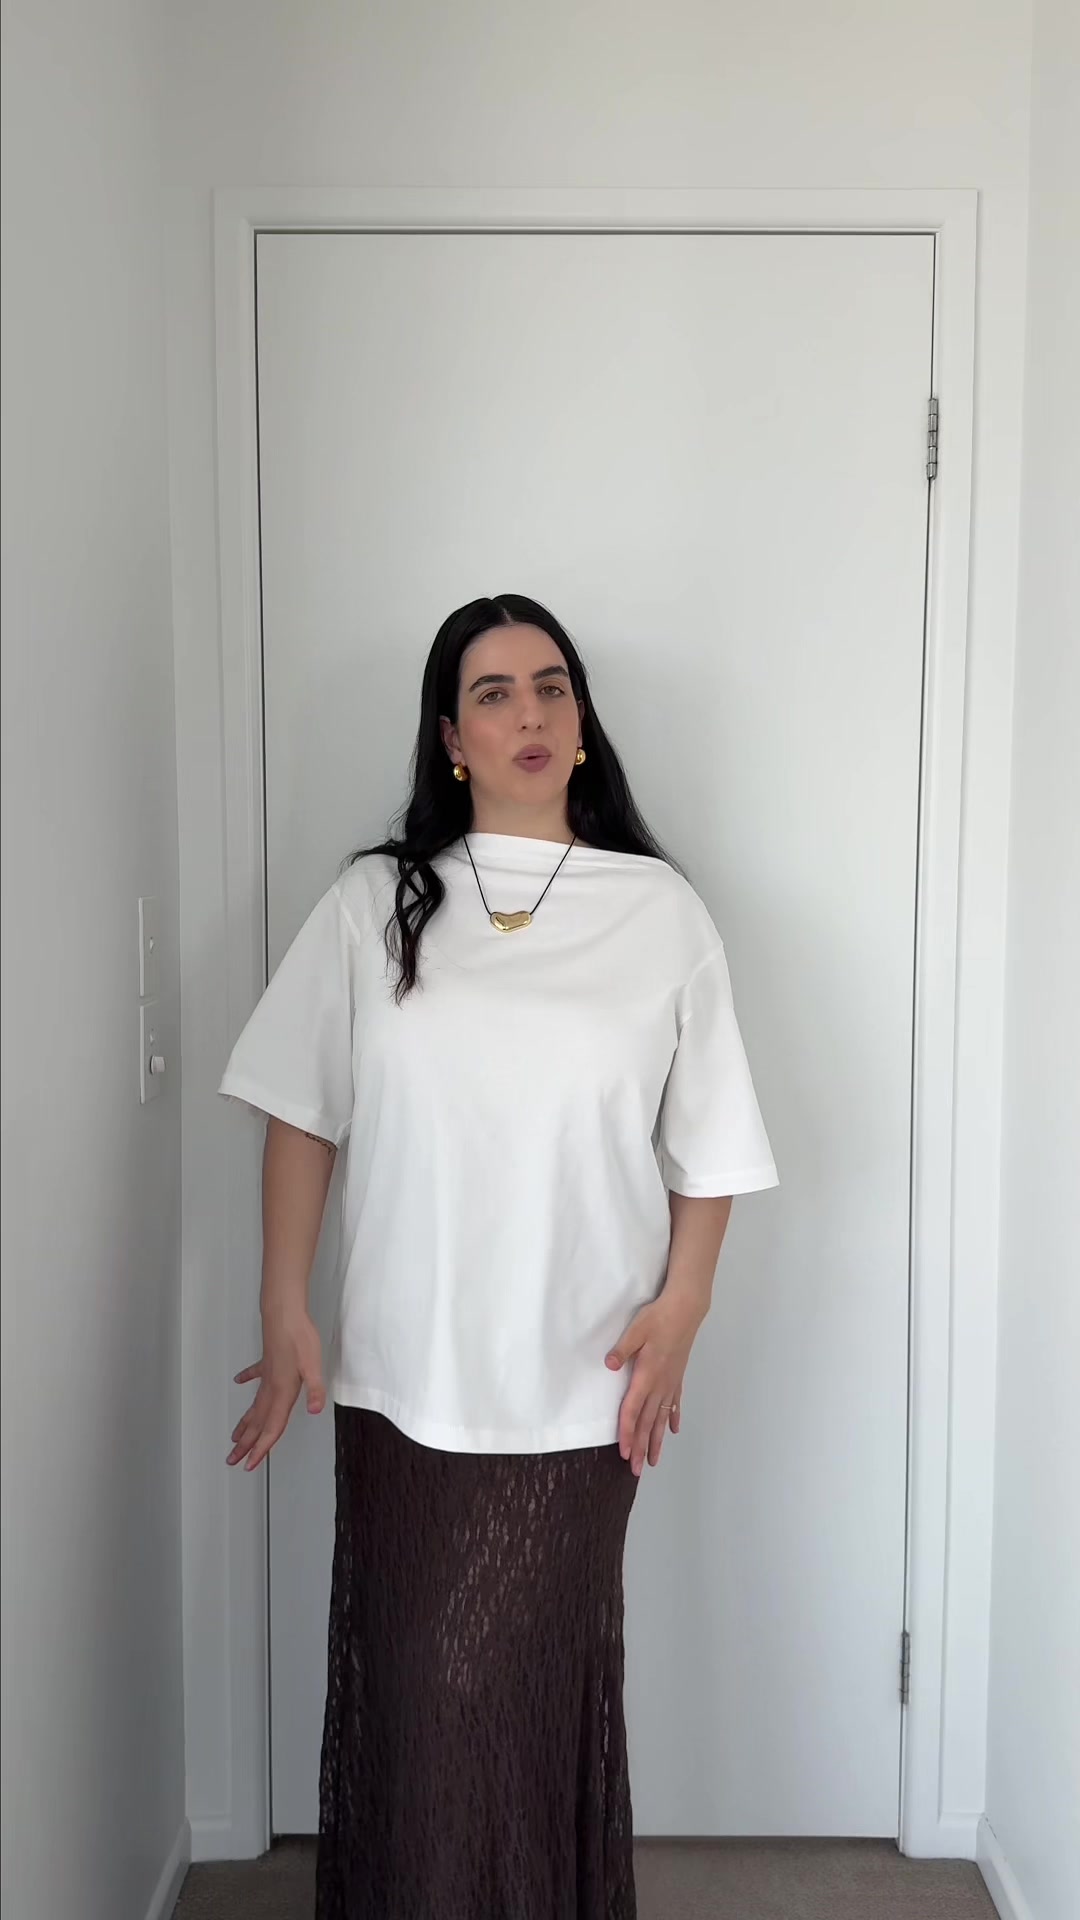
And here is another example with a smaller creator on Instagram (9.0k avg views/post):
chloepaap x DISSH

Influencer bio
🐆God is a woman 📍Now in Sydney @everi_body bookings : aleesha@everi-body.com socials : demi@everi-body.com
Collaboration metrics
Get a free trial to find more data on influencer audiences, performance, and collaborations.
DISSH's repeat partnerships
Out of 2k unique influencers in our dataset, 63 of them (3%) posted content for DISSH in 3 or more separate calendar months. The most consistent partner is @what.gem.wore, who has collaborated across 11 months with 41 total posts.
Here are 3 examples of DISSH's repeat influencer partnerships, with links to the sponsored content.
what.gem.wore x DISSH
![TikTok post by @what.gem.wore for DISSH. Caption reads: [...] dress untill further notice @DISSH x....](https://images.od.modash.io/e2ab56fd70581bcaa838cd4fe2a6b6a0e7fccaef)
![TikTok post by @what.gem.wore for DISSH. Caption reads: [...] be like free aircon at all @DISSH times....](https://images.od.modash.io/c48cc2af68243bdda4c38574dc9547d3139ce22c)
sim.spys.stylist x DISSH
![Instagram post by @sim.spys.stylist for DISSH. Caption reads: [...] chic. Just the way we like it. @dissh....](https://images.od.modash.io/8d8d7a3a12e284cc82483d30e7ed36457d6ae6b5)
![Instagram post by @sim.spys.stylist for DISSH. Caption reads: When @dissh nails the silk set. Can't wait [...].](https://images.od.modash.io/66a499b5266113163596ebf12dabd0d309980dc6)
![Instagram post by @sim.spys.stylist for DISSH. Caption reads: [...] the shorts Sim x #blackfriday #dissh....](https://images.od.modash.io/3d1e81373cb169e504f359ca0cd135654c7d7c4b)
yacinelusaku x DISSH
💡 Related resource: Long-Term Influencer Partnerships: Pros, Cons & How The Pros Manage Them.
Geographical breakdown
In our dataset, United States is where DISSH had the most influencer activity. 34% of their live influencer content in the last 12 months was posted by American influencers.
Based on the percentage of influencer content per market, other important markets include:
- Australia (21.7%)
- United Kingdom (11%)
- Brazil (3.9%)
DISSH's influencer activity by market
Here is another example of DISSH collaborating with an influencer in United States.
cailinmandapat x DISSH
DISSH's influencer activity vs. related brands
DISSH targets fashion-conscious shoppers looking for elevated women’s apparel and outfit styling inspiration. Meshki and OH POLLY compete for similar occasionwear and trend-led wardrobes, making them strong benchmarks for creator try-on and styling campaigns.
Total influencer content
DISSH vs. related brands influencer activity
Total sponsored posts tracked (last 12 months)
Meshki leads with 11.8k sponsored posts, notably outpacing OH POLLY (10.2k posts) and DISSH (4k posts). Across all three brands, the average volume is 8.7k posts, indicating mature, scaled influencer programs. Meshki and OH POLLY have more than double DISSH’s total post count.
By social platform
DISSH vs. related brands influencer activity (by social platform)
Sponsored posts by platform
Among these brands, Meshki leads on Instagram and OH POLLY leads on TikTok and YouTube. The gap is most notable on Instagram, with Meshki at 7.8k, OH POLLY at 6k, DISSH at 2.6k posts. On Instagram and TikTok, Meshki and OH POLLY each have multiple times more posts than DISSH.
By geographical market
DISSH vs. related brands influencer activity (by country)
Estimated sponsored posts in DISSH's top markets
Meshki has the highest estimated sponsored-post volume in United States (5.2k posts, 44.1%), Australia (1k posts, 8.5%), while OH POLLY has the highest estimated sponsored-post volume in United Kingdom (2.1k posts, 20.7%), Brazil (406 posts, 4%). Looking at United States specifically, the split is Meshki at 5.2k posts (44.1%), OH POLLY at 4.2k posts (41.3%), DISSH at 1.4k posts (34%).
Read more influencer strategy breakdowns
Looking for more like this? Here are 5 similar influencer marketing strategy breakdowns for other brands:
- Meshki's Influencer Marketing Strategy
- OH POLLY's Influencer Marketing Strategy
- Teveo's Influencer Marketing Strategy
- Kate Somerville's Influencer Marketing Strategy
- FHI Heat's Influencer Marketing Strategy
Or, if you want to access data like this for your own software or processes, take a look at Modash's API products:
Frequently asked questions
Scaling your influencer program?
When you outgrow your mishmash of spreadsheets & free tools, try Modash. Find & email influencers, track campaigns, ship products & more - all in one place.