Rhode Skin Influencer Marketing Strategy
(2026 Data & Insights)
We analyzed 37.6k pieces of influencer content sponsored by Rhode Skin over the last 12 months.
This report breaks down where & how Rhode Skin invests in influencer marketing, which social platforms they prioritize, top geographical markets, and more.
The data in this report comes from Modash's Brand Collaborations API.
P.S. for a simple list of influencers who have collaborated with Rhode Skin, see here: Rhode Skin influencers.
Influencer activity throughout the year
Rhode Skin's influencer campaigns are active year-round with notable month-to-month fluctuation. The chart below shows month-by-month data for total sponsored posts tracked.
Rhode Skin's influencer activity by month
Number of sponsored posts
Rhode Skin's influencer output appears relatively consistent throughout the year, averaging about 3.1k sponsored posts per month. April recorded the highest volume at 4.8k posts (55% above average), while October was the quietest at 2k posts.
Social platforms breakdown
In our dataset (which only includes Instagram, YouTube, and TikTok), this is how the volume of Rhode Skin's sponsored influencer collaborations break down by social platform:
- TikTok: 21.2k posts (56.4%)
- Instagram: 16.1k posts (42.8%)
- YouTube: 291 posts (0.8%)
Rhode Skin's influencer activity by platform
Share of sponsored content by social network
TikTok influencer marketing is a clear focus for Rhode Skin.
Here are 3 examples of Rhode Skin's recent sponsored collaborations (one each for Instagram, TikTok, YouTube).
lenkalul x Rhode Skin
Influencer bio
• Tik Tok: lenkalul (4M+) • UK 🇬🇧 • Business & PR - info@lenkalul.com • Managed by @thebloggeragent
Collaboration metrics
Get a free trial to find more data on influencer audiences, performance, and collaborations.
connerchanttt x Rhode Skin
Influencer bio
Just makin random vids📹 Email: chant.conner@gmail.com
Collaboration metrics
Get a free trial to find more data on influencer audiences, performance, and collaborations.
SHEMDPodcast x Rhode Skin
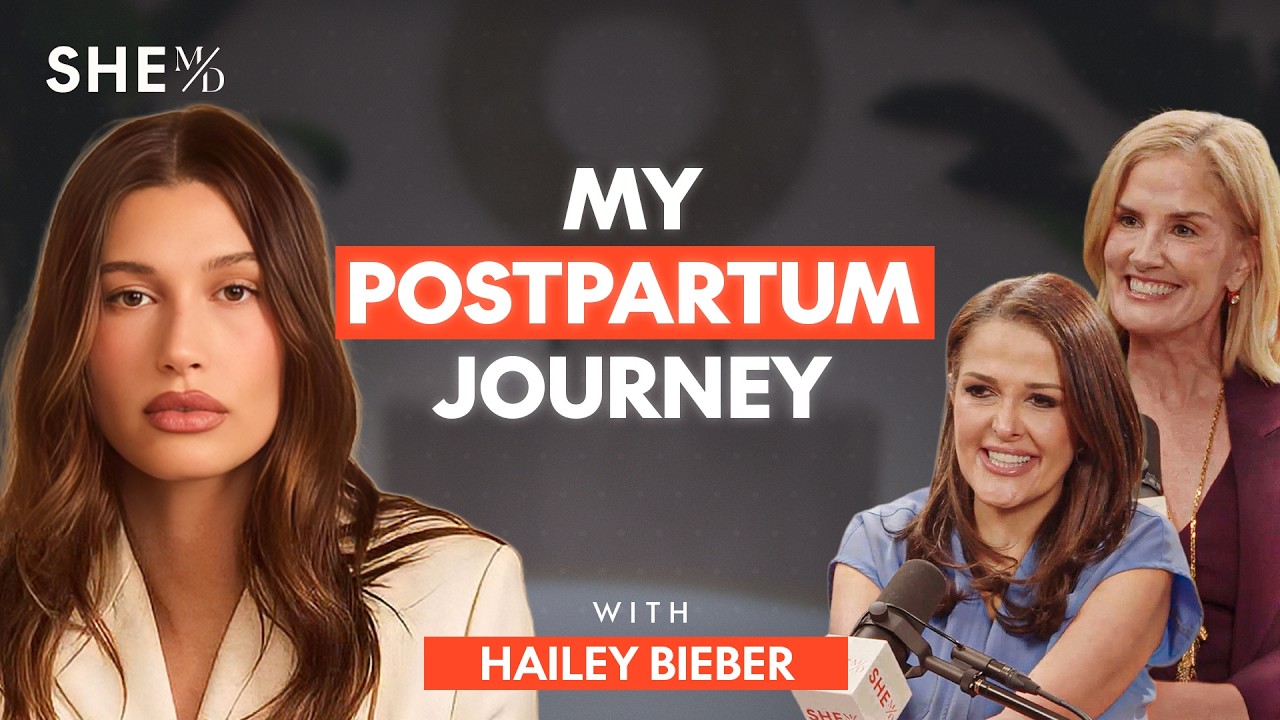
Influencer bio
SHE MD is a weekly podcast hosted by world-renowned OBGYN, Dr. Thais Aliabadi, “Dr. A,” & women's advocate and influencer, Mary Alice Haney. Their candid conversations with celebrity guests & today's leading experts about women's health topics, such as menopause, endometriosis, PCOS, & fertility empower their audience with the knowledge & tools to become their own health advocates. Dr. A & Mary Alice dive deep into critical health issues, offering women the knowledge and tools to become their best health advocates. We believe that every woman deserves access to the latest medical insights, personalized care strategies, & expert advice to navigate their health journey. From breaking down myths to providing practical tips, Dr. Aliabadi & Mary Alice Haney create a welcoming and informative space for women to take control of their health. The podcast features exclusive interviews with top-tier celebrity guests and leading experts across the medical, wellness, & health industries.
Collaboration metrics
Get a free trial to find more data on influencer audiences, performance, and collaborations.
If you break this down further by content type on TikTok, this is what it looks like:
- Videos: 94.4%
- Carousels: 5.6%
💡 Related resource: How To Find TikTok Influencers.
Influencer audience size breakdown (by views)
For their top social platform (TikTok), here is a breakdown of the type of influencers Rhode Skin are collaborating with, by audience size.
Note: this breakdown is based on each influencer's average views (not follower/subscriber count), because views typically correlate more closely with influencer pricing and impact.
Rhode Skin's influencers average views (TikTok)
Based on each influencer's average views per post
With 38.3% of partnerships featuring creators averaging 1K-5K views, Rhode Skin's strategy suggests niche targeting and authenticity, likely leveraging collaboration models like gifting and affiliates to work with smaller creators.
Here is an example of a sponsored collaboration with a larger-audience creator on TikTok (1.6M avg views/post):
kayla.ryann x Rhode Skin
![TikTok post by @kayla.ryann for Rhode Skin. Caption reads: [...] @Tower 28 Beauty @Colorescience @rhode skin....](https://images.od.modash.io/3affe81f2aef510c058999dcb9ada472a7882420)
Influencer bio
HIII WELCOME 💆🏼♀️✨🍓🫧🌸 kaylaryan@thesociablesociety.com
Collaboration metrics
Get a free trial to find more data on influencer audiences, performance, and collaborations.
And here is another example with a smaller creator on TikTok (10.0k avg views/post):
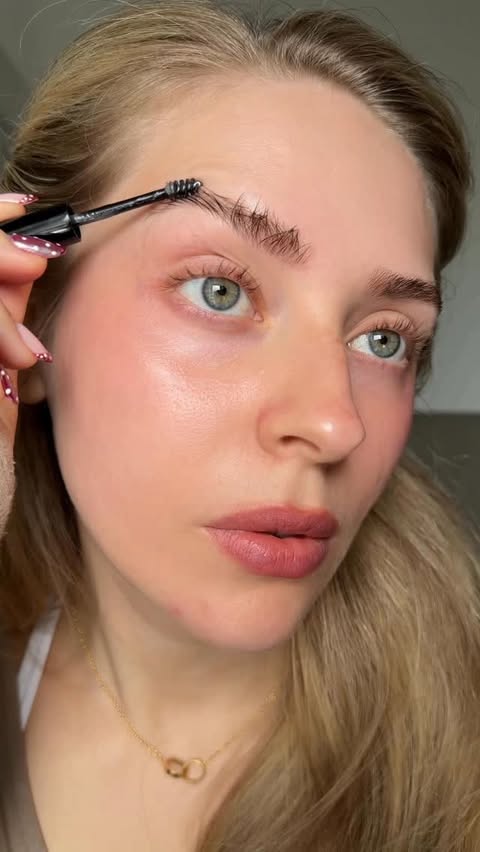
itslaurensnyder x Rhode Skin
![TikTok post by @itslaurensnyder for Rhode Skin. Caption reads: [...] #productsyouneed #makeup #skincare @rhode....](https://images.od.modash.io/16c04c12d8813cd5a53364f5dca59a955912a310)
Influencer bio
atx vlogs, fitness, hauls & routines! im cooler on youtube✨ ALL MY LINKS! ⭣
Collaboration metrics
Get a free trial to find more data on influencer audiences, performance, and collaborations.
Rhode Skin's repeat partnerships
Out of 18.7k unique influencers in our dataset, 468 of them (3%) posted content for Rhode Skin in 3 or more separate calendar months. The most consistent partner is @that.girl.rhode, who has collaborated across 12 months with 227 total posts.
Here are 3 examples of Rhode Skin's repeat influencer partnerships, with links to the sponsored content.
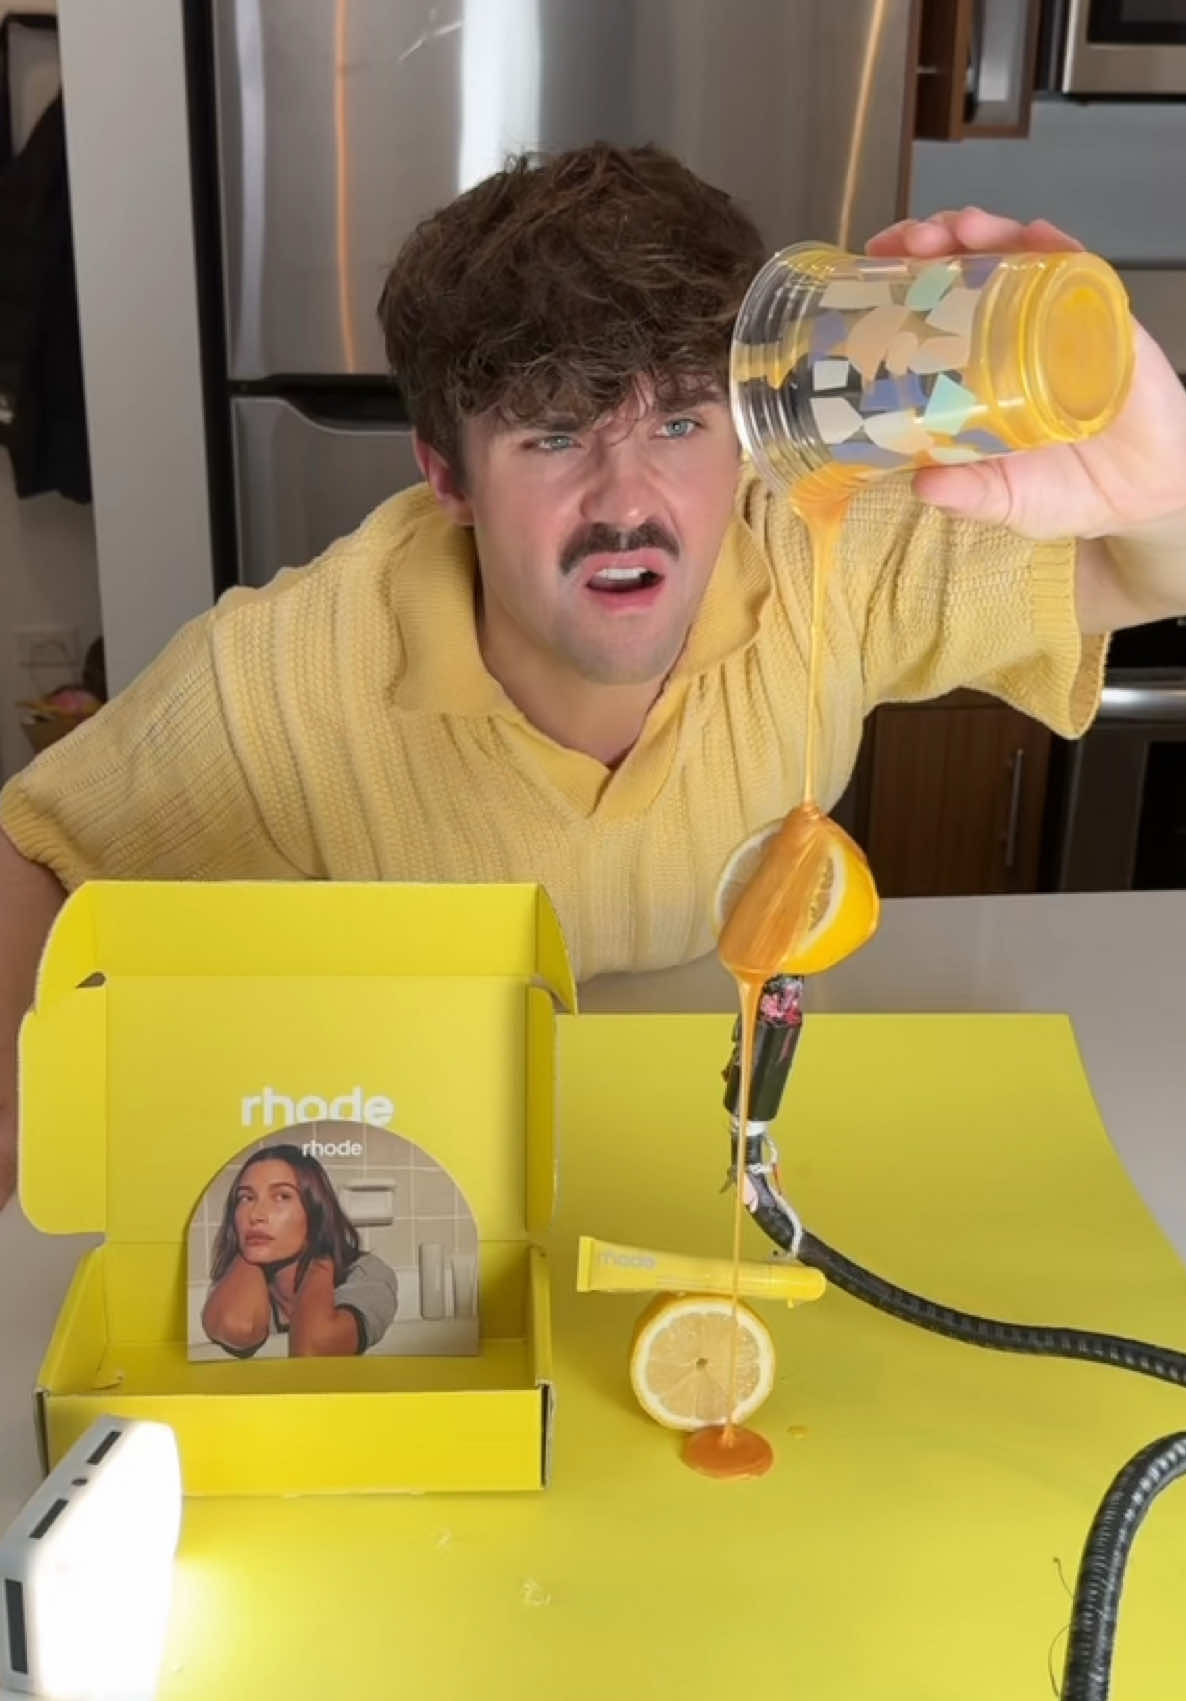
carrieanne_ x Rhode Skin
![Instagram post by @carrieanne_ for Rhode Skin. Caption reads: [...] 🤎🥥🍦 PR/gifted - #rhode #rhodeskin....](https://images.od.modash.io/07ed0e0a97c395e5d3f272c03f55af476c595424)
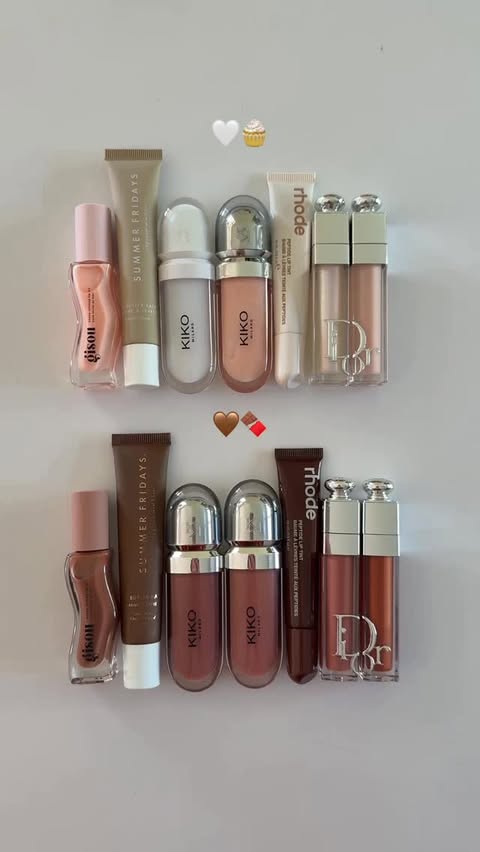
moodpourtoi x Rhode Skin
![Instagram post by @moodpourtoi for Rhode Skin. Caption reads: [...] beauty, viral makeup #rhode #rhodeskin....](https://images.od.modash.io/883f34c505493bb27be96280a97a9332d54cc982)
![Instagram post by @moodpourtoi for Rhode Skin. Caption reads: [...] Justin Bieber #rhode #rhodeskin....](https://images.od.modash.io/9b8fe1a64c4deb58b13ed8648976c5520b6a4a79)
![Instagram post by @moodpourtoi for Rhode Skin. Caption reads: [...] beauty, viral makeup #rhode #rhodeskin....](https://images.od.modash.io/ecc6303414c54ce775e442bf3cc64fd7e7e2ffd8)
222katerina x Rhode Skin
![TikTok post by @222katerina for Rhode Skin. Caption reads: [...] I needed and more tbh 🪽 @rhode skin rhode....](https://images.od.modash.io/1f70a9188fa012c027c3cf0eabfed8544b14e2de)
![TikTok post by @222katerina for Rhode Skin. Caption reads: new @rhode skin loading… 🪽🍦✨🤍🧴 been [...].](https://images.od.modash.io/5a7b3902943853ccaad9291d92c33bb0ca3dc762)
![TikTok post by @222katerina for Rhode Skin. Caption reads: [...] perfect everyday shade 🧸 @rhode skin rhode....](https://images.od.modash.io/07ada08ddb89ddf80a6883ca51afc898af14eed1)
💡 Related resource: Long-Term Influencer Partnerships: Pros, Cons & How The Pros Manage Them.
Geographical breakdown
In our dataset, United States is where Rhode Skin had the most influencer activity. 36.8% of their live influencer content in the last 12 months was posted by American influencers.
Based on the percentage of influencer content per market, other important markets include:
- United Kingdom (7.6%)
- Brazil (5.8%)
- Italy (5.6%)
Rhode Skin's influencer activity by market
Here is another example of Rhode Skin collaborating with an influencer in United States.
carlyrivlin x Rhode Skin
![TikTok post by @carlyrivlin for Rhode Skin. Caption reads: [...] cream @Kylie Cosmetics skin tint @rhode skin....](https://images.od.modash.io/09df6c541df8ea458355bfa0aed3626ad0201e9b)
Rhode Skin's influencer activity vs. related brands
Rhode Skin overlaps with Summer Fridays and Glossier in minimalist, aesthetic-led skincare/beauty that’s built for social content and “routine” storytelling. All three compete for the same Gen Z/young millennial audience that discovers products via TikTok and creator reviews.
Total influencer content
Rhode Skin vs. related brands influencer activity
Total sponsored posts tracked (last 12 months)
Rhode Skin leads with 37.6k sponsored posts, significantly outpacing Summer Fridays (15.4k posts) and Glossier (5.1k posts). Across all three brands, the average volume is 19.4k posts, indicating mature, scaled influencer programs. Rhode Skin has more than double the total posts of Summer Fridays and over seven times the total posts of Glossier.
By social platform
Rhode Skin vs. related brands influencer activity (by social platform)
Sponsored posts by platform
Rhode Skin leads on Instagram, TikTok, and YouTube. The gap is most notable on TikTok, with Rhode Skin at 21.2k, Summer Fridays at 9.8k, Glossier at 3.7k posts. Glossier's activity is particularly concentrated on TikTok. On Instagram and YouTube, Rhode Skin has nearly three times the posts of Summer Fridays and far more than Glossier.
By geographical market
Rhode Skin vs. related brands influencer activity (by country)
Estimated sponsored posts in Rhode Skin's top markets
Rhode Skin has the highest estimated sponsored-post volume in United States (14k posts, 36.8%), United Kingdom (2.9k posts, 7.6%), Brazil (2.2k posts, 5.8%), while Summer Fridays leads in France with 988 posts (6.4%), while Glossier leads in Canada with 195 posts (3.8%). Looking at United States specifically, the split is Rhode Skin at 14k posts (36.8%), Summer Fridays at 8.5k posts (55.3%), Glossier at 2.8k posts (54%). Rhode Skin's strength in United States and United Kingdom may indicate a home-market focus, while Glossier shows broader regional investment.
Read more influencer strategy breakdowns
Looking for more like this? Here are 5 similar influencer marketing strategy breakdowns for other brands:
- Summer Fridays's Influencer Marketing Strategy
- Glossier's Influencer Marketing Strategy
- e.l.f. Cosmetics's Influencer Marketing Strategy
- Gisada's Influencer Marketing Strategy
- Jimmy Fairly's Influencer Marketing Strategy
Or, if you want to access data like this for your own software or processes, take a look at Modash's API products:
Frequently asked questions
Scaling your influencer program?
When you outgrow your mishmash of spreadsheets & free tools, try Modash. Find & email influencers, track campaigns, ship products & more - all in one place.