Ulanzi Influencer Marketing Strategy
(2026 Data & Insights)
We analyzed 5.4k pieces of influencer content sponsored by Ulanzi over the last 12 months.
This report breaks down where & how Ulanzi invests in influencer marketing, which social platforms they prioritize, top geographical markets, and more.
The data in this report comes from Modash's Brand Collaborations API.
P.S. for a simple list of influencers who have collaborated with Ulanzi, see here: Ulanzi influencers.
Influencer activity throughout the year
Ulanzi maintains a steady pace of influencer content throughout the year. The chart below shows month-by-month data for total sponsored posts tracked.
Ulanzi's influencer activity by month
Number of sponsored posts
Ulanzi's influencer output appears relatively consistent throughout the year, averaging about 449 sponsored posts per month. April recorded the highest volume at 510 posts (14% above average), while June was the quietest at 393 posts.
Social platforms breakdown
In our dataset (which only includes Instagram, YouTube, and TikTok), this is how the volume of Ulanzi's sponsored influencer collaborations break down by social platform:
- Instagram: 2.6k posts (47.7%)
- TikTok: 2.1k posts (38.3%)
- YouTube: 756 posts (14%)
Ulanzi's influencer activity by platform
Share of sponsored content by social network
Instagram influencer marketing is a clear focus for Ulanzi.
Here are 3 examples of Ulanzi's recent sponsored collaborations (one each for Instagram, TikTok, YouTube).
azchpn x Ulanzi
![Instagram post by @azchpn for Ulanzi. Caption reads: [...] このASMRクイズで使ったミニマイクはこれ🎤 Ulanzi A200....](https://images.od.modash.io/e9cc1000cef9d48c83eaba13dae44e260babd6dd)
Influencer bio
Chocola & Azuki & Panna PANNA HOUSE @pannahouse_official
Collaboration metrics
Get a free trial to find more data on influencer audiences, performance, and collaborations.
puccistudio x Ulanzi
![TikTok post by @puccistudio for Ulanzi. Caption reads: [...] Nesse vídeo eu comparo 5 microfones da....](https://images.od.modash.io/be0a62c309a376f59969e169fa8ca9b298ca0265)
Influencer bio
🎯Dicas de Tecnologia | Mobile | Foto | Video Creator | Consultor | Palestrante
Collaboration metrics
Get a free trial to find more data on influencer audiences, performance, and collaborations.
ArthurR x Ulanzi
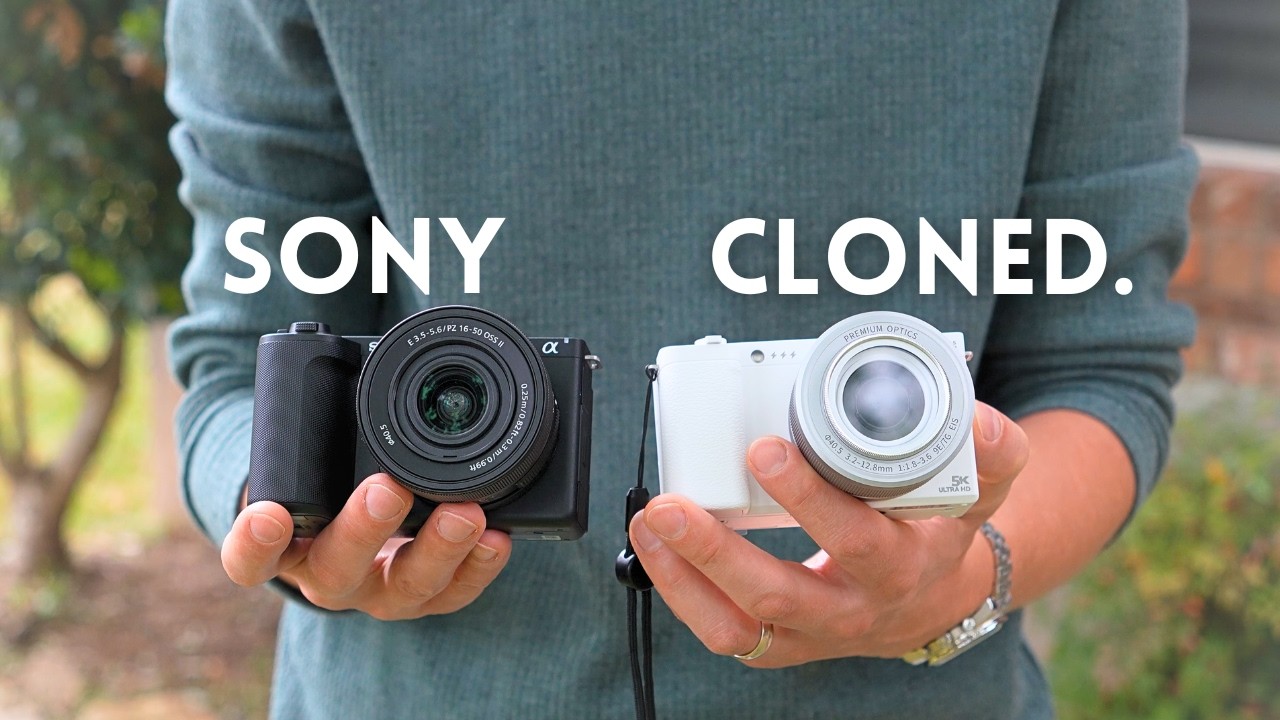
Influencer bio
My name is Arthur and this channel is about Sony APSC cameras and a lot of lenses, but sometimes other cool filmmaking gear as well. Photography is one of my hobbies and I hope to share it with you. Thank you for subscribing! 1 Subscriber - 12/01/2010 10 Subscribers - 12/03/2010 100 Subscribers - 10/11/2011 1,000 Subscribers - 05/28/2013 10,000 Subscribers - 11/22/2016 100,000 Subscribers - 05/06/2019
Collaboration metrics
Get a free trial to find more data on influencer audiences, performance, and collaborations.
If you break this down further by content type on Instagram, this is what it looks like:
- Reels: 84.4%
- Posts: 15.6%
💡 Related resource: How To Find Instagram Influencers.
Influencer audience size breakdown (by views)
For their top social platform (Instagram), here is a breakdown of the type of influencers Ulanzi are collaborating with, by audience size.
Note: this breakdown is based on each influencer's average views (not follower/subscriber count), because views typically correlate more closely with influencer pricing and impact.
Ulanzi's influencers average views (Instagram)
Based on each influencer's average views per post
With 39% of partnerships featuring creators averaging 1K-5K views, Ulanzi's strategy suggests niche targeting and authenticity, likely leveraging collaboration models like gifting and affiliates to work with smaller creators.
Here is an example of a sponsored collaboration with a larger-audience creator on Instagram (443.6k avg views/post):
cj.filmed.it x Ulanzi
![Instagram post by @cj.filmed.it for Ulanzi. Caption reads: [...] honestly… it is my new favourite. The....](https://images.od.modash.io/ae0fffcd92ae044b2d0ed96232e9008dcd8f155f)
Influencer bio
🎬 Here to help you make better-looking content 📹 Filmmaking | Gear reviews | Tutorials | BTS 📩 cj@badmoontalent.com 🎨 LUTs, Guides and more ⬇️
Collaboration metrics
Get a free trial to find more data on influencer audiences, performance, and collaborations.
And here is another example with a smaller creator on Instagram (10.0k avg views/post):
rebekamassry x Ulanzi
![Instagram post by @rebekamassry for Ulanzi. Caption reads: [...] había sido tan fluida ✨ Probando el....](https://images.od.modash.io/dbaae523f31f475f8a141a33ece653dbf54a1792)
Influencer bio
Collaboration metrics
Get a free trial to find more data on influencer audiences, performance, and collaborations.
Ulanzi's repeat partnerships
Out of 2.8k unique influencers in our dataset, 103 of them (4%) posted content for Ulanzi in 3 or more separate calendar months. The most consistent partner is @EricGibaud, who has collaborated across 12 months with 81 total posts.
Here are 3 examples of Ulanzi's repeat influencer partnerships, with links to the sponsored content.
EricGibaud x Ulanzi
![YouTube post by @EricGibaud for Ulanzi. Caption reads: [...] 5% Discount eric5 Meike: Ulanzi: Buy / Sell....](https://images.od.modash.io/27bca666017119297a1c128a36772e56cbfefe69)
![YouTube post by @EricGibaud for Ulanzi. Caption reads: [...] 5% Discount eric5 Meike: Ulanzi: Buy/Sell....](https://images.od.modash.io/b5440f06a0f55a994378727d50b17d33d30dbe20)
![YouTube post by @EricGibaud for Ulanzi. Caption reads: [...] 5% Discount eric5 Meike: Ulanzi: Amazon....](https://images.od.modash.io/82e3c4190b896791e48b0b63fcefc8ecc91c2dcd)
theghousefam x Ulanzi
![TikTok post by @theghousefam for Ulanzi. Caption reads: [...] its a face tracking tripod! #ulanzi #tripod....](https://images.od.modash.io/9a6fddbe19cf040a9a2cb6186ee58a8295912bfd)
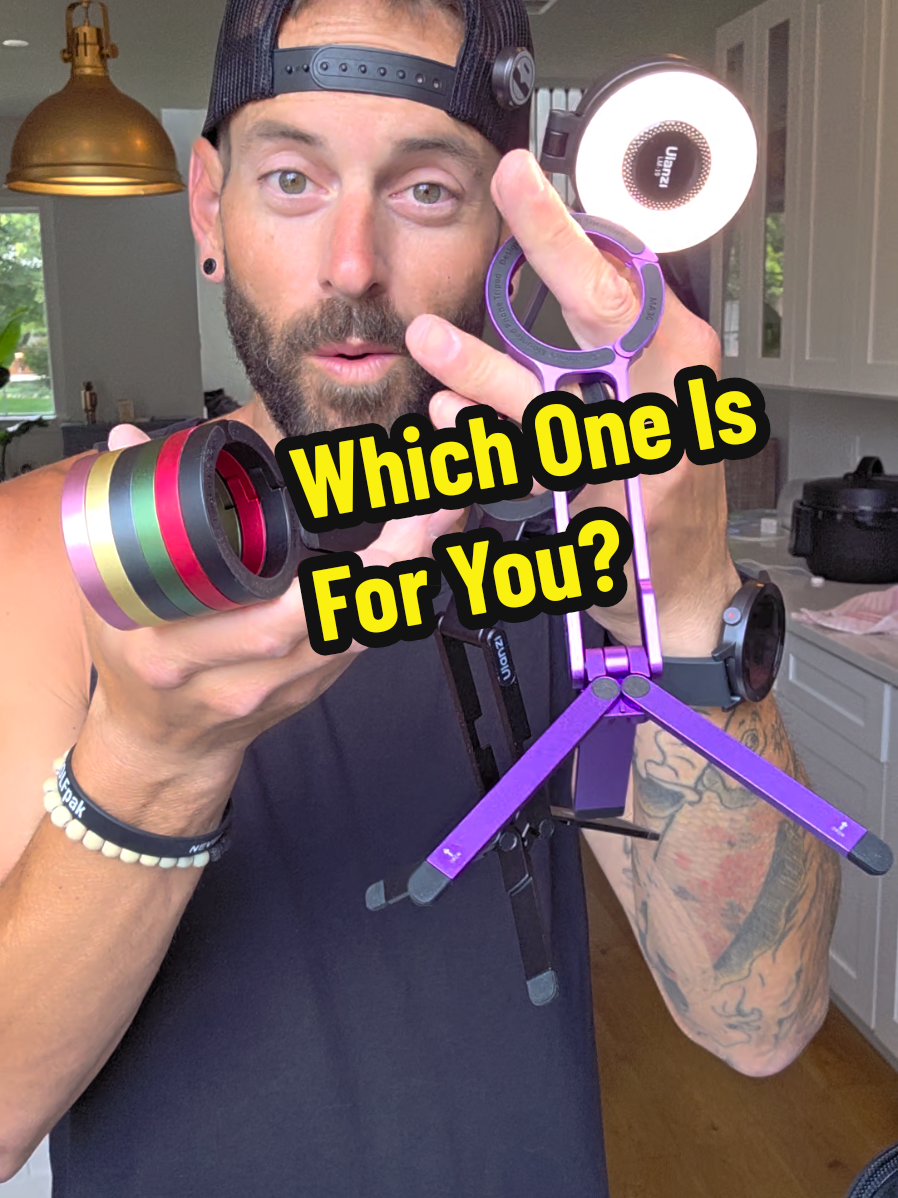
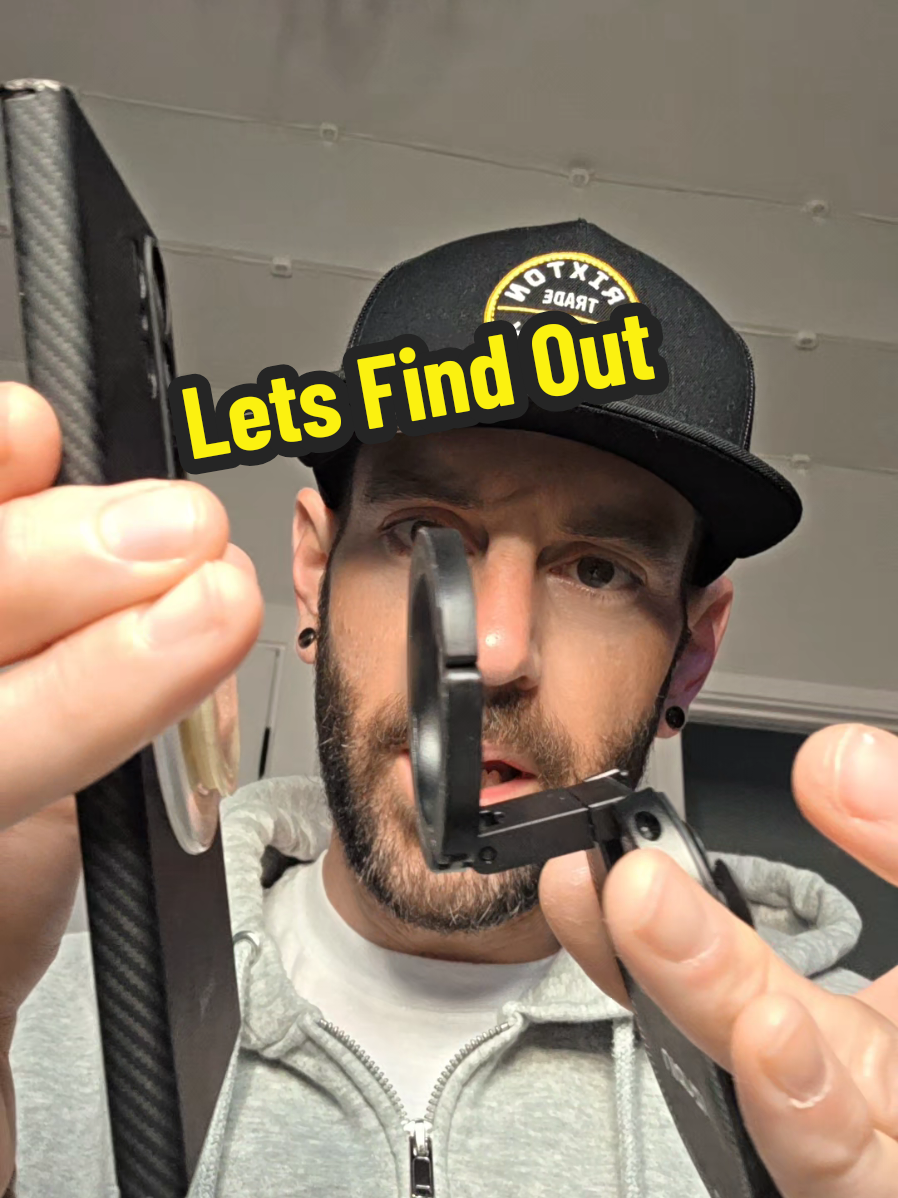
iu2ike x Ulanzi
![YouTube post by @iu2ike for Ulanzi. Caption reads: [...] "Slightly Less Cheesy" Tripod: Ulanzi Pocket....](https://images.od.modash.io/d9f6c5b46ae78192a3d5b3d5736432c08cef8b46)
![YouTube post by @iu2ike for Ulanzi. Caption reads: [...] "Slightly Less Cheesy" Tripod: Ulanzi Pocket....](https://images.od.modash.io/5f4be35096dffe3b98b94f0a06de27c135633a5b)
![YouTube post by @iu2ike for Ulanzi. Caption reads: [...] "Slightly Less Cheesy" Tripod: Ulanzi Pocket....](https://images.od.modash.io/7feaf6b45ac4f713899688a41144254c41bace42)
💡 Related resource: Long-Term Influencer Partnerships: Pros, Cons & How The Pros Manage Them.
Geographical breakdown
In our dataset, United States is where Ulanzi had the most influencer activity. 16.9% of their live influencer content in the last 12 months was posted by American influencers.
Based on the percentage of influencer content per market, other important markets include:
- Brazil (11.7%)
- Mexico (8.6%)
- Japan (7.1%)
Ulanzi's influencer activity by market
Here is another example of Ulanzi collaborating with an influencer in United States.
chefjulieyoon x Ulanzi
![TikTok post by @chefjulieyoon for Ulanzi. Caption reads: [...] this pretty metallic pink color too....](https://images.od.modash.io/123357b5bdbf99582bb1d7992e8b41fe4b6759fd)
Ulanzi's influencer activity vs. related brands
Ulanzi competes with Neewer and PGYTECH in creator gear (tripods, lighting, camera accessories), often targeting the same YouTube/TikTok production audience looking for affordable performance upgrades.
Total influencer content
Ulanzi vs. related brands influencer activity
Total sponsored posts tracked (last 12 months)
NEEWER leads with 6k sponsored posts, marginally ahead of Ulanzi (5.4k posts) and PGYTECH (2.4k posts). Across all three brands, the average volume is 4.6k posts, indicating mature, scaled influencer programs.
By social platform
Ulanzi vs. related brands influencer activity (by social platform)
Sponsored posts by platform
Ulanzi leads on TikTok, while NEEWER has the most activity on Instagram and YouTube. The gap is most notable on Instagram, with NEEWER at 3.4k, Ulanzi at 2.6k, PGYTECH at 1.6k posts. On YouTube, Ulanzi and NEEWER have several times more posts than PGYTECH.
By geographical market
Ulanzi vs. related brands influencer activity (by country)
Estimated sponsored posts in Ulanzi's top markets
NEEWER has the highest estimated sponsored-post volume in United States (1.5k posts, 25.4%), Italy (639 posts, 10.6%), Spain (531 posts, 8.8%), suggesting a Europe focus, while Ulanzi has the highest estimated sponsored-post volume in Brazil (632 posts, 11.7%), Mexico (465 posts, 8.6%), while PGYTECH has the highest estimated sponsored-post volume in Indonesia (211 posts, 8.7%), India (196 posts, 8.1%), suggesting a Asia focus. Looking at United States specifically, the split is NEEWER at 1.5k posts (25.4%), Ulanzi at 913 posts (16.9%), PGYTECH at 537 posts (22.2%).
Read more influencer strategy breakdowns
Looking for more like this? Here are 5 similar influencer marketing strategy breakdowns for other brands:
- NEEWER's Influencer Marketing Strategy
- PGYTECH's Influencer Marketing Strategy
- Unilever's Influencer Marketing Strategy
- Arrae's Influencer Marketing Strategy
- ZARA's Influencer Marketing Strategy
Or, if you want to access data like this for your own software or processes, take a look at Modash's API products:
Frequently asked questions
Scaling your influencer program?
When you outgrow your mishmash of spreadsheets & free tools, try Modash. Find & email influencers, track campaigns, ship products & more - all in one place.