PGYTECH Influencer Marketing Strategy
(2026 Data & Insights)
We analyzed 2.7k pieces of influencer content sponsored by PGYTECH over the last 12 months.
This report breaks down where & how PGYTECH invests in influencer marketing, which social platforms they prioritize, top geographical markets, and more.
The data in this report comes from Modash's Brand Collaborations API.
P.S. for a simple list of influencers who have collaborated with PGYTECH, see here: PGYTECH influencers.
Influencer activity throughout the year
PGYTECH's influencer campaigns are active year-round with notable month-to-month fluctuation. The chart below shows month-by-month data for total sponsored posts tracked.
PGYTECH's influencer activity by month
Number of sponsored posts
PGYTECH's influencer output appears relatively consistent throughout the year, averaging about 220 sponsored posts per month. December recorded the highest volume at 281 posts (28% above average), while November was the quietest at 158 posts.
Social platforms breakdown
In our dataset (which only includes Instagram, YouTube, and TikTok), this is how the volume of PGYTECH's sponsored influencer collaborations break down by social platform:
- Instagram: 1.7k posts (63.8%)
- TikTok: 829 posts (31.3%)
- YouTube: 131 posts (4.9%)
PGYTECH's influencer activity by platform
Share of sponsored content by social network
Instagram influencer marketing is a clear focus for PGYTECH.
Here are 3 examples of PGYTECH's recent sponsored collaborations (one each for Instagram, TikTok, YouTube).
mrjasonsantos x PGYTECH
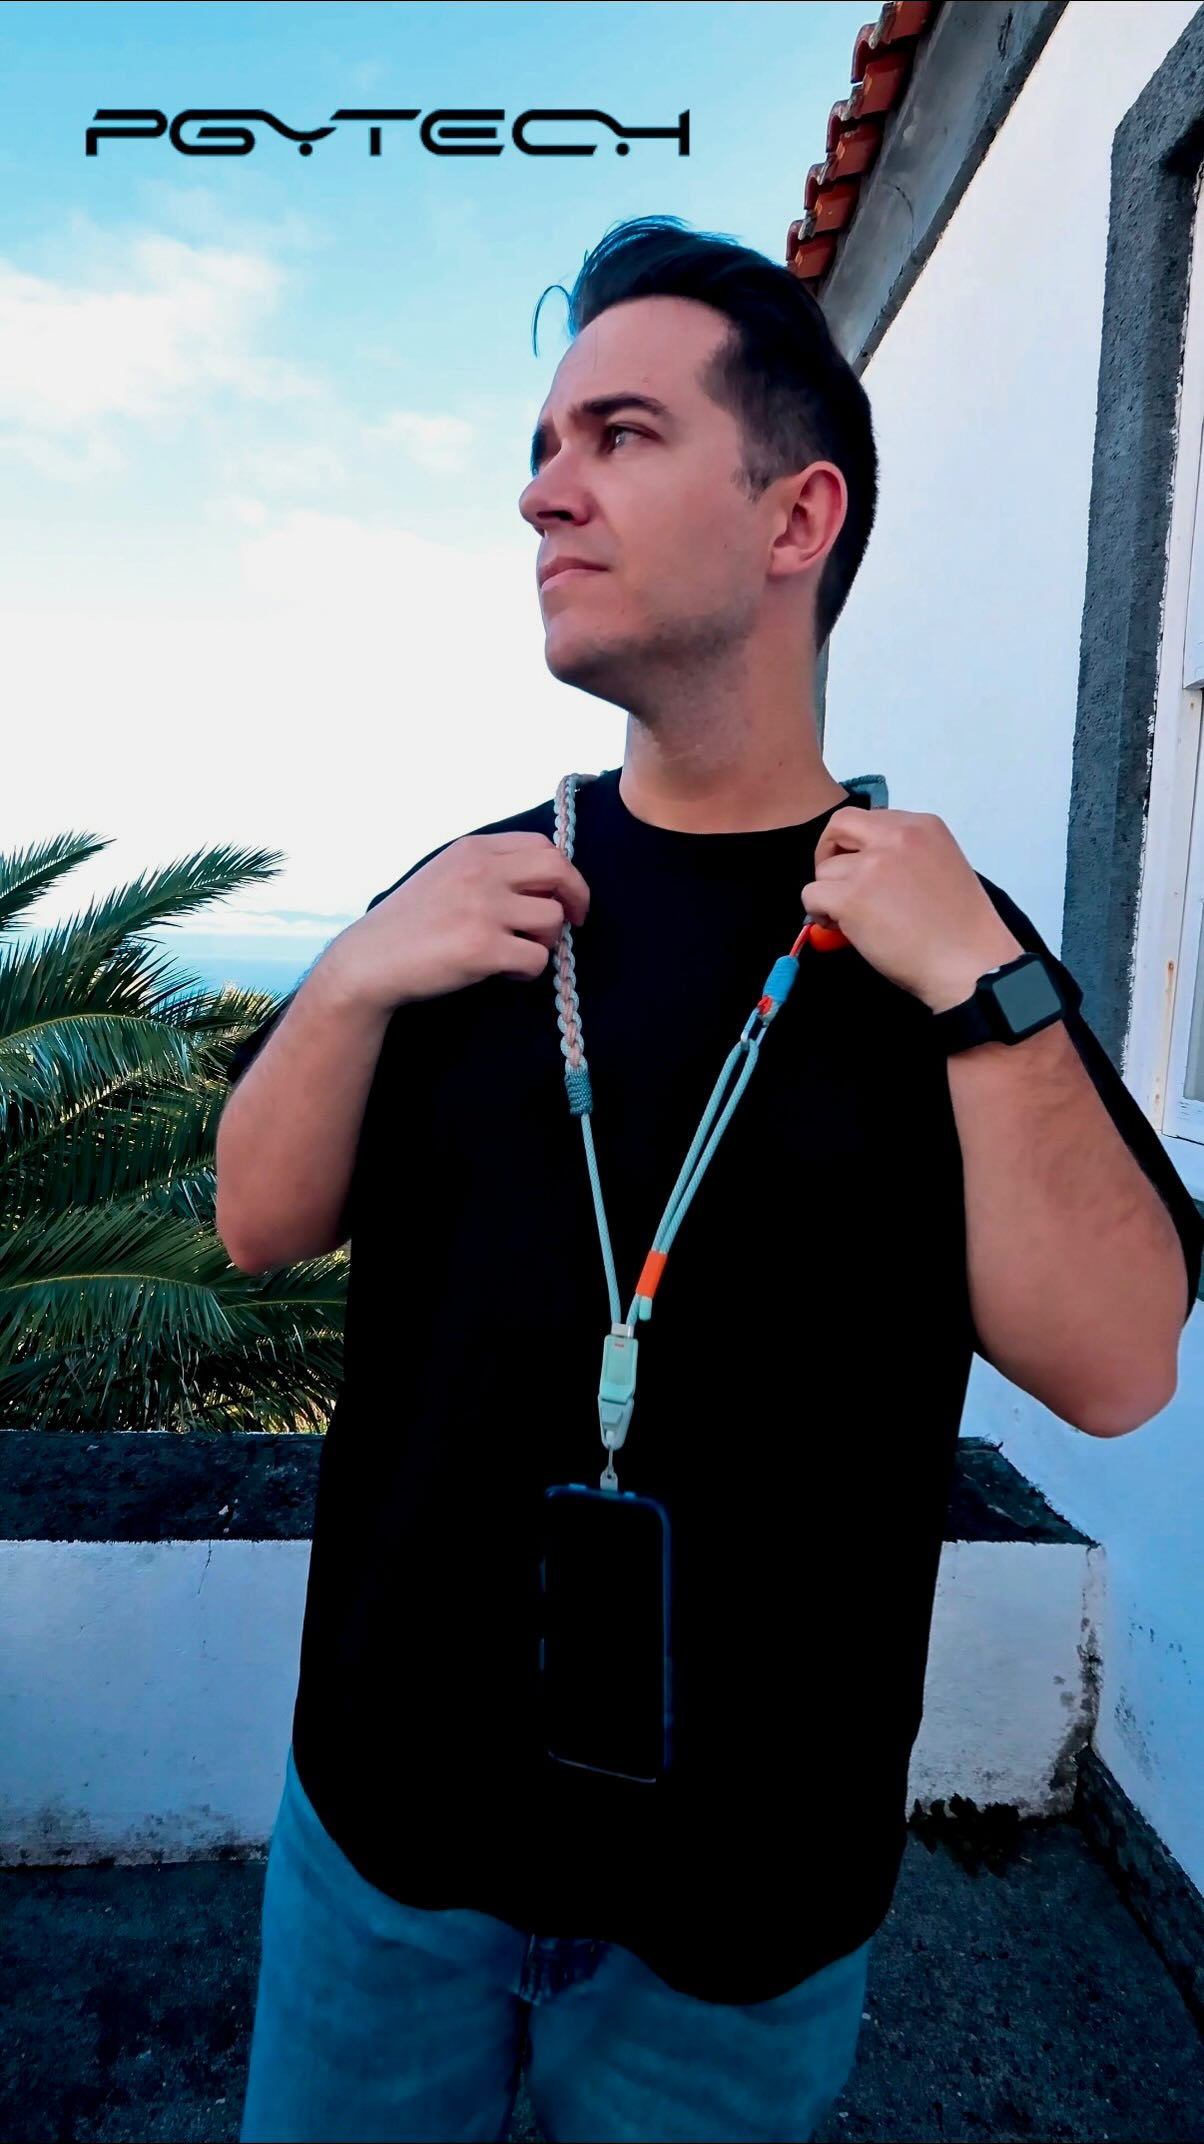
Influencer bio
Actor & Creator 🇵🇹🇺🇸 Pr, Digital & Brands: info@mrjasonsantos.com
Collaboration metrics
Get a free trial to find more data on influencer audiences, performance, and collaborations.
vessupvisuals x PGYTECH
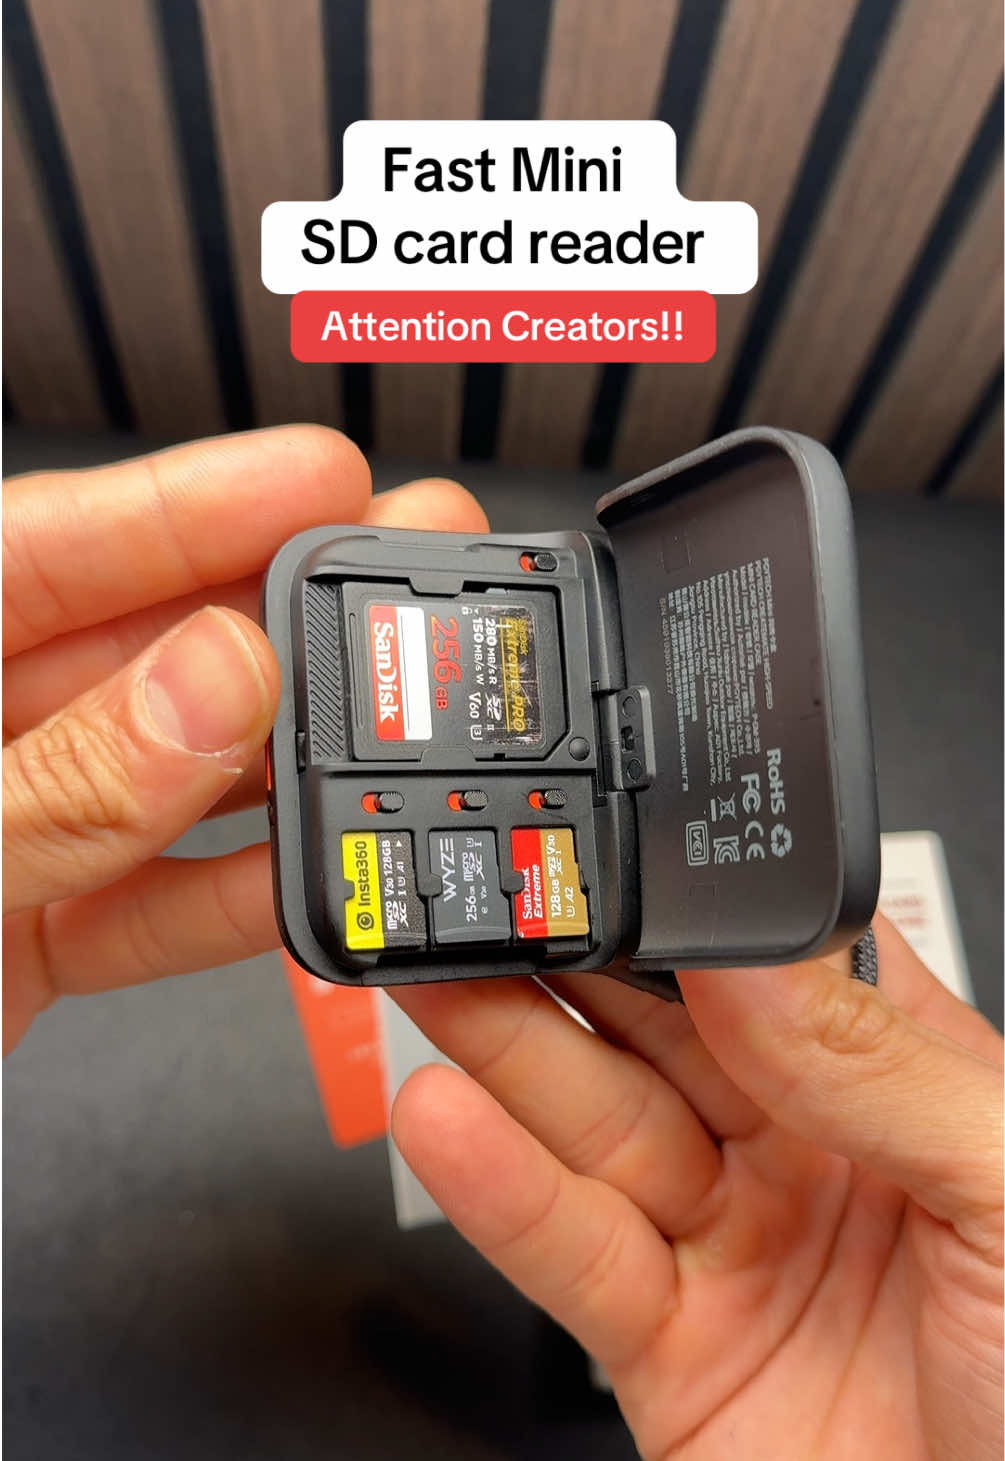
Influencer bio
Cinematic creator tools & storytelling Helping creators shoot better content 📩 Paid collabs ↓ Email - contentvvtt@gmail.com
Collaboration metrics
Get a free trial to find more data on influencer audiences, performance, and collaborations.
Chollette x PGYTECH
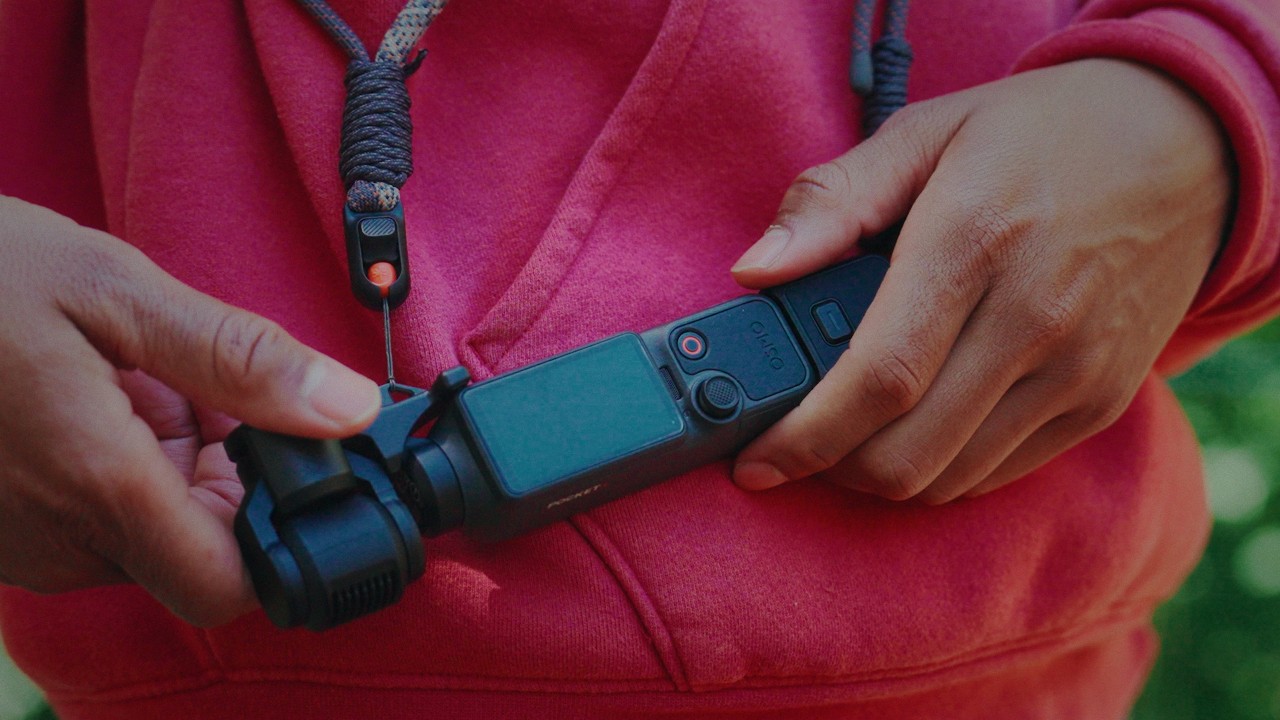
Influencer bio
Creator helping you create better. IG @chollette Website www.Chollette.com Contact orel@chollette.com
Collaboration metrics
Get a free trial to find more data on influencer audiences, performance, and collaborations.
If you break this down further by content type on Instagram, this is what it looks like:
- Reels: 70.5%
- Posts: 29.5%
💡 Related resource: How To Find Instagram Influencers.
Influencer audience size breakdown (by views)
For their top social platform (Instagram), here is a breakdown of the type of influencers PGYTECH are collaborating with, by audience size.
Note: this breakdown is based on each influencer's average views (not follower/subscriber count), because views typically correlate more closely with influencer pricing and impact.
PGYTECH's influencers average views (Instagram)
Based on each influencer's average views per post
With 40.1% of partnerships featuring creators averaging 1K-5K views, PGYTECH's strategy suggests niche targeting and authenticity, likely leveraging collaboration models like gifting and affiliates to work with smaller creators.
Here is an example of a sponsored collaboration with a larger-audience creator on Instagram (47.9k avg views/post):
romukbl x PGYTECH

Influencer bio
📷 Creative Photography and Video From #france🇫🇷 Certified drone pilot and FPV
Collaboration metrics
Get a free trial to find more data on influencer audiences, performance, and collaborations.
And here is another example with a smaller creator on Instagram (9.8k avg views/post):
manuela_palmberger x PGYTECH
![Instagram post by @manuela_palmberger for PGYTECH. Caption reads: [...] the OnePro Ultralight Backpack from....](https://images.od.modash.io/819f4ecba0b410c075ca3d296a72ff333028030d)
Influencer bio
Outdoor & travel photographer Always in the mountains 🏔 Based in Garmisch-Partenkirchen, Germany 🇩🇪 Contact -> m.palmberger@gmx.de
Collaboration metrics
Get a free trial to find more data on influencer audiences, performance, and collaborations.
PGYTECH's repeat partnerships
Out of 1.3k unique influencers in our dataset, 91 of them (7%) posted content for PGYTECH in 3 or more separate calendar months. The most consistent partner is @pgytech.gb, who has collaborated across 12 months with 95 total posts.
Here are 3 examples of PGYTECH's repeat influencer partnerships, with links to the sponsored content.
pgytech.gb x PGYTECH

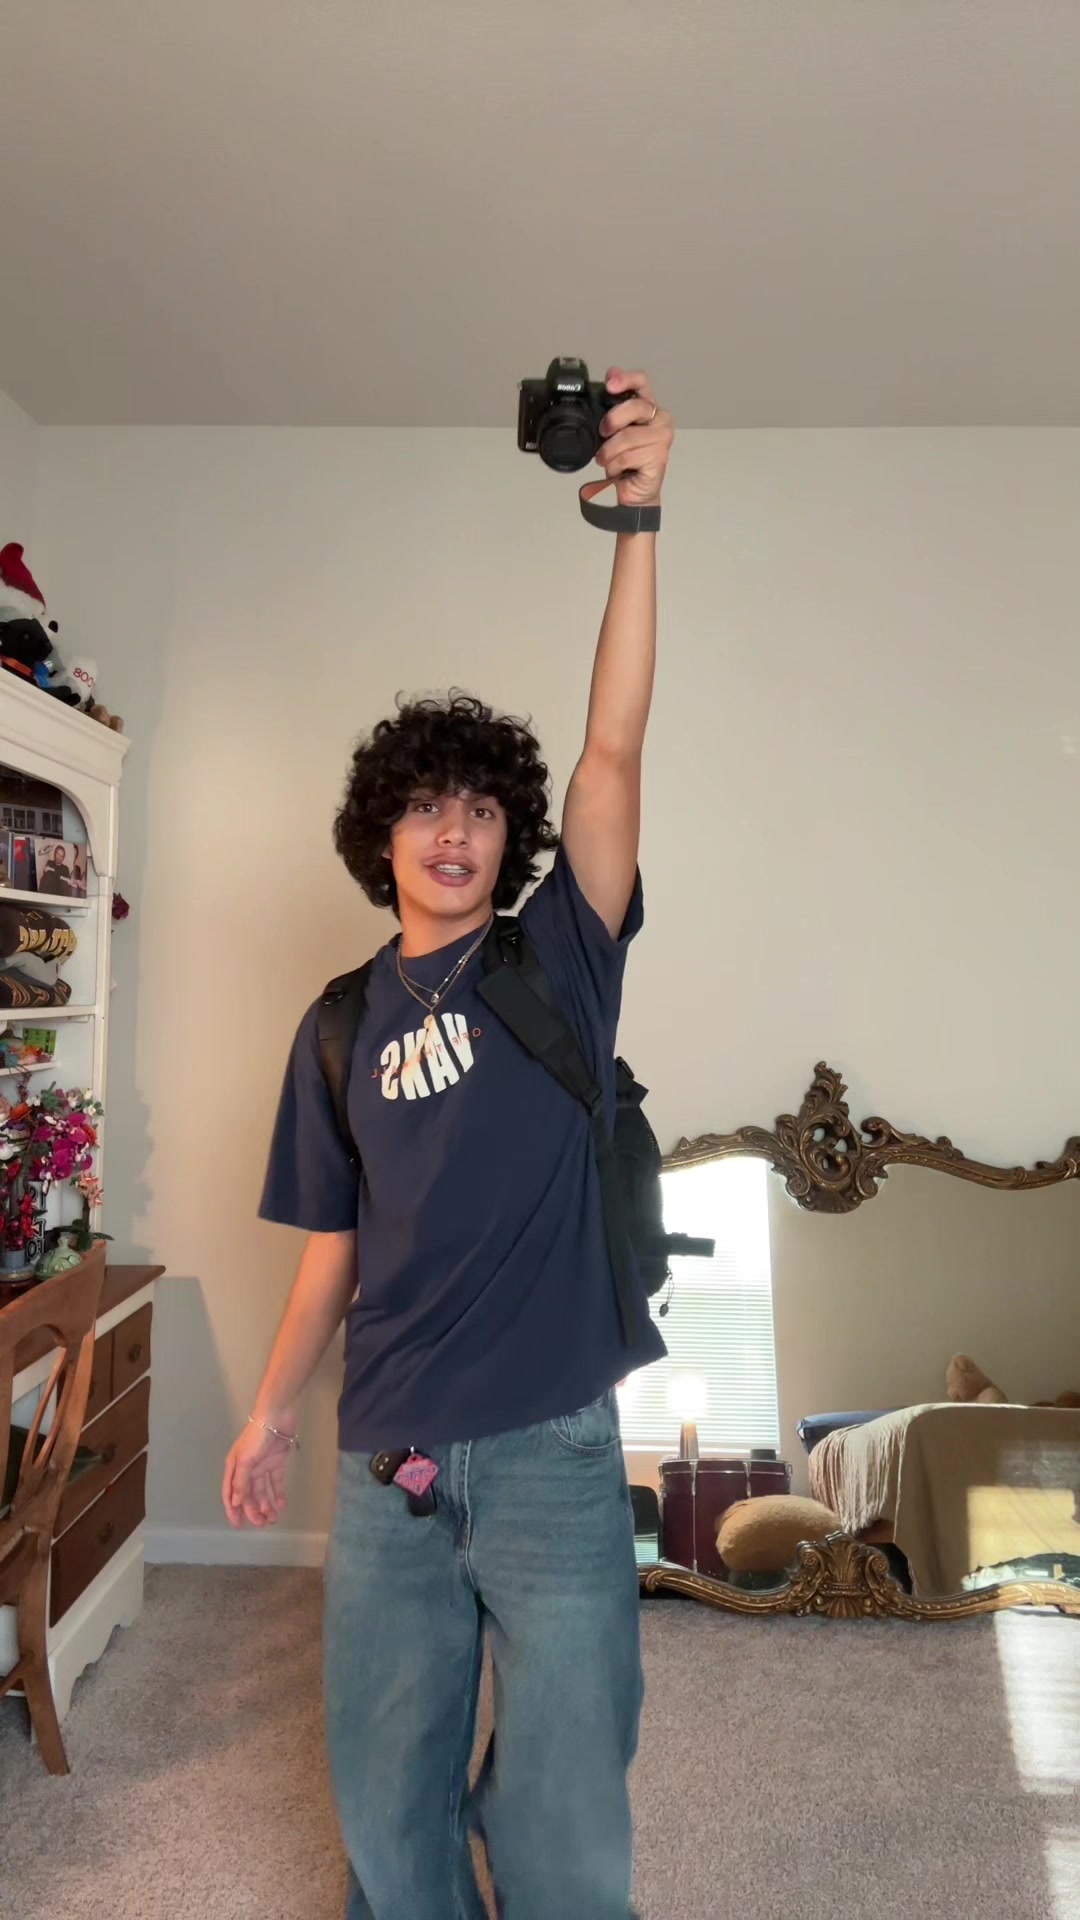
![Instagram post by @pgytech.gb for PGYTECH. Caption reads: [...] this one’s for you! #ad With @pgytechglobal....](https://images.od.modash.io/722dea6678360c43d42dae5a5ea7a3564fc1a09c)
pgytech.de x PGYTECH

![Instagram post by @pgytech.de for PGYTECH. Caption reads: [...] spots are listed below 🌱 The PGYTECH gear i....](https://images.od.modash.io/342d8490d7f962bdb7d6ad93a591ded7cf2b9f9c)
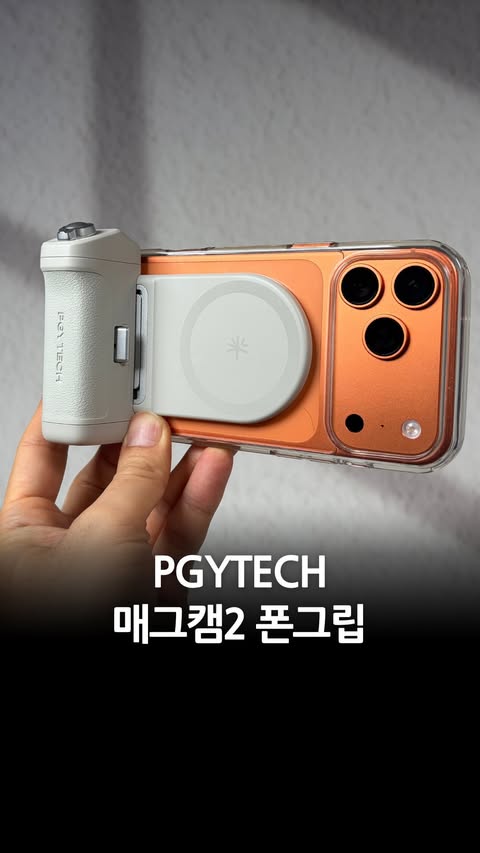
![Instagram post by @pgytech.de for PGYTECH. Caption reads: [...] è il Mag Cam Phone Grip 2 di PGYTECH una....](https://images.od.modash.io/0f01a175831bca615f307458b8d7c295d8c5a389)
pgytech.kr x PGYTECH
![Instagram post by @pgytech.kr for PGYTECH. Caption reads: 📱넥스트랩 PGYTECH LinkGo 🔥 @pgytech.kr #광고 새롭게 [...].](https://images.od.modash.io/e9aa6a208f346a73d7c3045e5f6344474f14af8c)
![Instagram post by @pgytech.kr for PGYTECH. Caption reads: [...] 사용하고 있어요!! 카메라 스트랩 고민하시는 분들께 @pgytech.kr....](https://images.od.modash.io/370ec8c69e85895187773363bf87c3fada52c3e9)
💡 Related resource: Long-Term Influencer Partnerships: Pros, Cons & How The Pros Manage Them.
Geographical breakdown
In our dataset, United States is where PGYTECH had the most influencer activity. 21.1% of their live influencer content in the last 12 months was posted by American influencers.
Based on the percentage of influencer content per market, other important markets include:
- Indonesia (8.4%)
- India (7.8%)
- Brazil (6.5%)
PGYTECH's influencer activity by market
Here is another example of PGYTECH collaborating with an influencer in United States.
an_drew_111 x PGYTECH
PGYTECH's influencer activity vs. related brands
NEEWER and Ulanzi both sell creator and camera accessories that overlap closely with PGYTECH’s photography, videography, and mobile rigging product lines. They compete for the same audience of content creators looking for practical gear upgrades and travel-friendly setups.
Total influencer content
PGYTECH vs. related brands influencer activity
Total sponsored posts tracked (last 12 months)
NEEWER leads with 6k sponsored posts, marginally ahead of Ulanzi (5.4k posts) and PGYTECH (2.7k posts). Across all three brands, the average volume is 4.7k posts, indicating mature, scaled influencer programs. PGYTECH has fewer total posts than NEEWER and Ulanzi.
By social platform
PGYTECH vs. related brands influencer activity (by social platform)
Sponsored posts by platform
Among these brands, NEEWER leads on Instagram and YouTube and Ulanzi leads on TikTok. The gap is most notable on Instagram, with NEEWER at 3.4k, Ulanzi at 2.6k, PGYTECH at 1.7k posts. On YouTube, PGYTECH has far fewer posts than NEEWER and Ulanzi.
By geographical market
PGYTECH vs. related brands influencer activity (by country)
Estimated sponsored posts in PGYTECH's top markets
NEEWER has the highest estimated sponsored-post volume in United States (1.5k posts, 25.4%), Italy (639 posts, 10.6%), Spain (531 posts, 8.8%), suggesting a Europe focus, while Ulanzi has the highest estimated sponsored-post volume in Brazil (632 posts, 11.7%), Mexico (465 posts, 8.6%), while PGYTECH has the highest estimated sponsored-post volume in Indonesia (223 posts, 8.4%), India (207 posts, 7.8%), suggesting a Asia focus. Looking at United States specifically, the split is NEEWER at 1.5k posts (25.4%), Ulanzi at 913 posts (16.9%), PGYTECH at 560 posts (21.1%).
Read more influencer strategy breakdowns
Looking for more like this? Here are 5 similar influencer marketing strategy breakdowns for other brands:
- NEEWER's Influencer Marketing Strategy
- Ulanzi's Influencer Marketing Strategy
- from Our Place's Influencer Marketing Strategy
- Curlyme's Influencer Marketing Strategy
- Paragon Fitwear's Influencer Marketing Strategy
Or, if you want to access data like this for your own software or processes, take a look at Modash's API products:
Frequently asked questions
Scaling your influencer program?
When you outgrow your mishmash of spreadsheets & free tools, try Modash. Find & email influencers, track campaigns, ship products & more - all in one place.