Away Influencer Marketing Strategy
(2026 Data & Insights)
We analyzed 1.4k pieces of influencer content sponsored by Away over the last 12 months.
This report breaks down where & how Away invests in influencer marketing, which social platforms they prioritize, top geographical markets, and more.
The data in this report comes from Modash's Brand Collaborations API.
P.S. for a simple list of influencers who have collaborated with Away, see here: Away influencers.
Influencer activity throughout the year
Away's influencer campaigns are active year-round with notable month-to-month fluctuation. The chart below shows month-by-month data for total sponsored posts tracked.
Away's influencer activity by month
Number of sponsored posts
Away's influencer output appears relatively consistent throughout the year, averaging about 117 sponsored posts per month. April recorded the highest volume at 176 posts (50% above average), while September was the quietest at 79 posts.
Social platforms breakdown
In our dataset (which only includes Instagram, YouTube, and TikTok), this is how the volume of Away's sponsored influencer collaborations break down by social platform:
- TikTok: 759 posts (53.9%)
- Instagram: 553 posts (39.3%)
- YouTube: 96 posts (6.8%)
Away's influencer activity by platform
Share of sponsored content by social network
TikTok influencer marketing is a clear focus for Away.
Here are 3 examples of Away's recent sponsored collaborations (one each for Instagram, TikTok, YouTube).
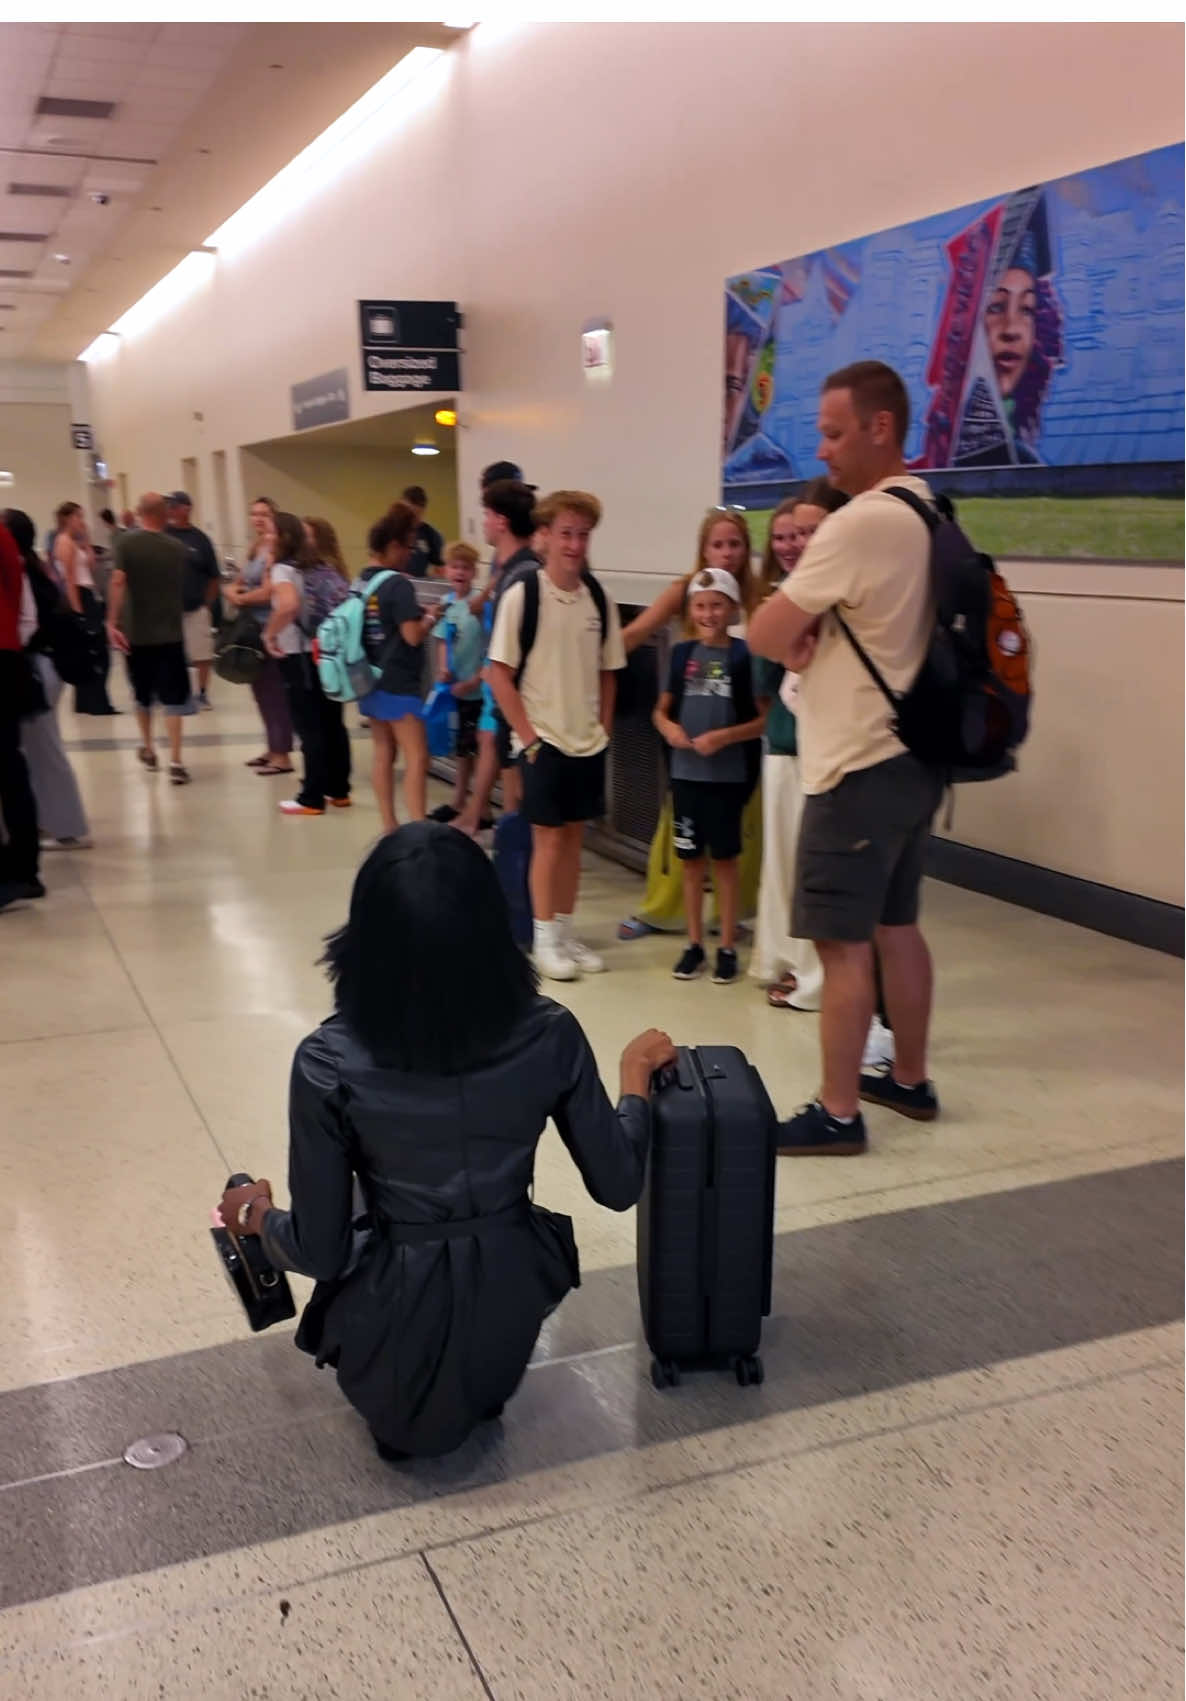
simonacruzer x Away
![Instagram post by @simonacruzer for Away. Caption reads: [...] shoes and 1 superiority complex into my....](https://images.od.modash.io/4e24443f7e04527a7a71e025dc4b46ca1b717c50)
Influencer bio
🧚Simona 🐀nicheless in NYC 💌partnerships@simonacruzer.com
Collaboration metrics
Get a free trial to find more data on influencer audiences, performance, and collaborations.
khian.kb x Away
Influencer bio
A COMEDIAN THAT DOESN’T CARE ABOUT HIS KNEES! Hello@thegoldstudios.com
Collaboration metrics
Get a free trial to find more data on influencer audiences, performance, and collaborations.
ANNAREID29 x Away
Influencer bio
Hello, and welcome to my channel! What started off as a creative outlet for me outside of running a business and taking care of 2 kids, my channel has now transformed into a place where we discuss fashion and style and how we can find a way to make it work for us and our own lifestyle. Thank you for being here!
Collaboration metrics
Get a free trial to find more data on influencer audiences, performance, and collaborations.
If you break this down further by content type on TikTok, this is what it looks like:
- Videos: 98%
- Carousels: 2%
💡 Related resource: How To Find TikTok Influencers.
Influencer audience size breakdown (by views)
For their top social platform (TikTok), here is a breakdown of the type of influencers Away are collaborating with, by audience size.
Note: this breakdown is based on each influencer's average views (not follower/subscriber count), because views typically correlate more closely with influencer pricing and impact.
Away's influencers average views (TikTok)
Based on each influencer's average views per post
With 33.4% of partnerships featuring creators averaging 1K-5K views, Away's strategy suggests niche targeting and authenticity, likely leveraging collaboration models like gifting and affiliates to work with smaller creators.
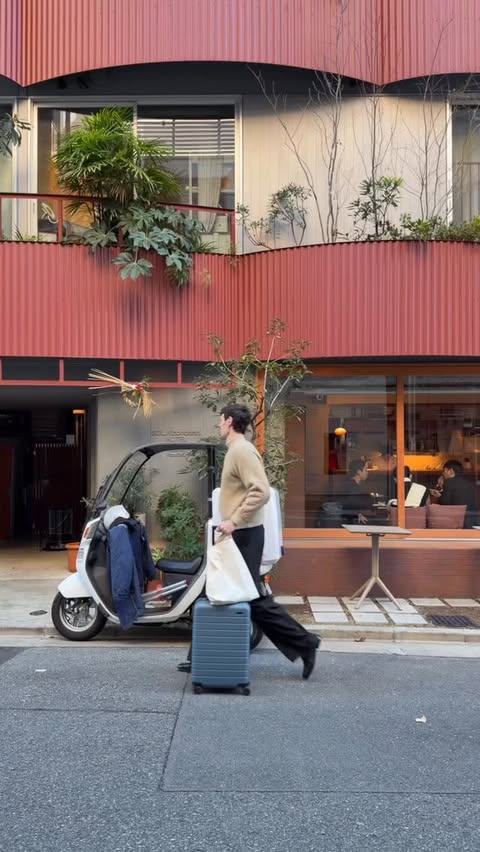
Here is an example of a sponsored collaboration with a larger-audience creator on TikTok (581.9k avg views/post):
gavnk x Away
![TikTok post by @gavnk for Away. Caption reads: [...] pack until we opened our brand new @away....](https://images.od.modash.io/ba3f906175012dd0fe5f324f48b29bec1a49191e)
Influencer bio
✞ just a dad in his early 20s 🕺 gavin@villamediallc.com
Collaboration metrics
Get a free trial to find more data on influencer audiences, performance, and collaborations.
And here is another example with a smaller creator on TikTok (9.7k avg views/post):
bestiebriitt x Away
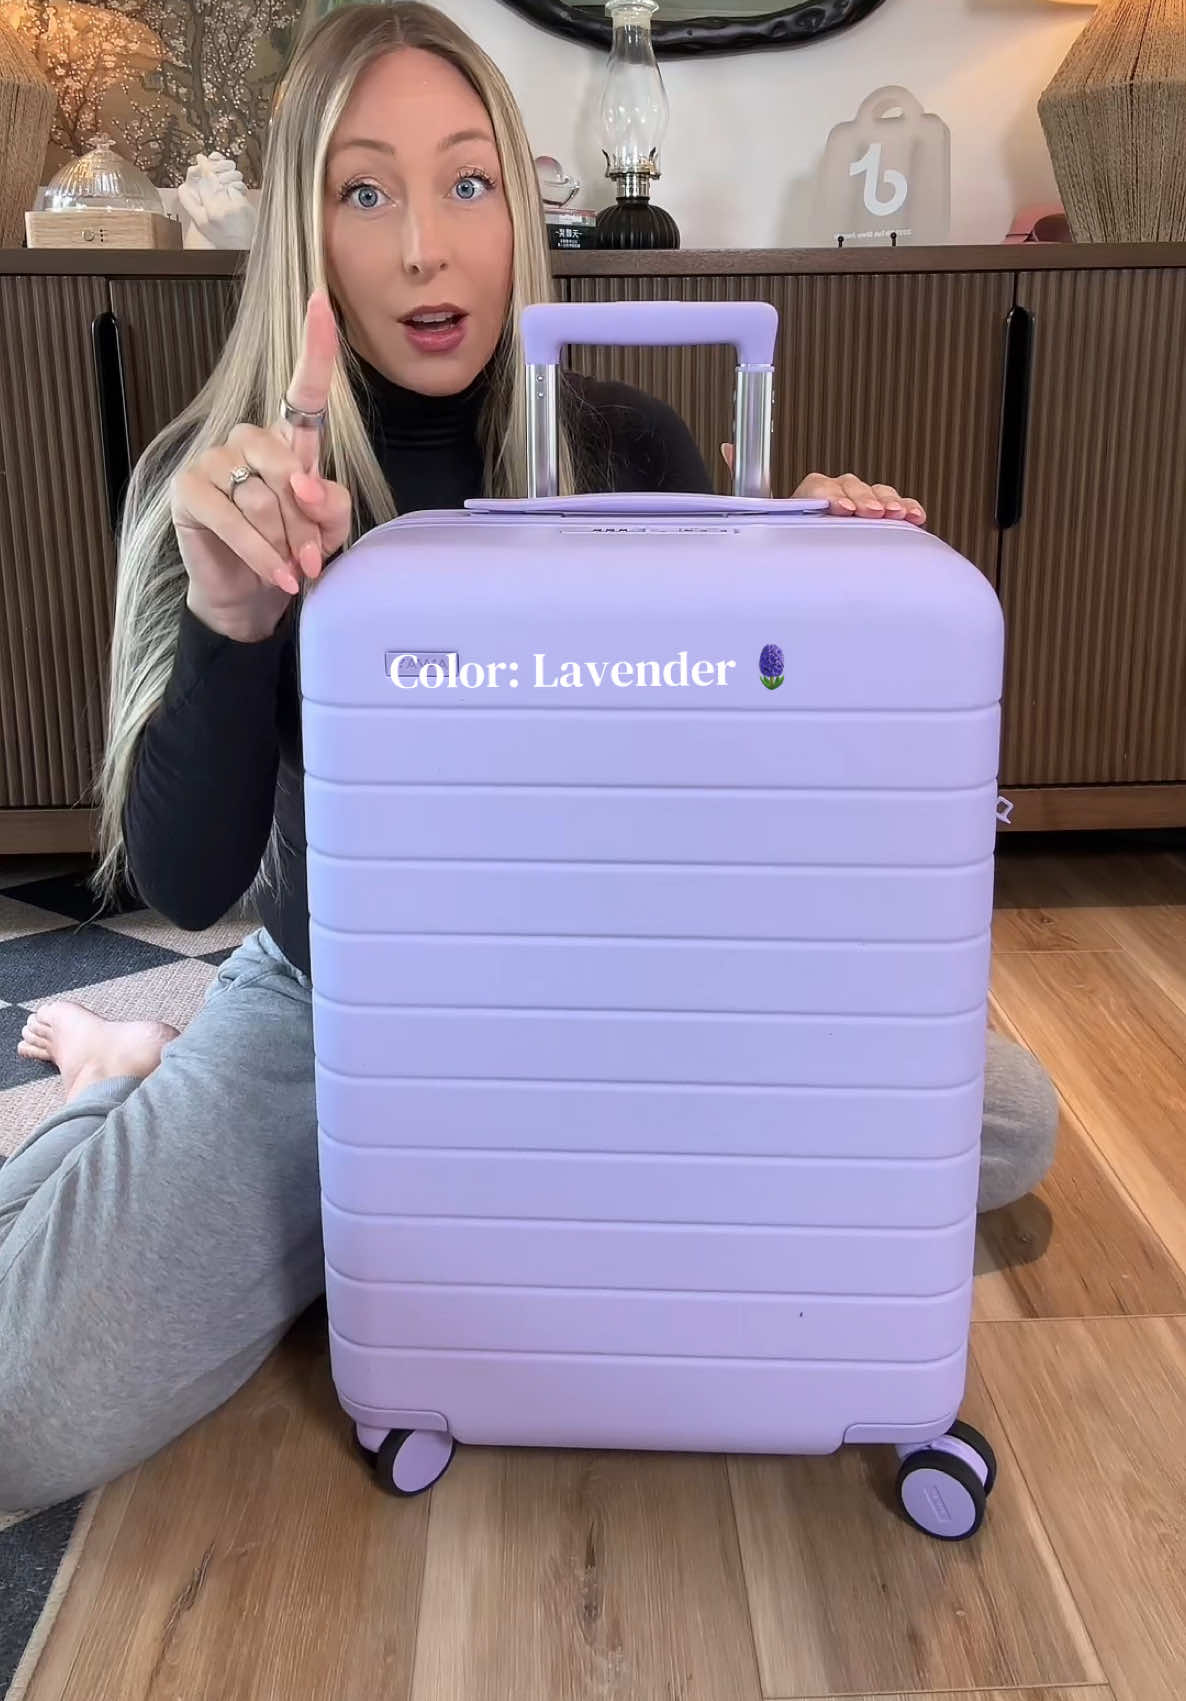
Influencer bio
TikTok Shop Home Creator of the Year 2025 Goli Breakout Creator of the Year 💌: bestiebriitt@taboost.me My ONLY 2 accounts: @B R I T T ✨ & @Brittanie Hammer
Collaboration metrics
Get a free trial to find more data on influencer audiences, performance, and collaborations.
Away's repeat partnerships
Out of 978 unique influencers in our dataset, 18 of them (2%) posted content for Away in 3 or more separate calendar months. The most consistent partner is @findingfiona, who has collaborated across 6 months with 9 total posts.
Here are 3 examples of Away's repeat influencer partnerships, with links to the sponsored content.
andrewpolo_ x Away
![Instagram post by @andrewpolo_ for Away. Caption reads: [...] right, i’m talking to you 🫵 @away....](https://images.od.modash.io/777d6a683ff32b6affff050a9a5324cc90bf85ca)
![Instagram post by @andrewpolo_ for Away. Caption reads: [...] you can do this instead 😀 @away....](https://images.od.modash.io/e2b9da26e713a28798c64090434f06d15e919f63)
![Instagram post by @andrewpolo_ for Away. Caption reads: [...] as a cropped backpack, right? @away....](https://images.od.modash.io/ff6d59fd298fd8317514562a1a479ea56952373d)
kevin.vinyl x Away
![TikTok post by @kevin.vinyl for Away. Caption reads: [...] arrive in time for Christmas! @Away Travel....](https://images.od.modash.io/b1a56111b6ce9b2c7682adfb05c2d17f1a3a8ebf)
![TikTok post by @kevin.vinyl for Away. Caption reads: [...] little guy, and it’s on sale! @Away Travel....](https://images.od.modash.io/600f40685cd37b9f650be792328d7d920a40a5d1)
![TikTok post by @kevin.vinyl for Away. Caption reads: [...] #mahjongtips #mahjongtiles @Away Travel.](https://images.od.modash.io/baa2d507cd4f49f38b2d2bfe1ebff9b035b62b6a)
andrewpolo_ x Away
![TikTok post by @andrewpolo_ for Away. Caption reads: [...] people that hate unpacking! @Away Travel’s....](https://images.od.modash.io/940fd214685a49c2c8efa43357c9e0527225b552)
![TikTok post by @andrewpolo_ for Away. Caption reads: #awaypartner double protection for [...].](https://images.od.modash.io/2c39cb64fca5340b59fa47d7f83ed50b5fbfe53b)
![TikTok post by @andrewpolo_ for Away. Caption reads: [...] with this crossbody bag from @away....](https://images.od.modash.io/ceeec4449c84e6f29bba67ffc403872ee97dbda4)
💡 Related resource: Long-Term Influencer Partnerships: Pros, Cons & How The Pros Manage Them.
Geographical breakdown
In our dataset, United States is where Away had the most influencer activity. 75.6% of their live influencer content in the last 12 months was posted by American influencers.
Based on the percentage of influencer content per market, other important markets include:
- United Kingdom (6.6%)
- Canada (4%)
- Brazil (2.5%)
Away's influencer activity by market
Here is another example of Away collaborating with an influencer in United States.
drewfromladue x Away
Away's influencer activity vs. related brands
Away competes most directly with Monos and BÉIS Travel in premium, DTC-led luggage aimed at design-conscious travelers. They fight for similar audiences through packing content, UGC reviews, and travel creator partnerships.
Total influencer content
Away vs. related brands influencer activity
Total sponsored posts tracked (last 12 months)
BÉIS Travel leads with 1.7k sponsored posts, notably outpacing Away (1.4k posts) and Monos (470 posts). Across all three brands, the average volume is 1.2k posts, suggesting established influencer marketing investments. BÉIS Travel has far more total posts than Away and Monos.
By social platform
Away vs. related brands influencer activity (by social platform)
Sponsored posts by platform
Away leads on Instagram and YouTube, while BÉIS Travel leads on TikTok. The gap is most notable on TikTok, with BÉIS Travel at 1.7k, Away at 759, Monos at 77 posts. Monos's activity is particularly concentrated on Instagram. BÉIS Travel has far more posts on TikTok, while Away and Monos have far more posts on Instagram.
By geographical market
Away vs. related brands influencer activity (by country)
Estimated sponsored posts in Away's top markets
BÉIS Travel has the highest estimated sponsored-post volume in United States (1.3k posts, 76.9%), Canada (115 posts, 6.6%), United Kingdom (99 posts, 5.7%), suggesting a North America focus. Looking at United States specifically, the split is BÉIS Travel at 1.3k posts (76.9%), Away at 1.1k posts (75.6%), Monos at 214 posts (45.6%).
Read more influencer strategy breakdowns
Looking for more like this? Here are 5 similar influencer marketing strategy breakdowns for other brands:
- Monos's Influencer Marketing Strategy
- BÉIS Travel's Influencer Marketing Strategy
- Peter Thomas Roth's Influencer Marketing Strategy
- BondiBoost's Influencer Marketing Strategy
- The Collagen's Influencer Marketing Strategy
Or, if you want to access data like this for your own software or processes, take a look at Modash's API products:
Frequently asked questions
Scaling your influencer program?
When you outgrow your mishmash of spreadsheets & free tools, try Modash. Find & email influencers, track campaigns, ship products & more - all in one place.