Peter Thomas Roth Influencer Marketing Strategy
(2026 Data & Insights)
We analyzed 14.4k pieces of influencer content sponsored by Peter Thomas Roth over the last 12 months.
This report breaks down where & how Peter Thomas Roth invests in influencer marketing, which social platforms they prioritize, top geographical markets, and more.
The data in this report comes from Modash's Brand Collaborations API.
P.S. for a simple list of influencers who have collaborated with Peter Thomas Roth, see here: Peter Thomas Roth influencers.
Influencer activity throughout the year
Peter Thomas Roth's influencer marketing output shows strong seasonal variation, with some months seeing 3x or more activity than others. The chart below shows month-by-month data for total sponsored posts tracked.
Peter Thomas Roth's influencer activity by month
Number of sponsored posts
Peter Thomas Roth's sponsored post volume appears to trend upward over the 12-month period, rising from 889 posts in January to 1.4k in December. The peak month, November, reached 3.8k posts, 212% higher than the monthly average of 1.2k.
Social platforms breakdown
In our dataset (which only includes Instagram, YouTube, and TikTok), this is how the volume of Peter Thomas Roth's sponsored influencer collaborations break down by social platform:
- TikTok: 13.6k posts (94.4%)
- Instagram: 761 posts (5.3%)
- YouTube: 44 posts (0.3%)
Peter Thomas Roth's influencer activity by platform
Share of sponsored content by social network
TikTok influencer marketing is a clear focus for Peter Thomas Roth.
Here are 3 examples of Peter Thomas Roth's recent sponsored collaborations (one each for Instagram, TikTok, YouTube).
ryan.kaoud x Peter Thomas Roth
Influencer bio
Unc aspired Father 💍 @montana.kaoud 📩 mrk@night.co 👻 Ryan.Kaoud
Collaboration metrics
Get a free trial to find more data on influencer audiences, performance, and collaborations.
lifesimplified1 x Peter Thomas Roth
Influencer bio
Mikes Honest Reviews because you deserve the truth about tik tok shop products
Collaboration metrics
Get a free trial to find more data on influencer audiences, performance, and collaborations.
AlanChikinChow x Peter Thomas Roth

Influencer bio
⬇️ Read our NEW WEBCOMIC ⬇️
Collaboration metrics
Get a free trial to find more data on influencer audiences, performance, and collaborations.
If you break this down further by content type on TikTok, this is what it looks like:
- Videos: 94.7%
- Carousels: 5.3%
💡 Related resource: How To Find TikTok Influencers.
Influencer audience size breakdown (by views)
For their top social platform (TikTok), here is a breakdown of the type of influencers Peter Thomas Roth are collaborating with, by audience size.
Note: this breakdown is based on each influencer's average views (not follower/subscriber count), because views typically correlate more closely with influencer pricing and impact.
Peter Thomas Roth's influencers average views (TikTok)
Based on each influencer's average views per post
With 80.7% of partnerships featuring creators averaging <1K views, Peter Thomas Roth's strategy suggests niche targeting and authenticity, likely leveraging collaboration models like gifting and affiliates to work with smaller creators.
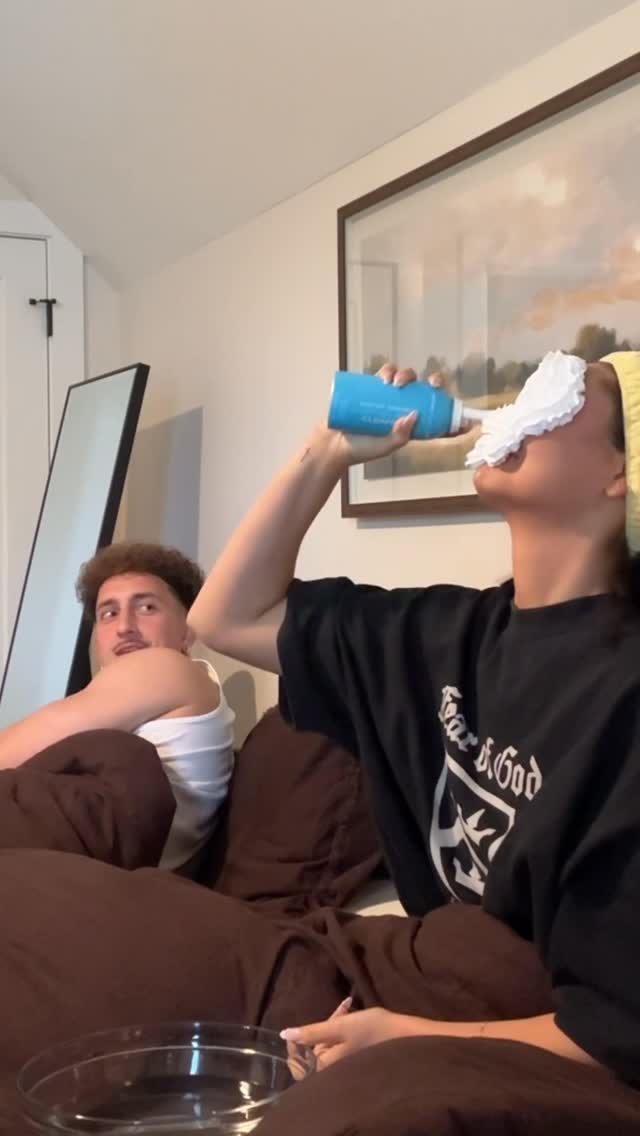
Here is an example of a sponsored collaboration with a larger-audience creator on TikTok (487.9k avg views/post):
itsmekelsc x Peter Thomas Roth
![TikTok post by @itsmekelsc for Peter Thomas Roth. Caption reads: [...] + the brush + sample eye patches! @Peter....](https://images.od.modash.io/e14861c4e219e7bec243a250b269f59b8b01666a)
Influencer bio
Confidence | Beauty | Lifestyle 💕✨🌸💅🏼🎀 kelsc@shinetalentgroup.com 📍LA
Collaboration metrics
Get a free trial to find more data on influencer audiences, performance, and collaborations.
And here is another example with a smaller creator on TikTok (9.8k avg views/post):
mrsh0222 x Peter Thomas Roth

Influencer bio
My dogs, GenX, my favorite finds! Email for collabs at KarHutShop@gmail.com
Collaboration metrics
Get a free trial to find more data on influencer audiences, performance, and collaborations.
Peter Thomas Roth's repeat partnerships
Out of 6.3k unique influencers in our dataset, 549 of them (9%) posted content for Peter Thomas Roth in 3 or more separate calendar months. The most consistent partner is @koopette27619, who has collaborated across 11 months with 124 total posts.
Here are 3 examples of Peter Thomas Roth's repeat influencer partnerships, with links to the sponsored content.
koopette27619 x Peter Thomas Roth
![TikTok post by @koopette27619 for Peter Thomas Roth. Caption reads: [...] tightener’s result?? 🍊 Peter Thomas Roth....](https://images.od.modash.io/d2702dd78ac0c87212bf5b36b4857238999fe28c)
![TikTok post by @koopette27619 for Peter Thomas Roth. Caption reads: [...] proof. #undereyebags #peterthomasroth....](https://images.od.modash.io/3b19b4ebe65a9aa8d179d0c0360f6952c09ee02d)
![TikTok post by @koopette27619 for Peter Thomas Roth. Caption reads: [...] longer defining my look. #peterthomasroth....](https://images.od.modash.io/244d01e56e8c440f8dd845ea0141c4558150b629)
trinidad1967 x Peter Thomas Roth
![TikTok post by @trinidad1967 for Peter Thomas Roth. Caption reads: @Peter Thomas Roth Labs #SuperBrandDayBFCM [...].](https://images.od.modash.io/71d773a055a01a15cfea259de07a6a260f59ae2d)
![TikTok post by @trinidad1967 for Peter Thomas Roth. Caption reads: @Peter Thomas Roth Labs #latina#pielbonita [...].](https://images.od.modash.io/c95888cd2bac4a3c92dfd0cb63223954c2a95b13)
![TikTok post by @trinidad1967 for Peter Thomas Roth. Caption reads: @Peter Thomas Roth Labs [...].](https://images.od.modash.io/82ba1ebfbf870f53cf403775963dfb9494a9080d)
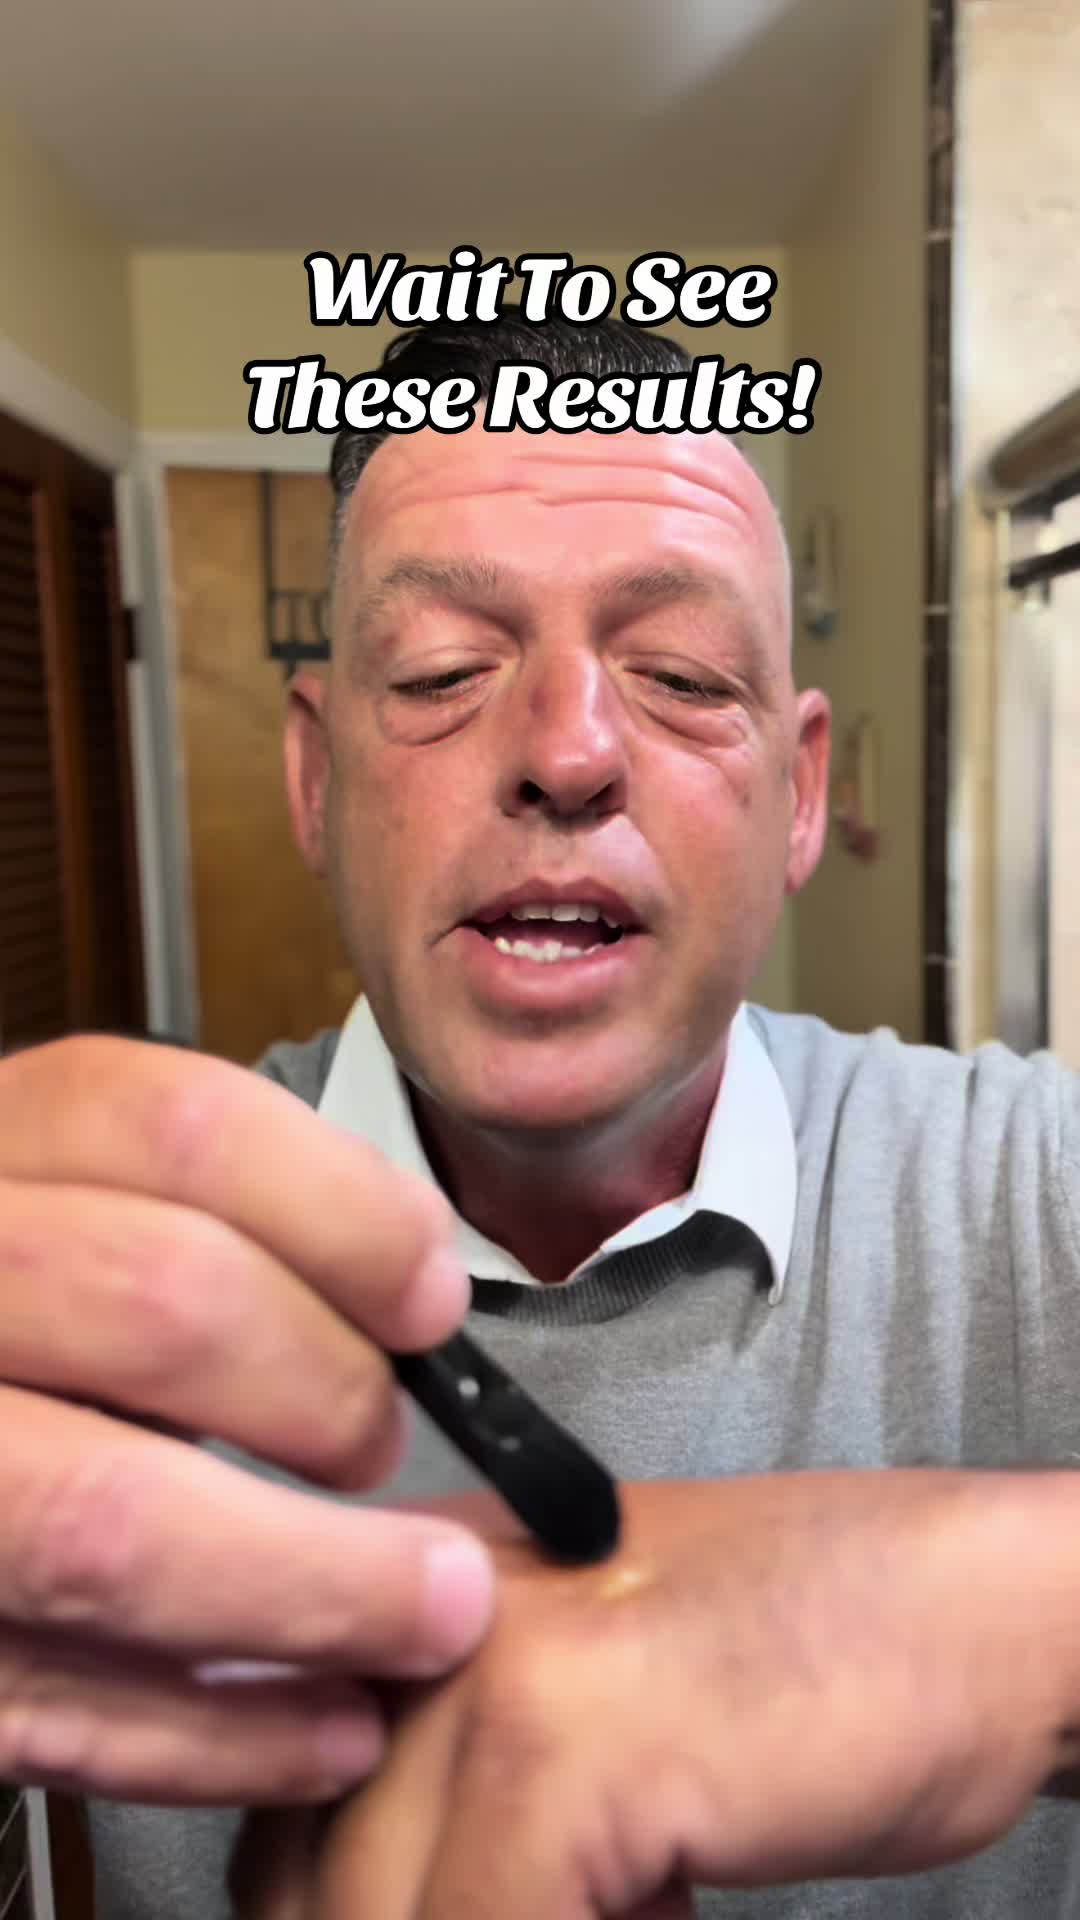
itswalterhops x Peter Thomas Roth
![TikTok post by @itswalterhops for Peter Thomas Roth. Caption reads: [...] more white residue with @Peter Thomas Roth....](https://images.od.modash.io/3971cac0d38ec6f8ccb459991de185358bdc2fd6)
![TikTok post by @itswalterhops for Peter Thomas Roth. Caption reads: [...] look years younger 👀💖 @Peter Thomas Roth....](https://images.od.modash.io/a089323cb7afa1ca66a8ae753a6964ca427b71b9)
![TikTok post by @itswalterhops for Peter Thomas Roth. Caption reads: [...] eyebags & dark circles! @Peter Thomas Roth....](https://images.od.modash.io/2c485c1d746b33acd027380efc41f877bcc1ed95)
💡 Related resource: Long-Term Influencer Partnerships: Pros, Cons & How The Pros Manage Them.
Geographical breakdown
In our dataset, United States is where Peter Thomas Roth had the most influencer activity. 61.9% of their live influencer content in the last 12 months was posted by American influencers.
Based on the percentage of influencer content per market, other important markets include:
- United Kingdom (6.2%)
- Canada (4.6%)
- India (3.8%)
Peter Thomas Roth's influencer activity by market
Here is another example of Peter Thomas Roth collaborating with an influencer in United States.
sherri1223 x Peter Thomas Roth
![TikTok post by @sherri1223 for Peter Thomas Roth. Caption reads: [...] #tiktokshopcreatorpicks @Peter Thomas Roth....](https://images.od.modash.io/17006555eb8e93cd9d3c6cc04f2512d318e34a32)
Peter Thomas Roth's influencer activity vs. related brands
Peter Thomas Roth sits in clinical-leaning skincare alongside First Aid Beauty and Kate Somerville, competing for results-focused consumers who respond to ingredient education and creator-led product testing.
Total influencer content
Peter Thomas Roth vs. related brands influencer activity
Total sponsored posts tracked (last 12 months)
Peter Thomas Roth leads with 14.4k sponsored posts, significantly outpacing First Aid Beauty (4.8k posts) and Kate Somerville (1.2k posts). Across all three brands, the average volume is 6.8k posts, indicating mature, scaled influencer programs. Peter Thomas Roth has several times more total posts than First Aid Beauty and Kate Somerville.
By social platform
Peter Thomas Roth vs. related brands influencer activity (by social platform)
Sponsored posts by platform
Peter Thomas Roth leads on Instagram, TikTok, and YouTube. The gap is most notable on TikTok, with Peter Thomas Roth at 13.6k, First Aid Beauty at 4k, Kate Somerville at 674 posts. Peter Thomas Roth's activity is particularly concentrated on TikTok. On TikTok, Peter Thomas Roth has several times more posts than First Aid Beauty and Kate Somerville.
By geographical market
Peter Thomas Roth vs. related brands influencer activity (by country)
Estimated sponsored posts in Peter Thomas Roth's top markets
Peter Thomas Roth has the highest estimated sponsored-post volume in United States (8.9k posts, 61.9%), United Kingdom (896 posts, 6.2%), Canada (665 posts, 4.6%), suggesting a North America focus, while First Aid Beauty leads in France with 271 posts (5.7%). Looking at United States specifically, the split is Peter Thomas Roth at 8.9k posts (61.9%), First Aid Beauty at 2.5k posts (52%), Kate Somerville at 623 posts (52.3%).
Read more influencer strategy breakdowns
Looking for more like this? Here are 5 similar influencer marketing strategy breakdowns for other brands:
- First Aid Beauty's Influencer Marketing Strategy
- Kate Somerville's Influencer Marketing Strategy
- EZ Tattoo Supply's Influencer Marketing Strategy
- Fenty Beauty's Influencer Marketing Strategy
- currentbody's Influencer Marketing Strategy
Or, if you want to access data like this for your own software or processes, take a look at Modash's API products:
Frequently asked questions
Scaling your influencer program?
When you outgrow your mishmash of spreadsheets & free tools, try Modash. Find & email influencers, track campaigns, ship products & more - all in one place.