BABYBOO FASHION Influencer Marketing Strategy
(2026 Data & Insights)
We analyzed 6.3k pieces of influencer content sponsored by BABYBOO FASHION over the last 12 months.
This report breaks down where & how BABYBOO FASHION invests in influencer marketing, which social platforms they prioritize, top geographical markets, and more.
The data in this report comes from Modash's Brand Collaborations API.
P.S. for a simple list of influencers who have collaborated with BABYBOO FASHION, see here: BABYBOO FASHION influencers.
Influencer activity throughout the year
BABYBOO FASHION's influencer campaigns are active year-round with notable month-to-month fluctuation. The chart below shows month-by-month data for total sponsored posts tracked.
BABYBOO FASHION's influencer activity by month
Number of sponsored posts
BABYBOO FASHION's influencer output appears relatively consistent throughout the year, averaging about 524 sponsored posts per month. December recorded the highest volume at 723 posts (38% above average), while June was the quietest at 265 posts.
Social platforms breakdown
In our dataset (which only includes Instagram, YouTube, and TikTok), this is how the volume of BABYBOO FASHION's sponsored influencer collaborations break down by social platform:
- Instagram: 4.4k posts (69.9%)
- TikTok: 1.9k posts (29.9%)
- YouTube: 15 posts (0.2%)
BABYBOO FASHION's influencer activity by platform
Share of sponsored content by social network
Instagram influencer marketing is a clear focus for BABYBOO FASHION.
Here are 3 examples of BABYBOO FASHION's recent sponsored collaborations (one each for Instagram, TikTok, YouTube).
sosazerafa x BABYBOO FASHION
![Instagram post by @sosazerafa for BABYBOO FASHION. Caption reads: [...] *SHOP* for a direct link for these....](https://images.od.modash.io/a47f20ba7431ebaeae8cbe0d689346cae6c26967)
Influencer bio
#fashion - #lifestyle @fashionnova girlie 🥰💫 💌sarahzerafa23@gmail.com
Collaboration metrics
Get a free trial to find more data on influencer audiences, performance, and collaborations.
chriena x BABYBOO FASHION
Influencer bio
Helping you to look, smell and dress better Contact: christina@theacexperience.com Based in Dubai ♥️ . pn:7186130
Collaboration metrics
Get a free trial to find more data on influencer audiences, performance, and collaborations.
MissouMakeup x BABYBOO FASHION
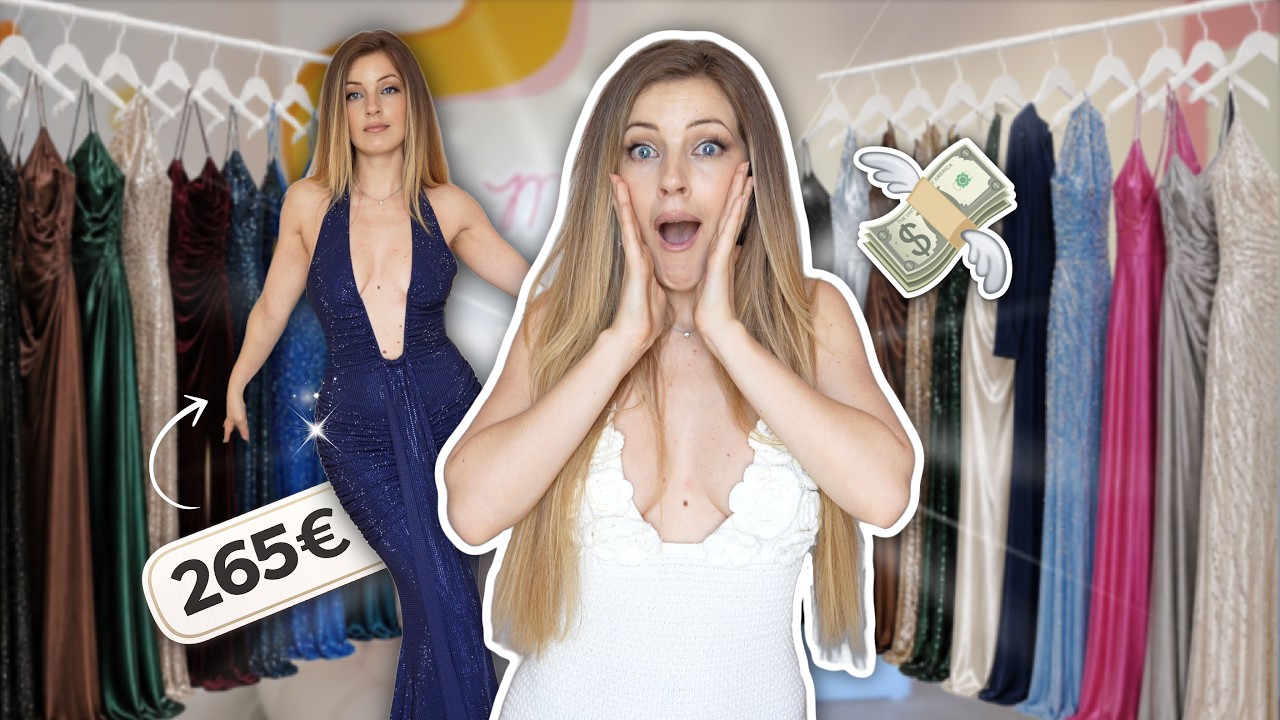
Influencer bio
Ici on parle de tout, mais surtout ON NE SE PREND PAS LA TÊTE ! Vidéos TEST, HAUL, MAKEUP, COIFFURES... Si tu cherches une fille simple, rigolote qui aime partager ce qu'elle aime sur Youtube, tu es tombé au bon endroit ;) Contact professionnel: missou.contact@gmail.com
Collaboration metrics
Get a free trial to find more data on influencer audiences, performance, and collaborations.
If you break this down further by content type on Instagram, this is what it looks like:
- Posts: 53.8%
- Reels: 46.2%
💡 Related resource: How To Find Instagram Influencers.
Influencer audience size breakdown (by views)
For their top social platform (Instagram), here is a breakdown of the type of influencers BABYBOO FASHION are collaborating with, by audience size.
Note: this breakdown is based on each influencer's average views (not follower/subscriber count), because views typically correlate more closely with influencer pricing and impact.
BABYBOO FASHION's influencers average views (Instagram)
Based on each influencer's average views per post
With 30.5% of partnerships featuring creators averaging 10K-50K views, BABYBOO FASHION's strategy suggests cost-efficiency and engagement-focused partnerships. The 1K-5K views segment is also prominent at 22.2%, indicating investment across adjacent tiers.
Here is an example of a sponsored collaboration with a larger-audience creator on Instagram (1.1M avg views/post):
unicewani x BABYBOO FASHION
![Instagram post by @unicewani for BABYBOO FASHION. Caption reads: [...] PT.1!!! Big thank you to: @inrama....](https://images.od.modash.io/319f4ac346a561d360960b8f2f5c5ee18c5f73f9)
Influencer bio
▪️📍Melb, Australia ▪️TikTok: unicewani (9M+) ▪️ 💌 management@unicewani.com
Collaboration metrics
Get a free trial to find more data on influencer audiences, performance, and collaborations.
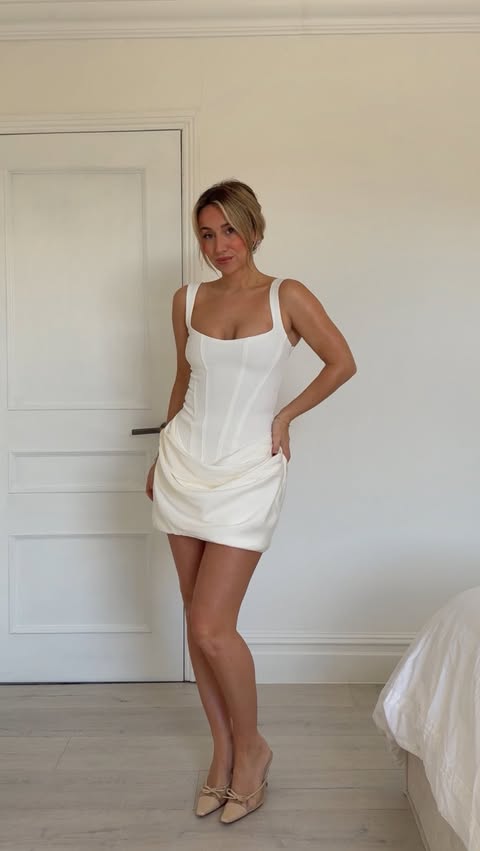
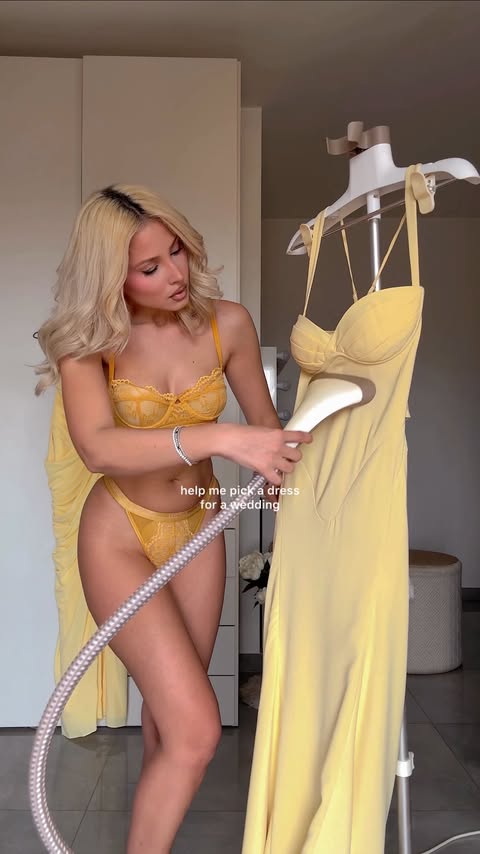
And here is another example with a smaller creator on Instagram (9.6k avg views/post):
emilycocklin x BABYBOO FASHION
Influencer bio
collabs: mollie.ward@flairmgmt.com outfit links ↓
Collaboration metrics
Get a free trial to find more data on influencer audiences, performance, and collaborations.
BABYBOO FASHION's repeat partnerships
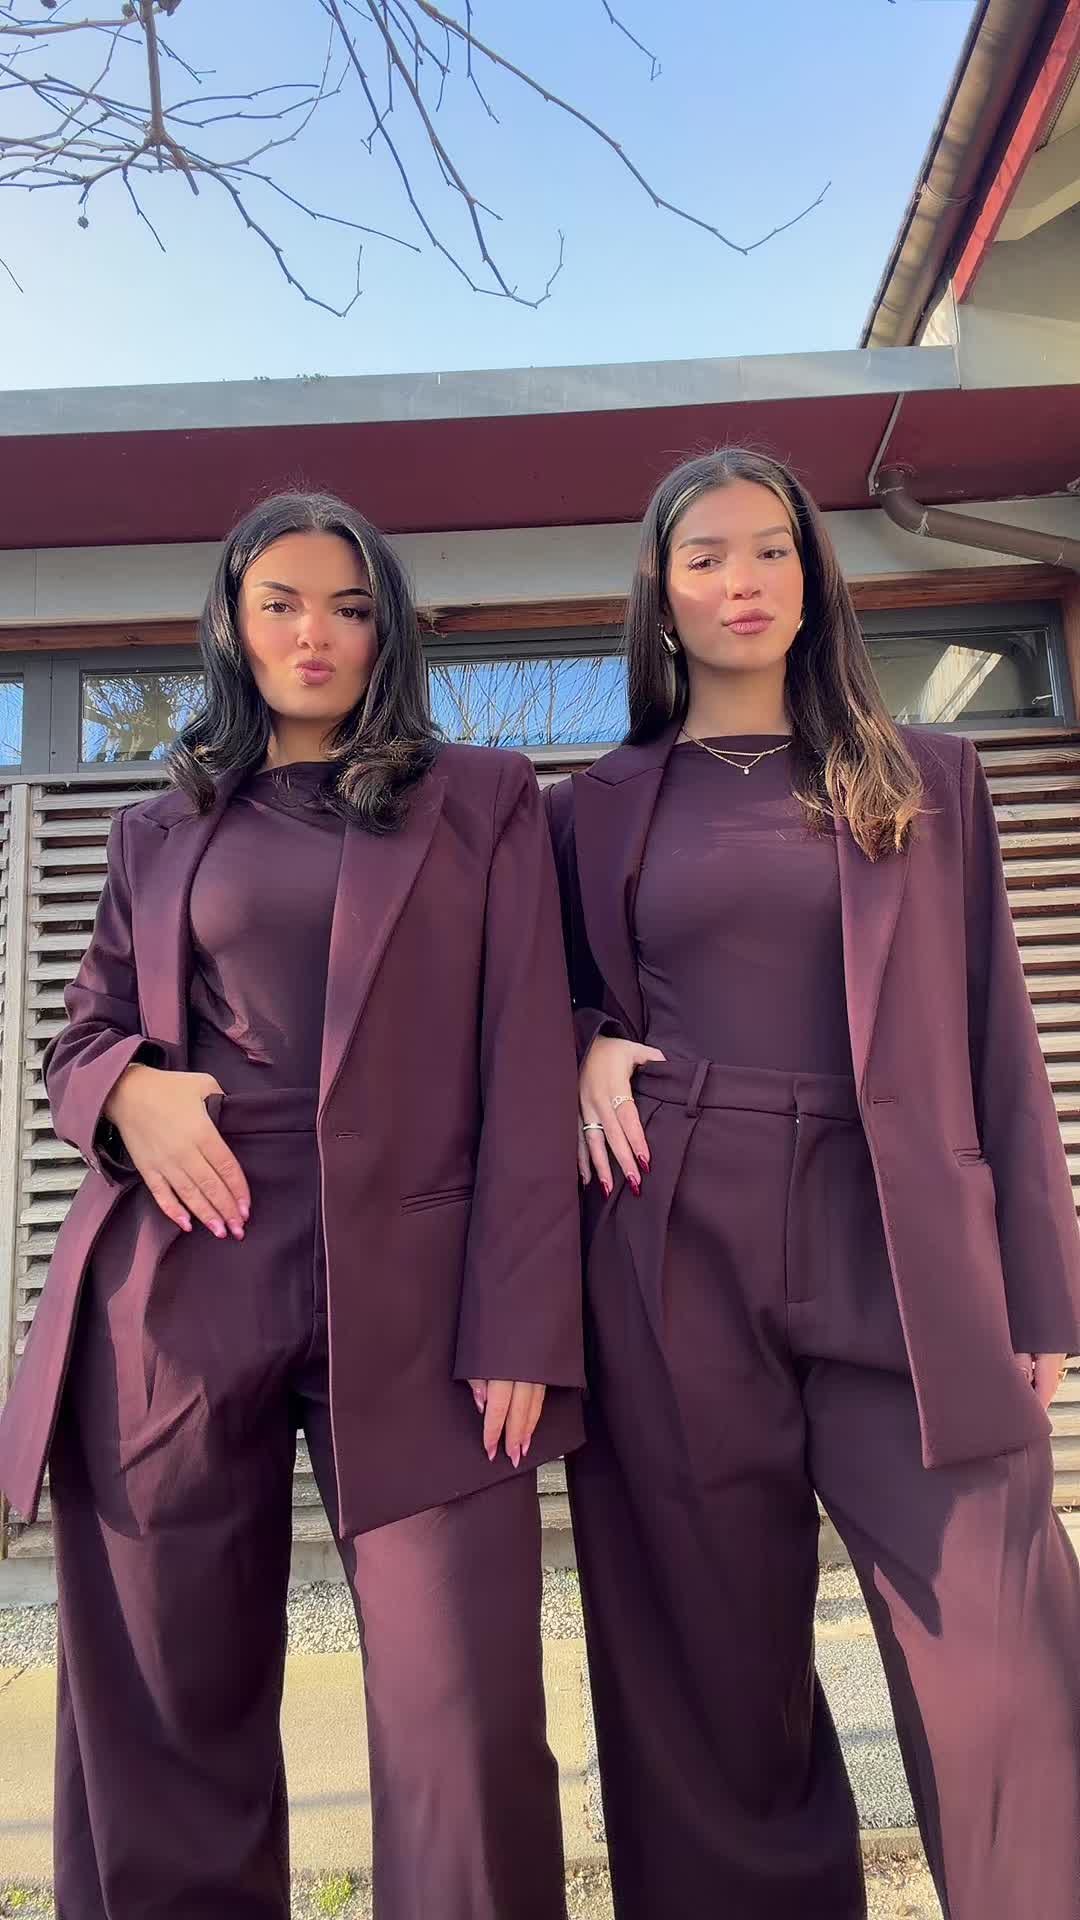
Out of 3.6k unique influencers in our dataset, 68 of them (2%) posted content for BABYBOO FASHION in 3 or more separate calendar months. The most consistent partner is @call.us.duo, who has collaborated across 12 months with 74 total posts.
Here are 3 examples of BABYBOO FASHION's repeat influencer partnerships, with links to the sponsored content.
call.us.duo x BABYBOO FASHION
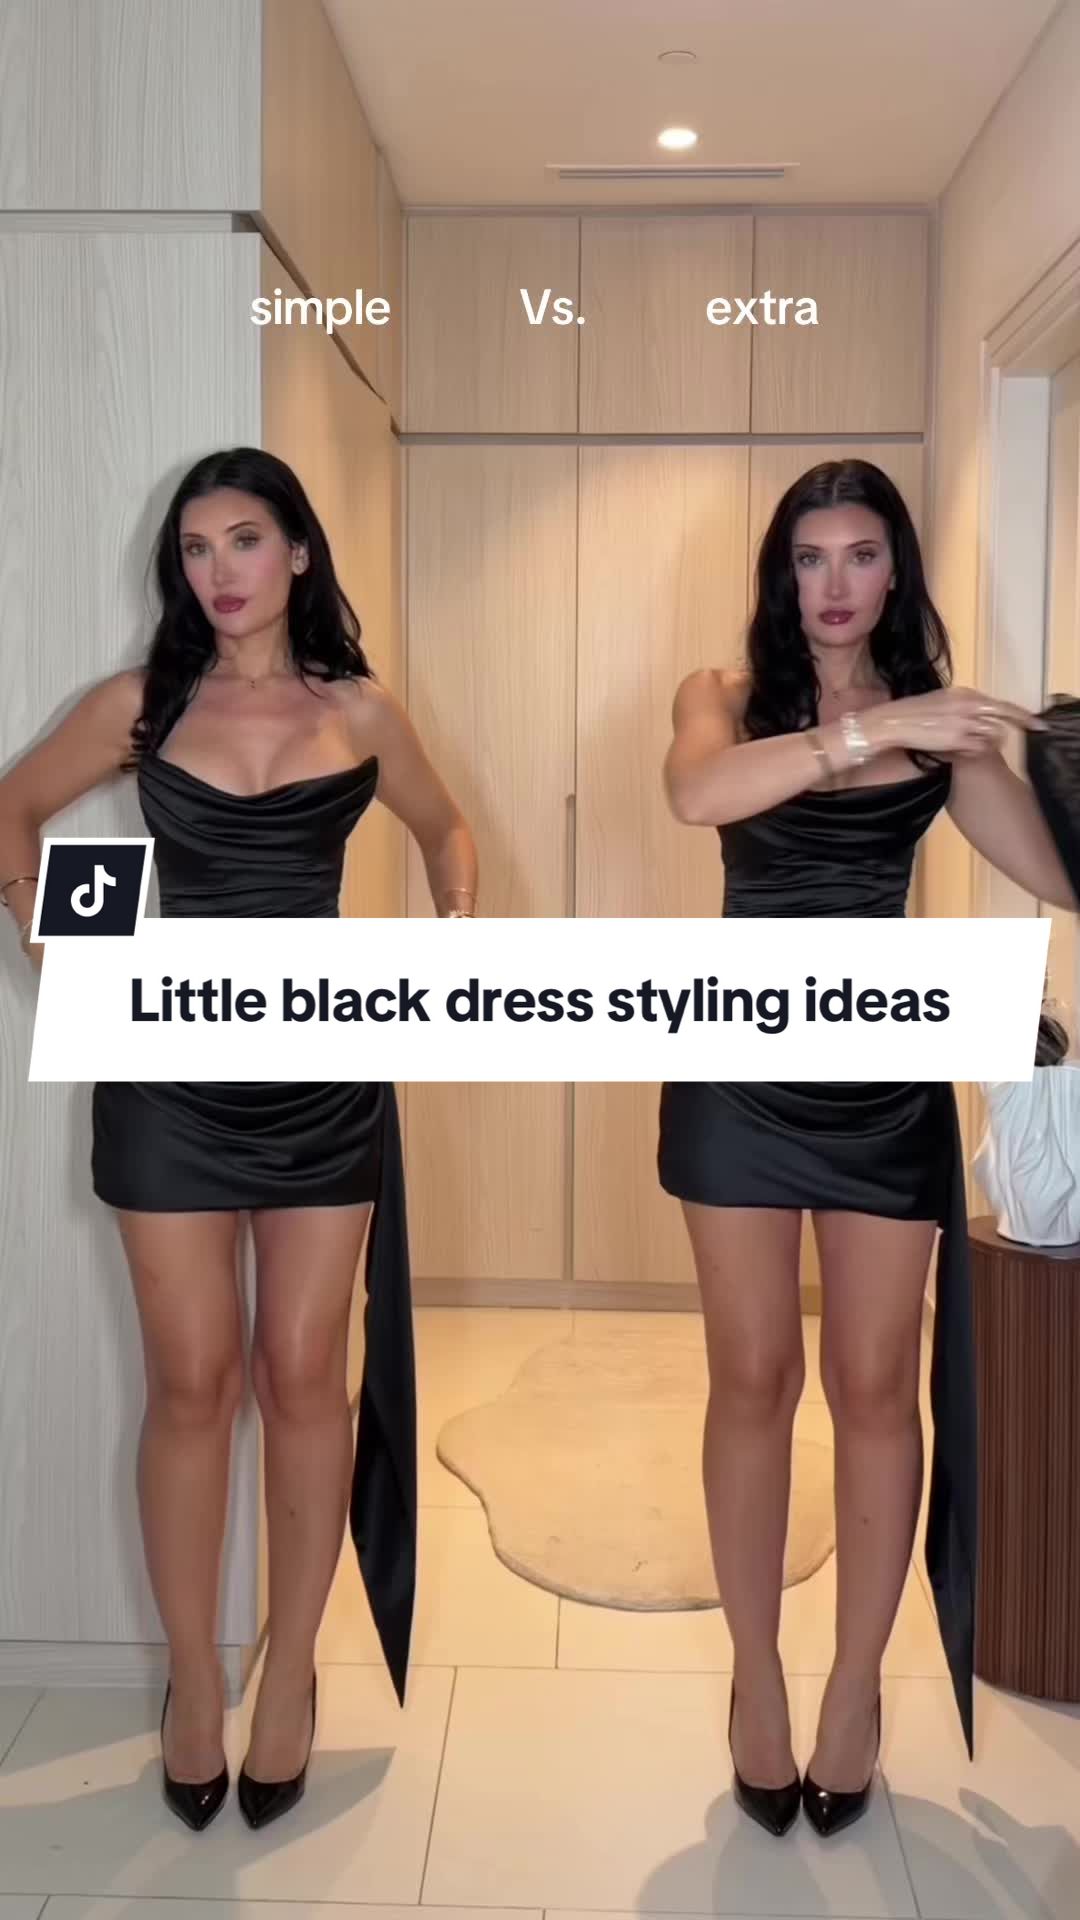
sosazerafa x BABYBOO FASHION
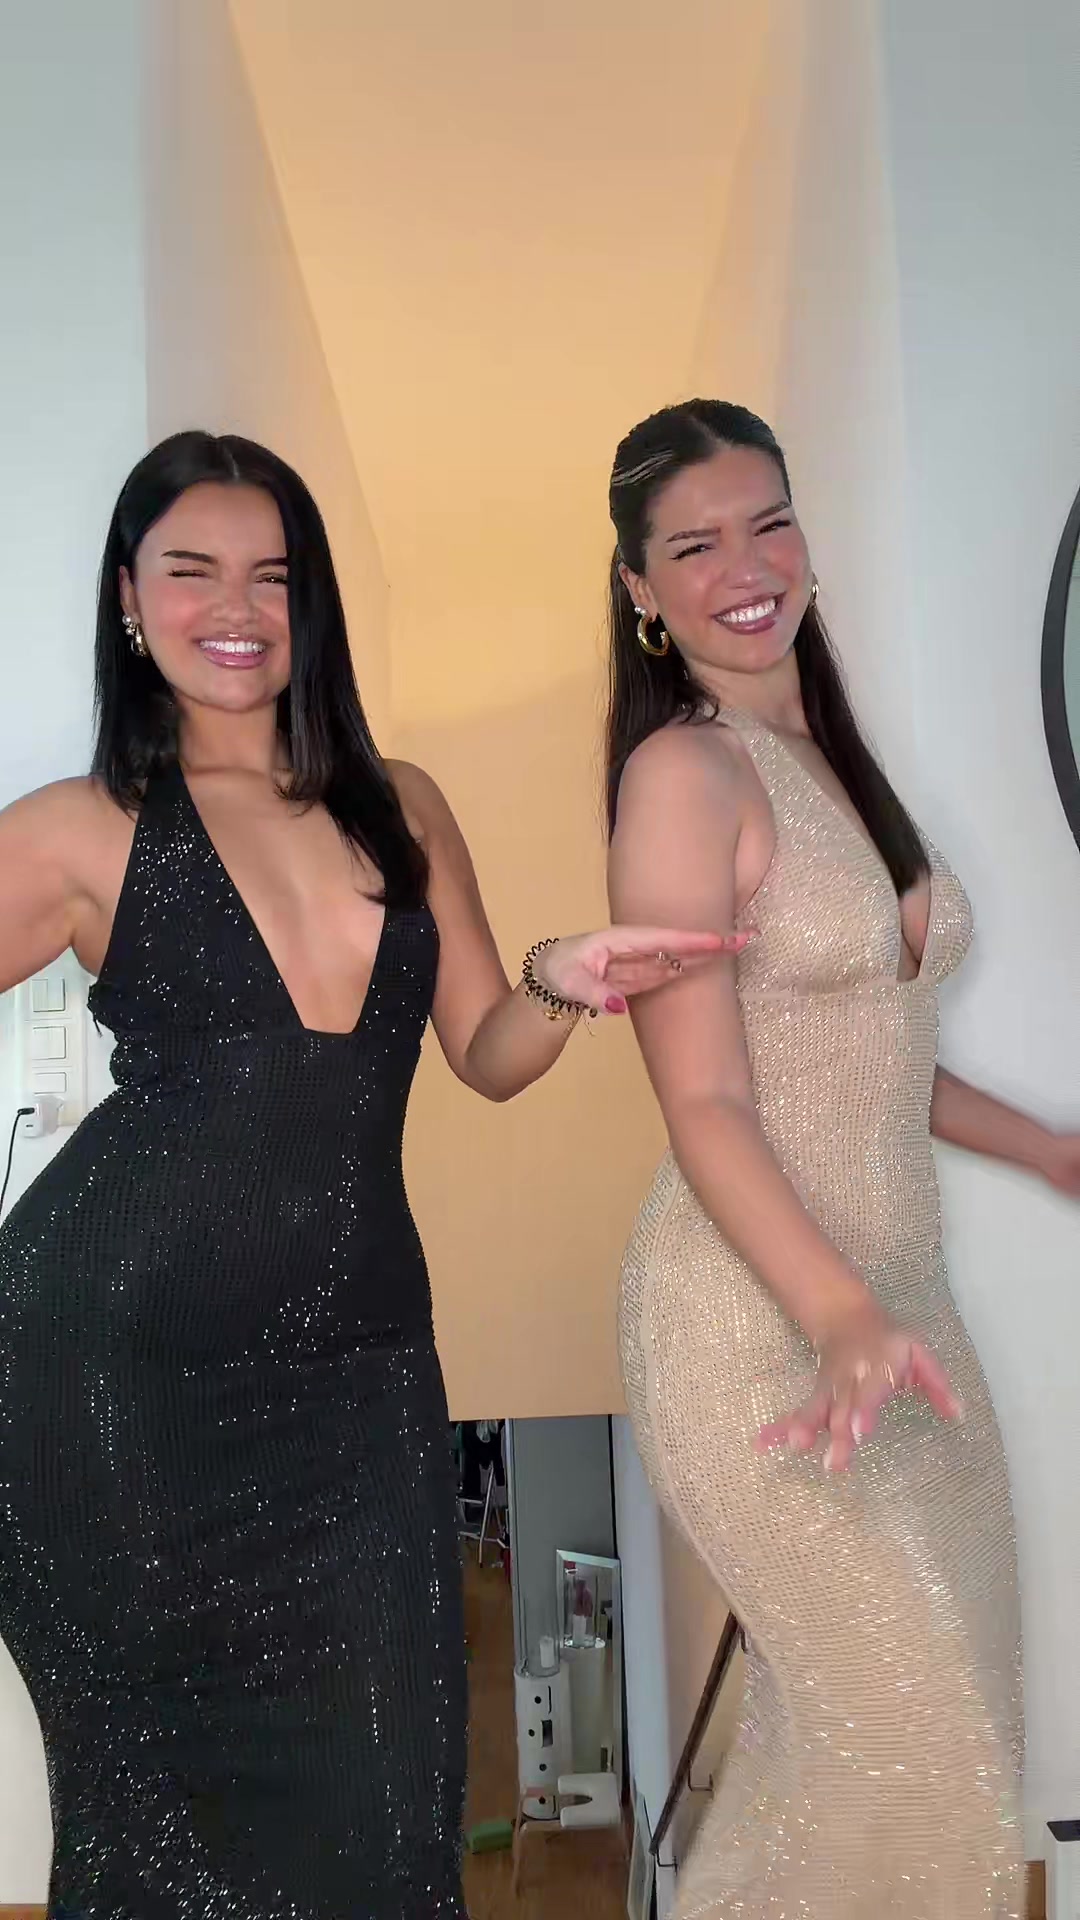
sevaoli x BABYBOO FASHION
![Instagram post by @sevaoli for BABYBOO FASHION. Caption reads: [...] done right. 🤍 Wearing: @babyboofashion....](https://images.od.modash.io/7468c46406e15cd70815ada3b46c9a0f93593686)
![Instagram post by @sevaoli for BABYBOO FASHION. Caption reads: [...] every time. 🫦🥀 Dress: @babyboofashion....](https://images.od.modash.io/b66d2a411b981c1de451b754d311cb21da02267f)
![Instagram post by @sevaoli for BABYBOO FASHION. Caption reads: [...] Summer looks 🍋 Dresses: @babyboofashion....](https://images.od.modash.io/4f09a4ddce81388790177b80d0361635eb4423cb)
💡 Related resource: Long-Term Influencer Partnerships: Pros, Cons & How The Pros Manage Them.
Geographical breakdown
In our dataset, United States is where BABYBOO FASHION had the most influencer activity. 47.7% of their live influencer content in the last 12 months was posted by American influencers.
Based on the percentage of influencer content per market, other important markets include:
- Australia (8.9%)
- United Kingdom (8.7%)
- Brazil (4.2%)
BABYBOO FASHION's influencer activity by market
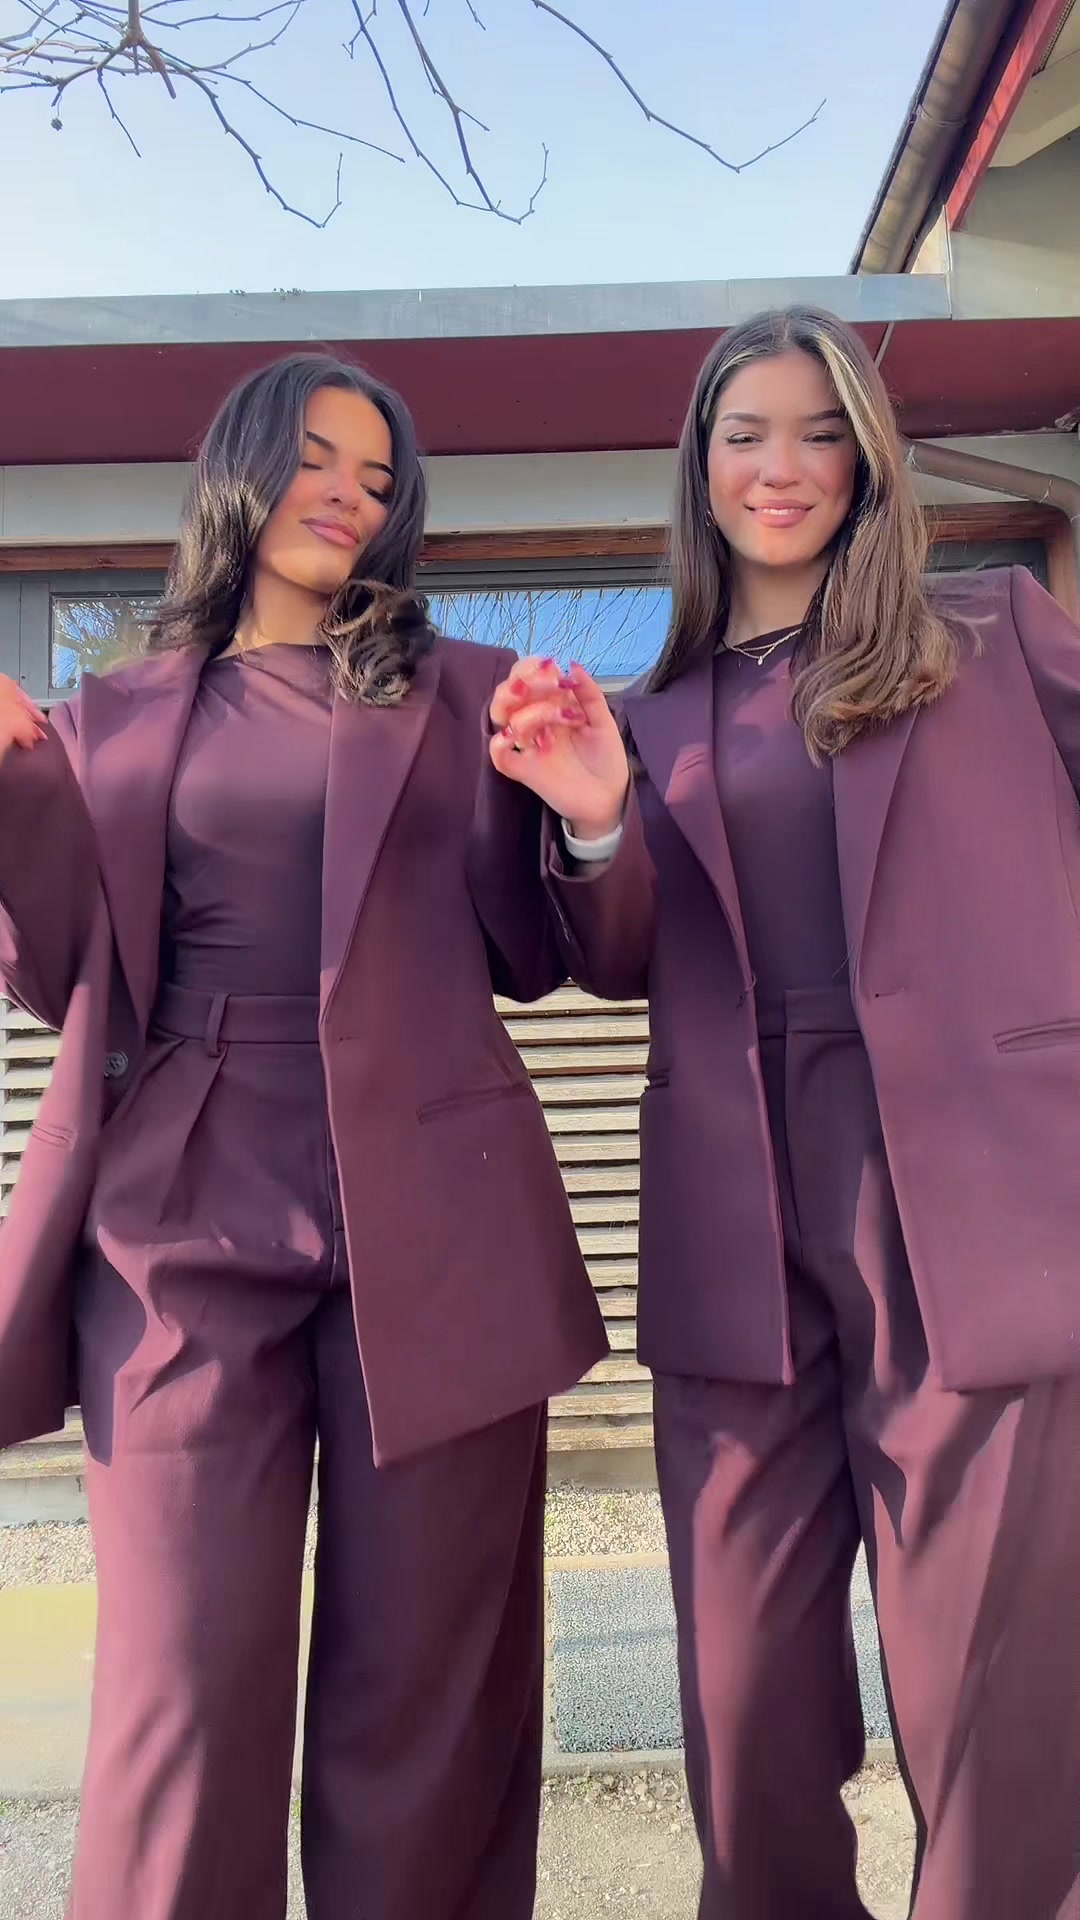
Here is another example of BABYBOO FASHION collaborating with an influencer in Italy.
kseniaprix x BABYBOO FASHION
![Instagram post by @kseniaprix for BABYBOO FASHION. Caption reads: [...] be always my best-dressed date 💛💛....](https://images.od.modash.io/eef36f5063fed69b82b2ec461159a9aa3cc11a37)
BABYBOO FASHION's influencer activity vs. related brands
BABYBOO FASHION competes directly with OH POLLY and Meshki in going-out and occasionwear, targeting similar social-first shoppers through creator try-ons, event dressing edits, and code-driven conversions.
Total influencer content
BABYBOO FASHION vs. related brands influencer activity
Total sponsored posts tracked (last 12 months)
Meshki leads with 11.8k sponsored posts, notably outpacing OH POLLY (10.2k posts) and BABYBOO FASHION (6.3k posts). Across all three brands, the average volume is 9.4k posts, indicating mature, scaled influencer programs.
By social platform
BABYBOO FASHION vs. related brands influencer activity (by social platform)
Sponsored posts by platform
Among these brands, Meshki leads on Instagram and OH POLLY leads on TikTok and YouTube. The gap is most notable on Instagram, with Meshki at 7.8k, OH POLLY at 6k, BABYBOO FASHION at 4.4k posts. TikTok shows BABYBOO FASHION with about half as many posts as OH POLLY and Meshki.
By geographical market
BABYBOO FASHION vs. related brands influencer activity (by country)
Estimated sponsored posts in BABYBOO FASHION's top markets
Meshki has the highest estimated sponsored-post volume in United States (5.2k posts, 44.1%), Australia (1k posts, 8.5%), while OH POLLY has the highest estimated sponsored-post volume in United Kingdom (2.1k posts, 20.7%), Brazil (406 posts, 4%). Looking at United States specifically, the split is Meshki at 5.2k posts (44.1%), OH POLLY at 4.2k posts (41.3%), BABYBOO FASHION at 3k posts (47.7%).
Read more influencer strategy breakdowns
Looking for more like this? Here are 5 similar influencer marketing strategy breakdowns for other brands:
- OH POLLY's Influencer Marketing Strategy
- Meshki's Influencer Marketing Strategy
- Steve Madden's Influencer Marketing Strategy
- Brooklinen's Influencer Marketing Strategy
- Poppi's Influencer Marketing Strategy
Or, if you want to access data like this for your own software or processes, take a look at Modash's API products:
Frequently asked questions
Scaling your influencer program?
When you outgrow your mishmash of spreadsheets & free tools, try Modash. Find & email influencers, track campaigns, ship products & more - all in one place.