Beginning Boutique Influencer Marketing Strategy
(2026 Data & Insights)
We analyzed 3.8k pieces of influencer content sponsored by Beginning Boutique over the last 12 months.
This report breaks down where & how Beginning Boutique invests in influencer marketing, which social platforms they prioritize, top geographical markets, and more.
The data in this report comes from Modash's Brand Collaborations API.
P.S. for a simple list of influencers who have collaborated with Beginning Boutique, see here: Beginning Boutique influencers.
Influencer activity throughout the year
Beginning Boutique's influencer campaigns are active year-round with notable month-to-month fluctuation. The chart below shows month-by-month data for total sponsored posts tracked.
Beginning Boutique's influencer activity by month
Number of sponsored posts
Beginning Boutique's influencer output appears relatively consistent throughout the year, averaging about 314 sponsored posts per month. May recorded the highest volume at 417 posts (33% above average), while October was the quietest at 232 posts.
Social platforms breakdown
In our dataset (which only includes Instagram, YouTube, and TikTok), this is how the volume of Beginning Boutique's sponsored influencer collaborations break down by social platform:
- TikTok: 2.0k posts (53.1%)
- Instagram: 1.8k posts (46.9%)
- YouTube: 2 posts (0.1%)
Beginning Boutique's influencer activity by platform
Share of sponsored content by social network
TikTok influencer marketing is a clear focus for Beginning Boutique.
Here are 3 examples of Beginning Boutique's recent sponsored collaborations (one each for Instagram, TikTok, YouTube).
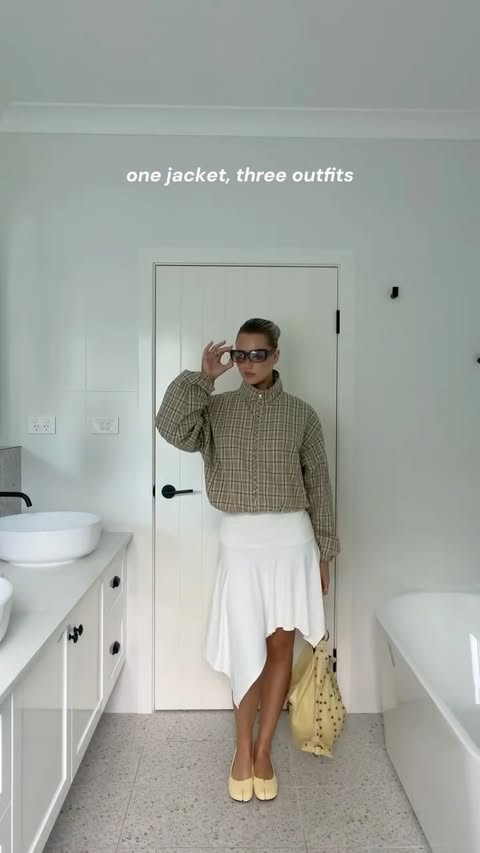
sophadophaa_ x Beginning Boutique
Influencer bio
It’s Sophia not Sophie Founder @allformimi 📧 management@sophadopha.com
Collaboration metrics
Get a free trial to find more data on influencer audiences, performance, and collaborations.
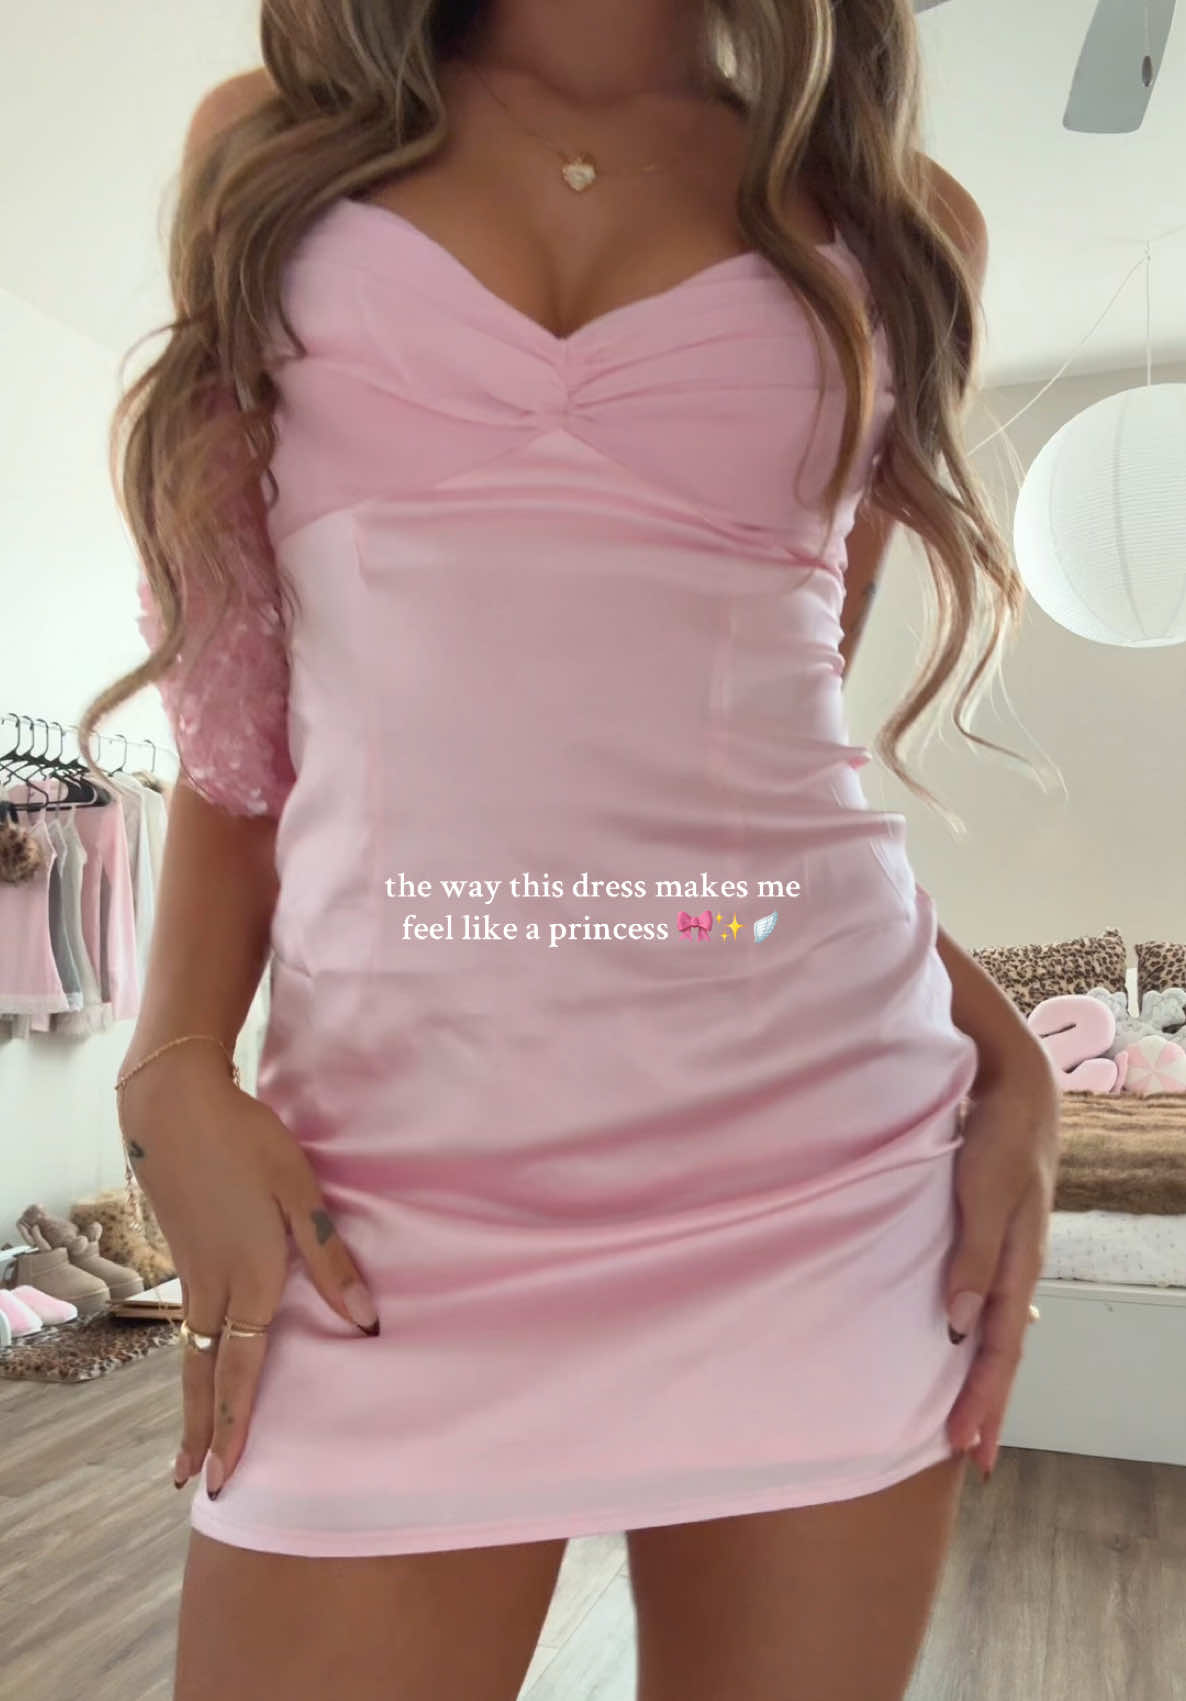
embreighcourtlyn x Beginning Boutique
![TikTok post by @embreighcourtlyn for Beginning Boutique. Caption reads: [...] you're loving my collection with @Beginning....](https://images.od.modash.io/94cf4bc4abccef79a78d040427ff050b05f4a16e)
Influencer bio
💌-Team@embreighcourtlyn.co Insta-embreighcourtlyn Parent managed
Collaboration metrics
Get a free trial to find more data on influencer audiences, performance, and collaborations.
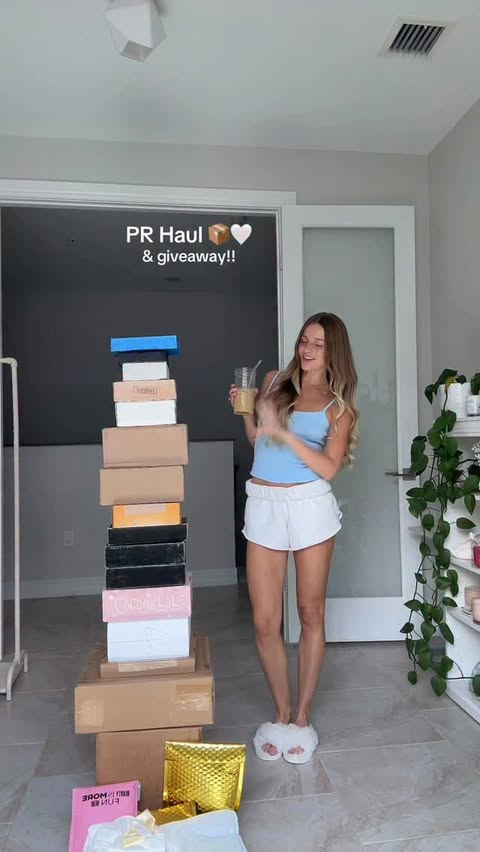
JuliaBedell x Beginning Boutique
Influencer bio
Hey guys my name is Julia Bedell and I’m from Massachusetts. You can just call me Jules! I’m a 23 year old graduate from Brown University, former gymnast, and current YouTuber. This channel is dedicated to documenting my life, sharing my passions, and having a good time. Spread some love & positivity and come along for the ride if you want! 🌱 All my 🔗: https://linktr.ee/JuliaKatherineBedell Instagram: _JuliaBedell TikTok: _JuliaBedell Podcast: Bee Here Today by Julia Bedell Snapchat: Julia_Bedell Depop: JuliaBedell Pinterest: JuliaaBedell Business Email: JuliaKatherineBusiness@gmail.com FAQ: Birthday: October 17th, 2002 Equipment: Canon t7i (sit down videos), Sony ZV-1 (vlogs), Canon G7x (photos) Editing software: Final Cut Pro College: Brown University Major: Business Economics & Entrepreneurship
Collaboration metrics
Get a free trial to find more data on influencer audiences, performance, and collaborations.
If you break this down further by content type on TikTok, this is what it looks like:
- Videos: 98%
- Carousels: 2%
💡 Related resource: How To Find TikTok Influencers.
Influencer audience size breakdown (by views)
For their top social platform (TikTok), here is a breakdown of the type of influencers Beginning Boutique are collaborating with, by audience size.
Note: this breakdown is based on each influencer's average views (not follower/subscriber count), because views typically correlate more closely with influencer pricing and impact.
Beginning Boutique's influencers average views (TikTok)
Based on each influencer's average views per post
Beginning Boutique's creator selection appears relatively diversified across size tiers, with no single segment dominating. This suggests a balanced approach to influencer partnerships, spreading investment across different audience sizes.
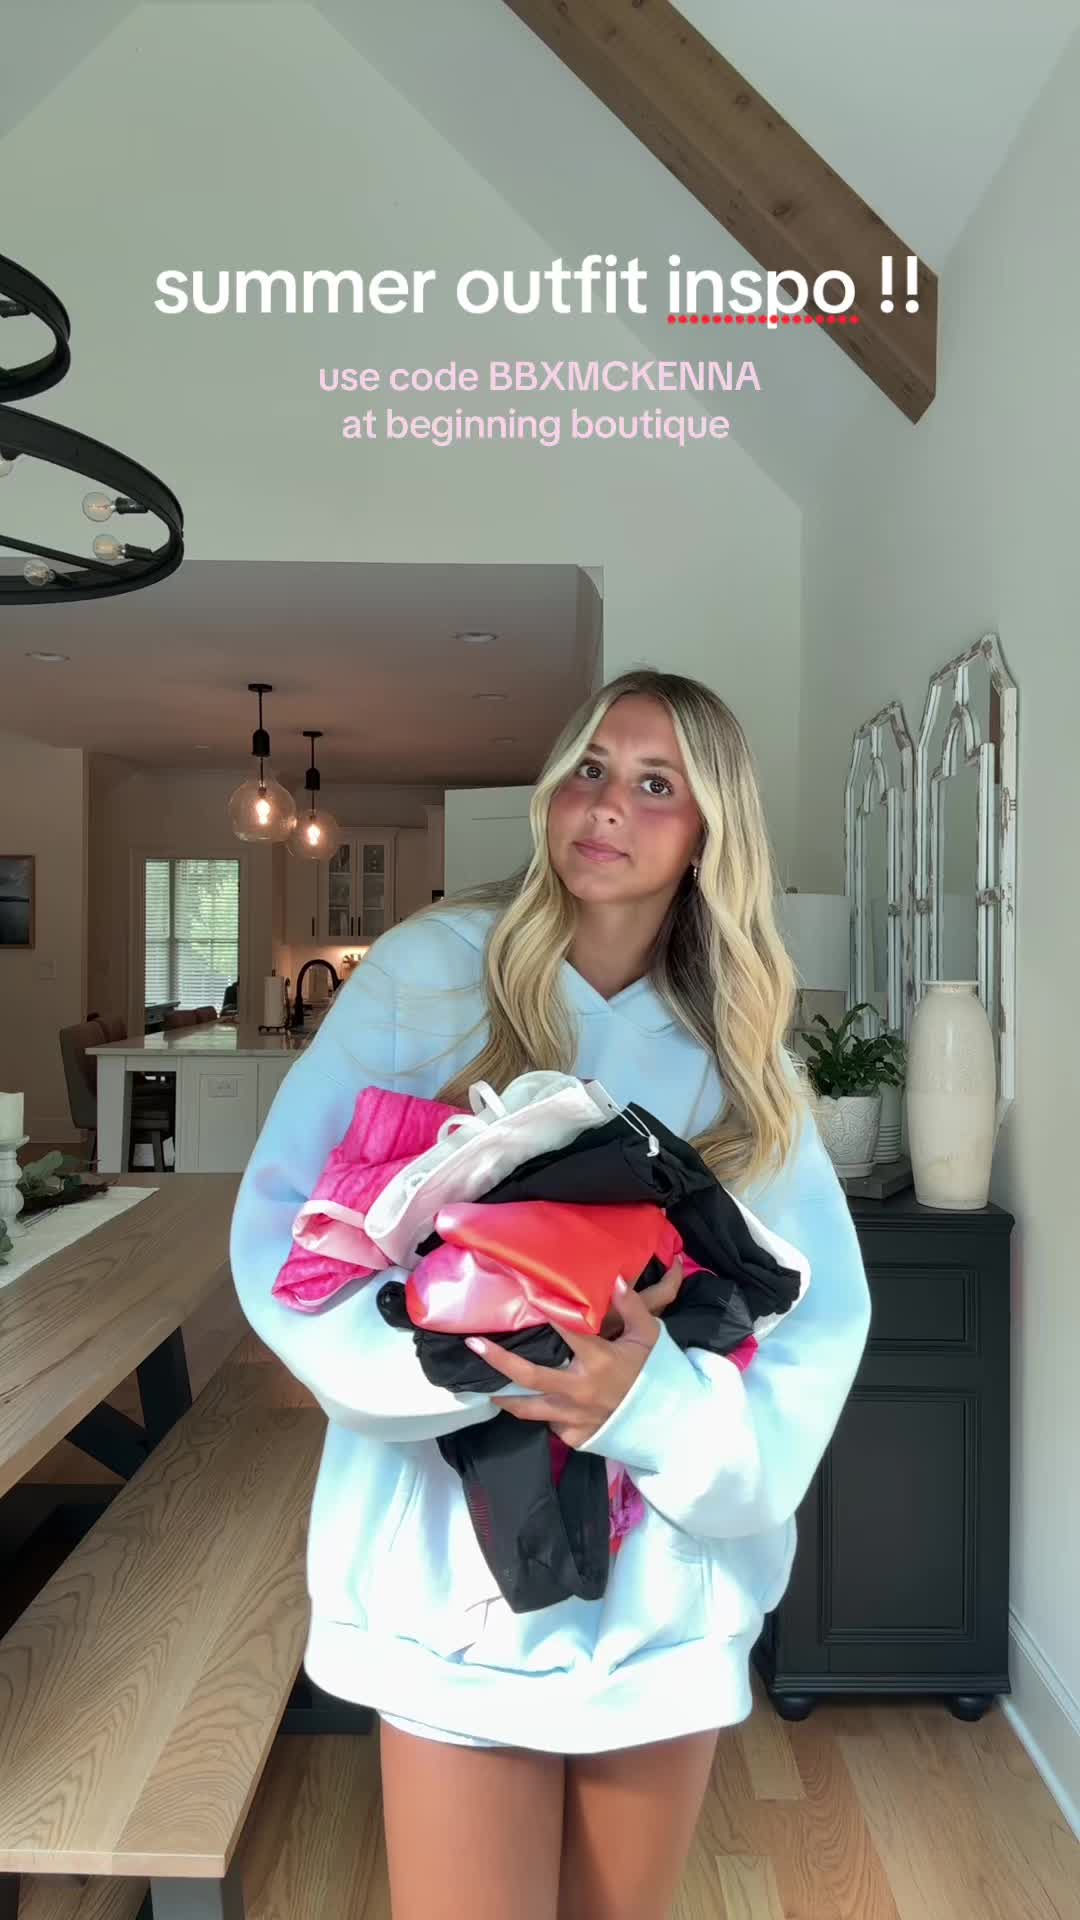
Here is an example of a sponsored collaboration with a larger-audience creator on TikTok (511.5k avg views/post):
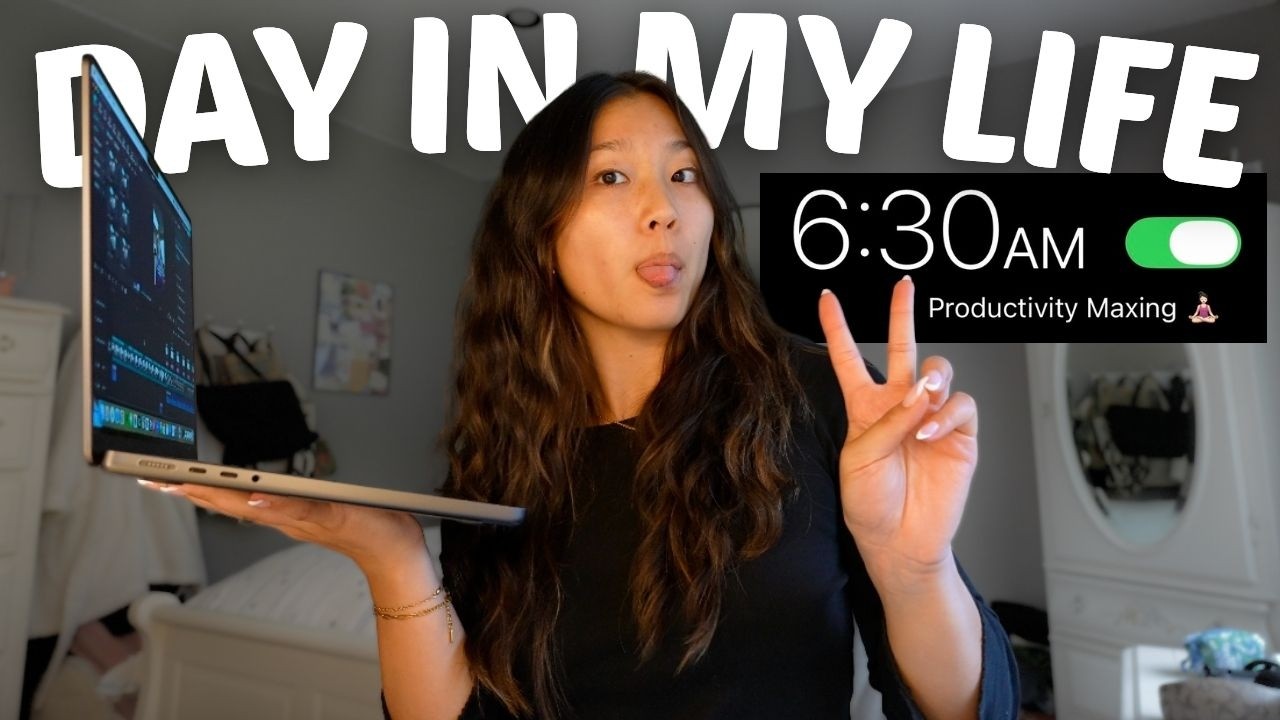
mckenna.west x Beginning Boutique
Influencer bio
insta- mckenna.west 💌 mckenna@8media.co
Collaboration metrics
Get a free trial to find more data on influencer audiences, performance, and collaborations.
And here is another example with a smaller creator on TikTok (10.0k avg views/post):
tatymhawkins x Beginning Boutique
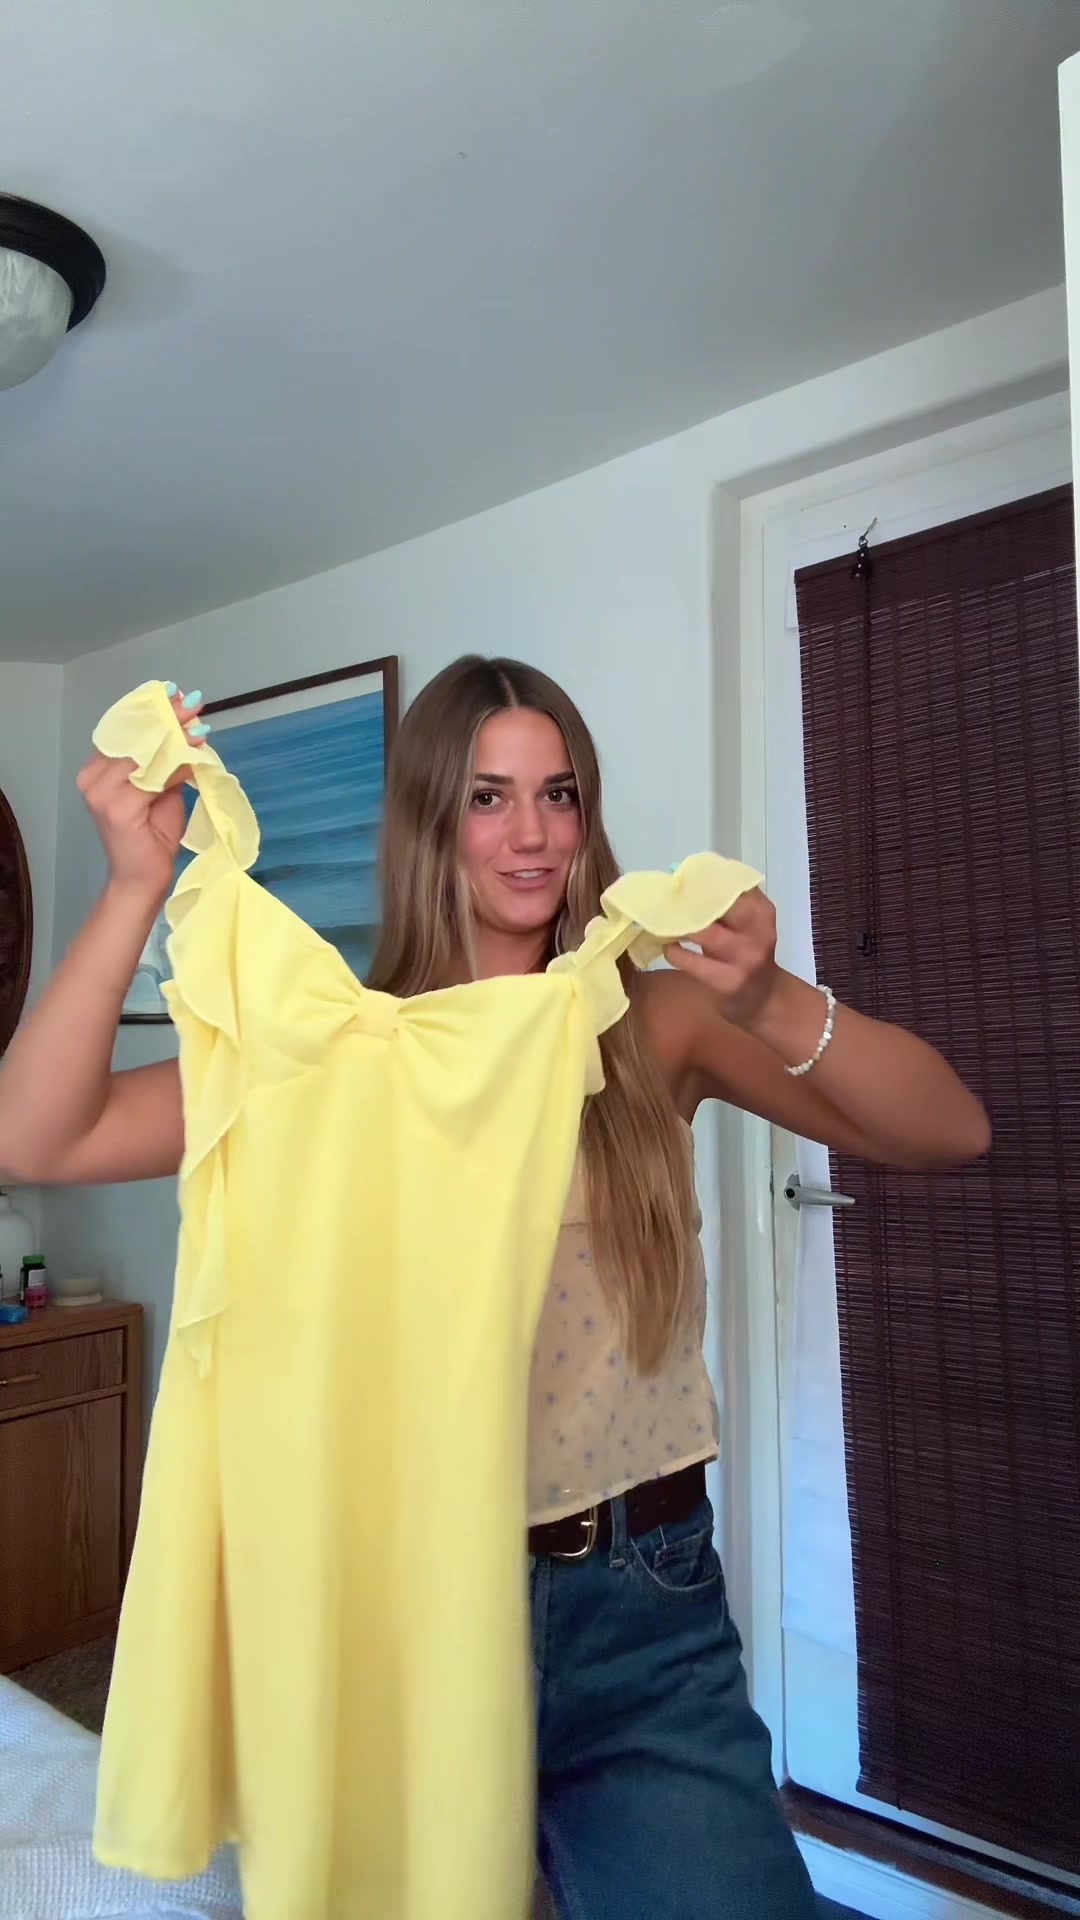
Influencer bio
👙✨ @Beach Bronc az & san deigo I like clothes & bikinis 💌olivia.kneeland@grail-talent.com
Collaboration metrics
Get a free trial to find more data on influencer audiences, performance, and collaborations.
Beginning Boutique's repeat partnerships
Out of 1.7k unique influencers in our dataset, 83 of them (5%) posted content for Beginning Boutique in 3 or more separate calendar months. The most consistent partner is @sophadophaa_, who has collaborated across 9 months with 11 total posts.
Here are 3 examples of Beginning Boutique's repeat influencer partnerships, with links to the sponsored content.
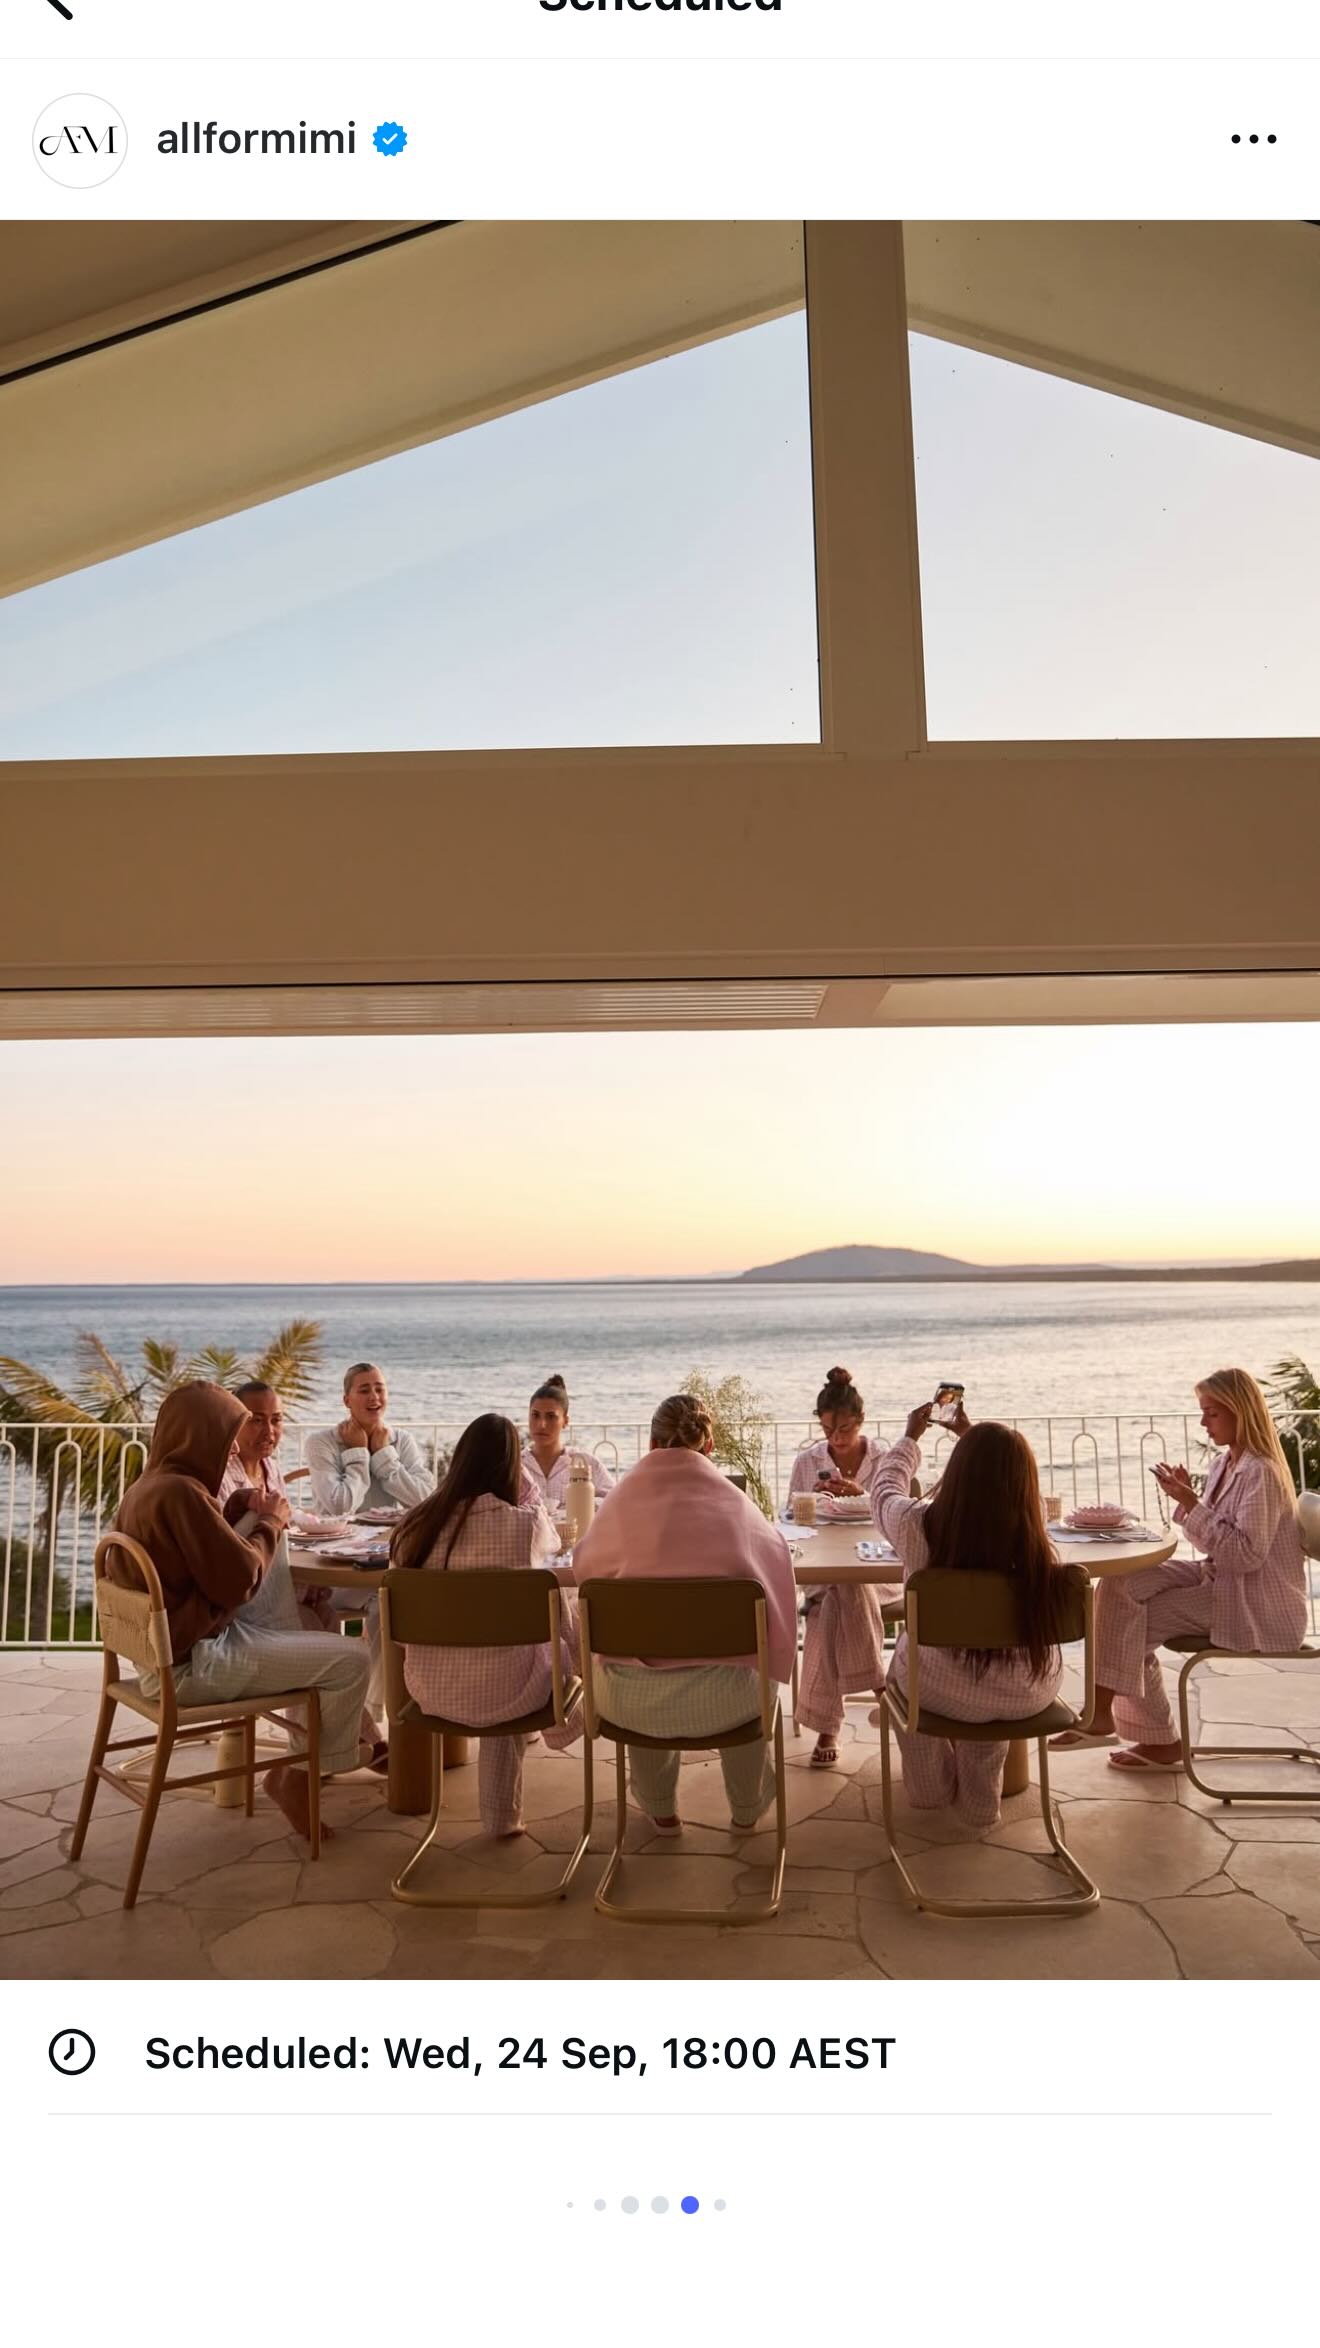
sophadophaa_ x Beginning Boutique
![Instagram post by @sophadophaa_ for Beginning Boutique. Caption reads: [...] lunch dress!! All from @beginningboutique....](https://images.od.modash.io/a8bfd3e058e2e946a0744aca07c8c29b5d429dba)
sadiebaby08 x Beginning Boutique
![TikTok post by @sadiebaby08 for Beginning Boutique. Caption reads: @Edikted @Beginning Boutique @Princess Polly [...].](https://images.od.modash.io/baff50eebfcf2b45a34ed058993214b47cf8dc66)
![TikTok post by @sadiebaby08 for Beginning Boutique. Caption reads: [...] in every color omg!! 💗 @Beginning Boutique....](https://images.od.modash.io/6da5a88fb89c0a7e5c727aa7902cd7720980be53)
caitlinelizaxo x Beginning Boutique
![Instagram post by @caitlinelizaxo for Beginning Boutique. Caption reads: [...] 😍 Wearing all @beginningboutique 🩷.](https://images.od.modash.io/88b349901233198d6ae76a5b0b68d6457865ad29)
![Instagram post by @caitlinelizaxo for Beginning Boutique. Caption reads: [...] at the end!! THANK YOU @beginningboutique —....](https://images.od.modash.io/0936563193f9981cb3aa07730662ddfb616d53db)
💡 Related resource: Long-Term Influencer Partnerships: Pros, Cons & How The Pros Manage Them.
Geographical breakdown
In our dataset, United States is where Beginning Boutique had the most influencer activity. 55.8% of their live influencer content in the last 12 months was posted by American influencers.
Based on the percentage of influencer content per market, other important markets include:
- Australia (22.5%)
- United Kingdom (5.2%)
- Brazil (2.7%)
Beginning Boutique's influencer activity by market
Here is another example of Beginning Boutique collaborating with an influencer in United States.
therealempisle x Beginning Boutique
![TikTok post by @therealempisle for Beginning Boutique. Caption reads: [...] just restocked my collection with @Beginning....](https://images.od.modash.io/78285c3508715b0be9031fa637a17d0ed7926630)
Beginning Boutique's influencer activity vs. related brands
Beginning Boutique competes directly with Showpo and Hello Molly in the online women’s boutique space, sharing similar audiences for going-out looks, event outfits, and influencer-led try-on hauls.
Total influencer content
Beginning Boutique vs. related brands influencer activity
Total sponsored posts tracked (last 12 months)
Beginning Boutique leads with 3.8k sponsored posts, notably outpacing Showpo (2.9k posts) and Hello Molly (1.7k posts). Across all three brands, the average volume is 2.8k posts, indicating mature, scaled influencer programs.
By social platform
Beginning Boutique vs. related brands influencer activity (by social platform)
Sponsored posts by platform
Beginning Boutique leads on TikTok and YouTube, while Showpo leads on Instagram. The gap is most notable on TikTok, with Beginning Boutique at 2k, Showpo at 1.1k, Hello Molly at 818 posts. Beginning Boutique has notably more TikTok posts than Showpo and Hello Molly.
By geographical market
Beginning Boutique vs. related brands influencer activity (by country)
Estimated sponsored posts in Beginning Boutique's top markets
Beginning Boutique has the highest estimated sponsored-post volume in United States (2.1k posts, 55.8%), Australia (853 posts, 22.5%), United Kingdom (197 posts, 5.2%). Looking at United States specifically, the split is Beginning Boutique at 2.1k posts (55.8%), Showpo at 1.4k posts (48.8%), Hello Molly at 1.1k posts (63.8%).
Read more influencer strategy breakdowns
Looking for more like this? Here are 5 similar influencer marketing strategy breakdowns for other brands:
- Showpo's Influencer Marketing Strategy
- Hello Molly's Influencer Marketing Strategy
- G FUEL's Influencer Marketing Strategy
- BURGA's Influencer Marketing Strategy
- Owala's Influencer Marketing Strategy
Or, if you want to access data like this for your own software or processes, take a look at Modash's API products:
Frequently asked questions
Scaling your influencer program?
When you outgrow your mishmash of spreadsheets & free tools, try Modash. Find & email influencers, track campaigns, ship products & more - all in one place.