Bright Swimwear Influencer Marketing Strategy
(2026 Data & Insights)
We analyzed 1.6k pieces of influencer content sponsored by Bright Swimwear over the last 12 months.
This report breaks down where & how Bright Swimwear invests in influencer marketing, which social platforms they prioritize, top geographical markets, and more.
The data in this report comes from Modash's Brand Collaborations API.
P.S. for a simple list of influencers who have collaborated with Bright Swimwear, see here: Bright Swimwear influencers.
Influencer activity throughout the year
Bright Swimwear's influencer campaigns are active year-round with notable month-to-month fluctuation. The chart below shows month-by-month data for total sponsored posts tracked.
Bright Swimwear's influencer activity by month
Number of sponsored posts
Bright Swimwear's sponsored post volume peaks in November with 205 posts, 54% higher than the monthly average of 133. June recorded the lowest activity at 45 posts, 66% below average.
Social platforms breakdown
In our dataset (which only includes Instagram, YouTube, and TikTok), this is how the volume of Bright Swimwear's sponsored influencer collaborations break down by social platform:
- Instagram: 1.2k posts (72.9%)
- TikTok: 432 posts (27%)
- YouTube: 1 posts (0.1%)
Bright Swimwear's influencer activity by platform
Share of sponsored content by social network
Instagram influencer marketing is a clear focus for Bright Swimwear.
Here are 2 examples of Bright Swimwear's recent sponsored collaborations (one each for Instagram, TikTok).
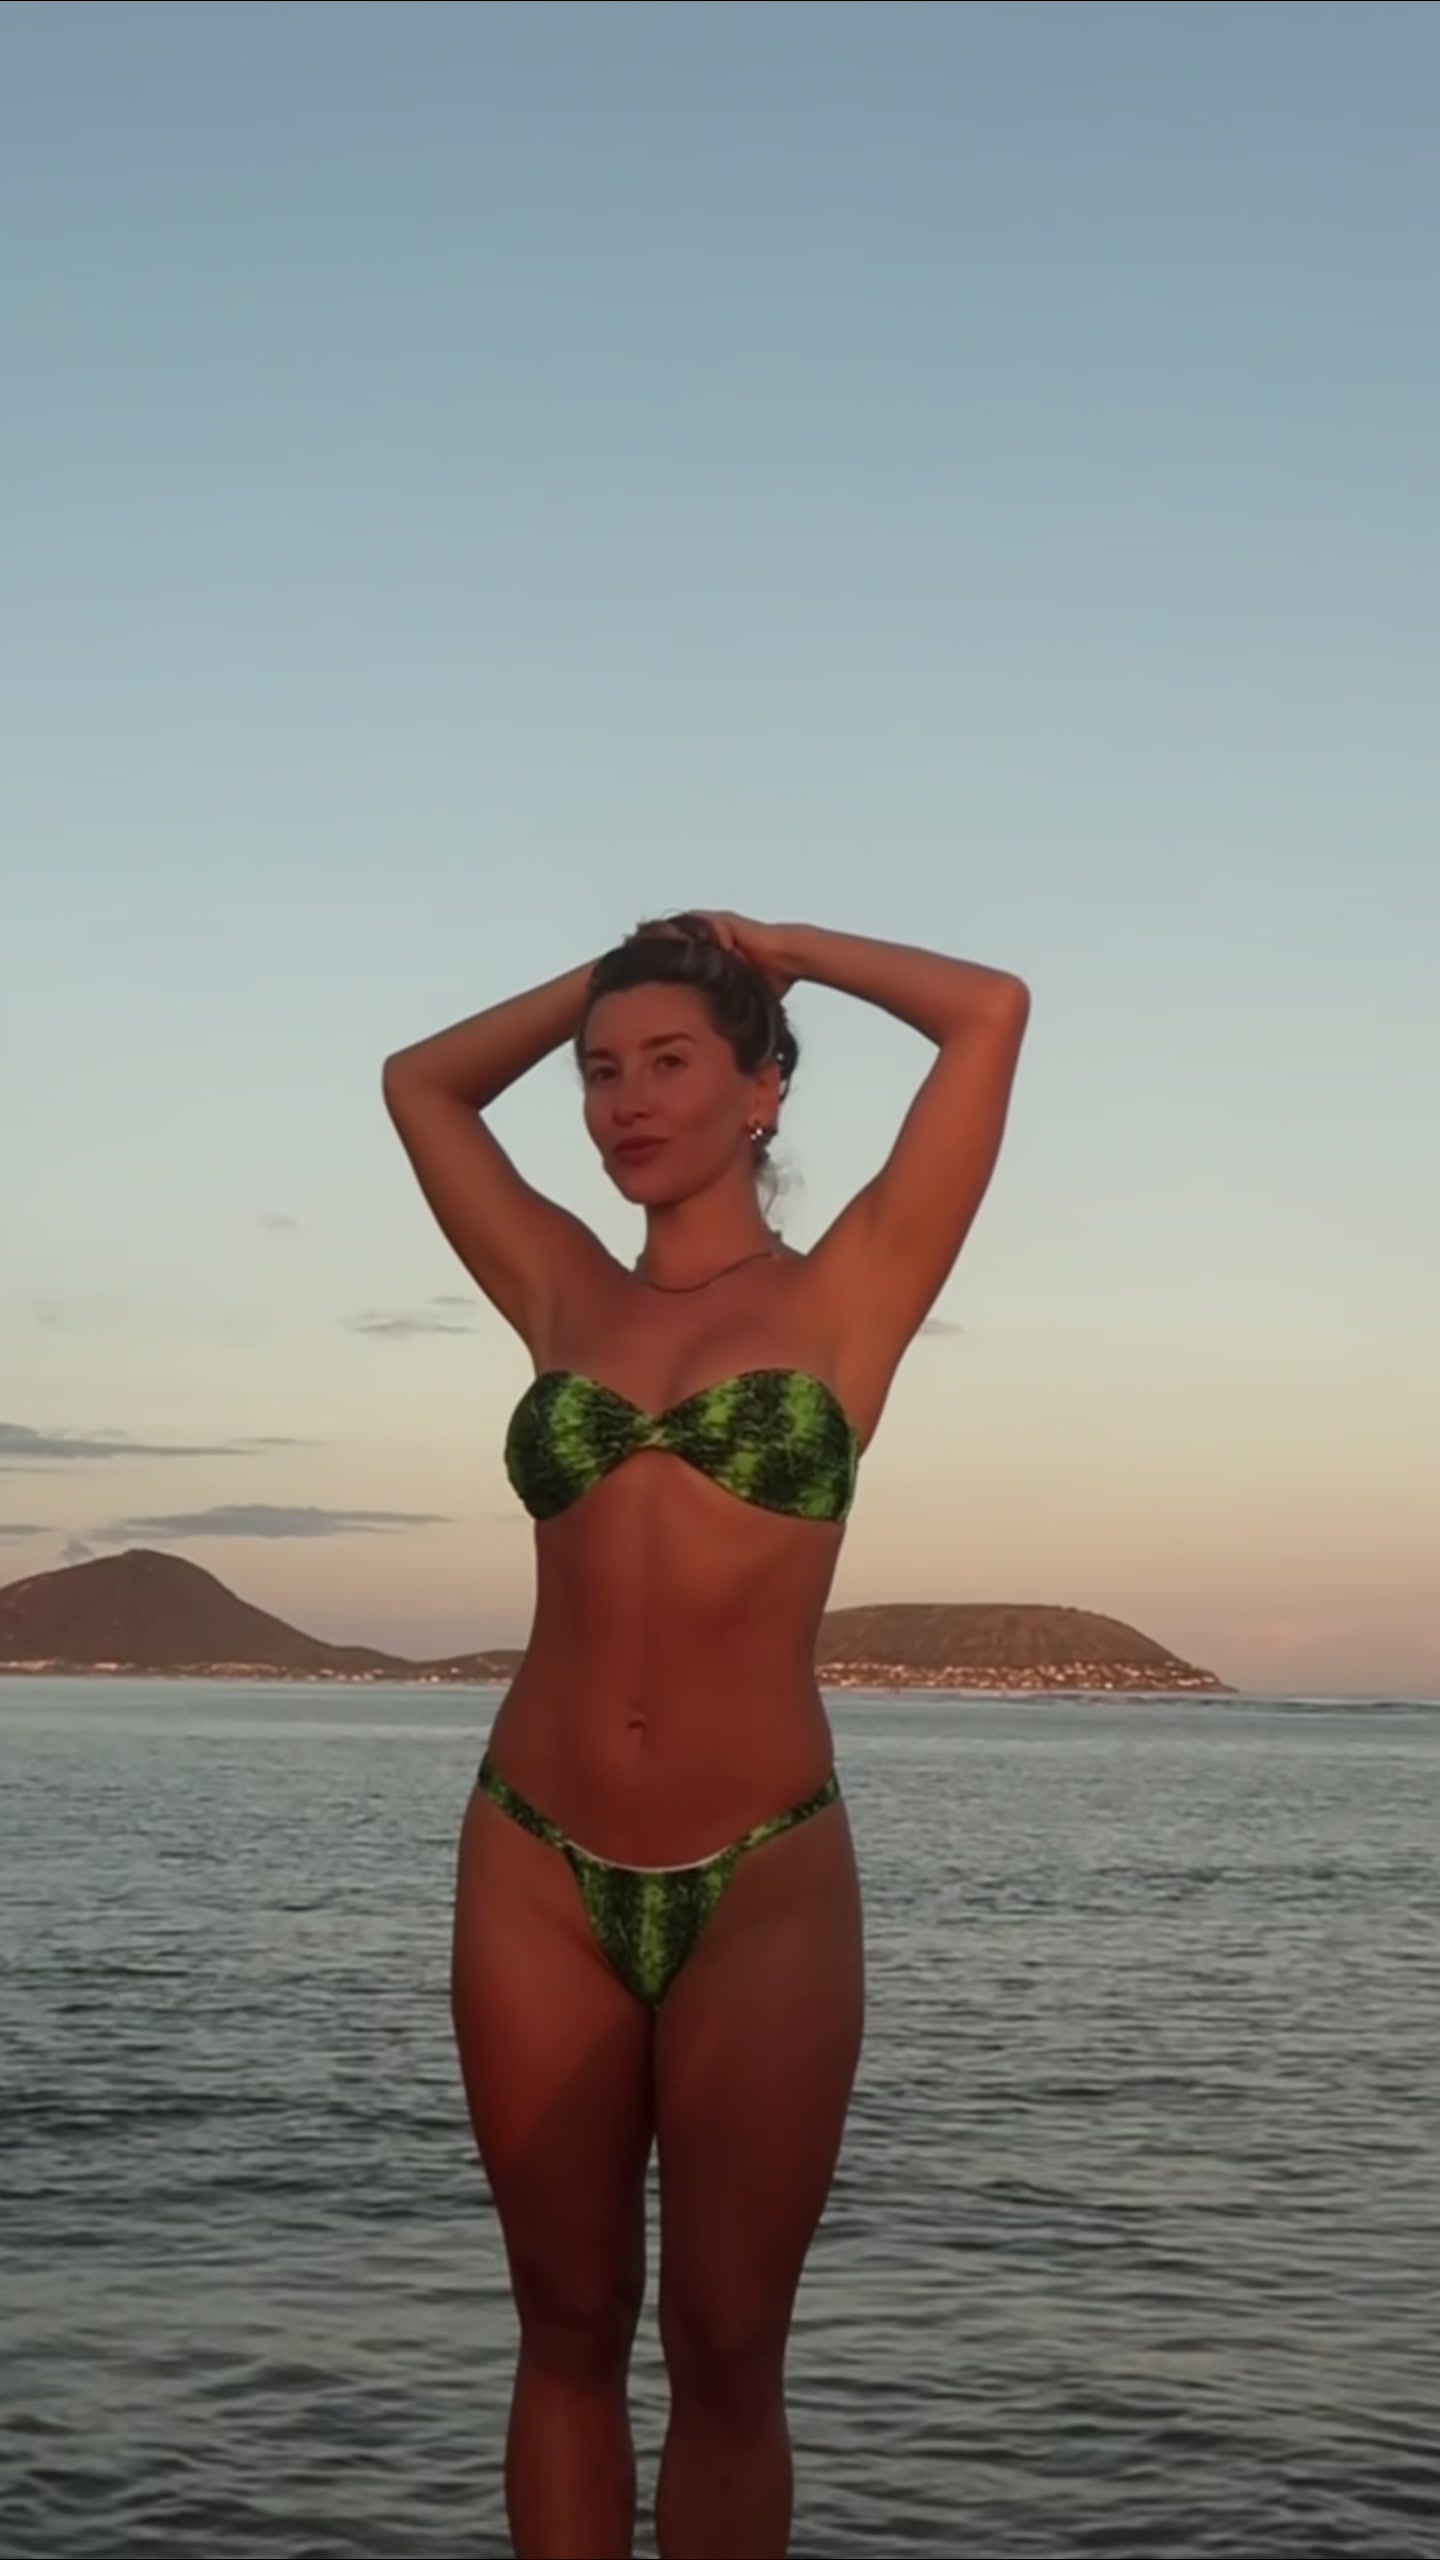
cleocameleo x Bright Swimwear
![Instagram post by @cleocameleo for Bright Swimwear. Caption reads: [...] 🌍 REFS (gift included) : swimwear....](https://images.od.modash.io/6a888b4b733d0a57daad51b0df8772c440c68a22)
Influencer bio
fashion diaries | surf x running lifestyle ꩜ France & Spain
Collaboration metrics
Get a free trial to find more data on influencer audiences, performance, and collaborations.
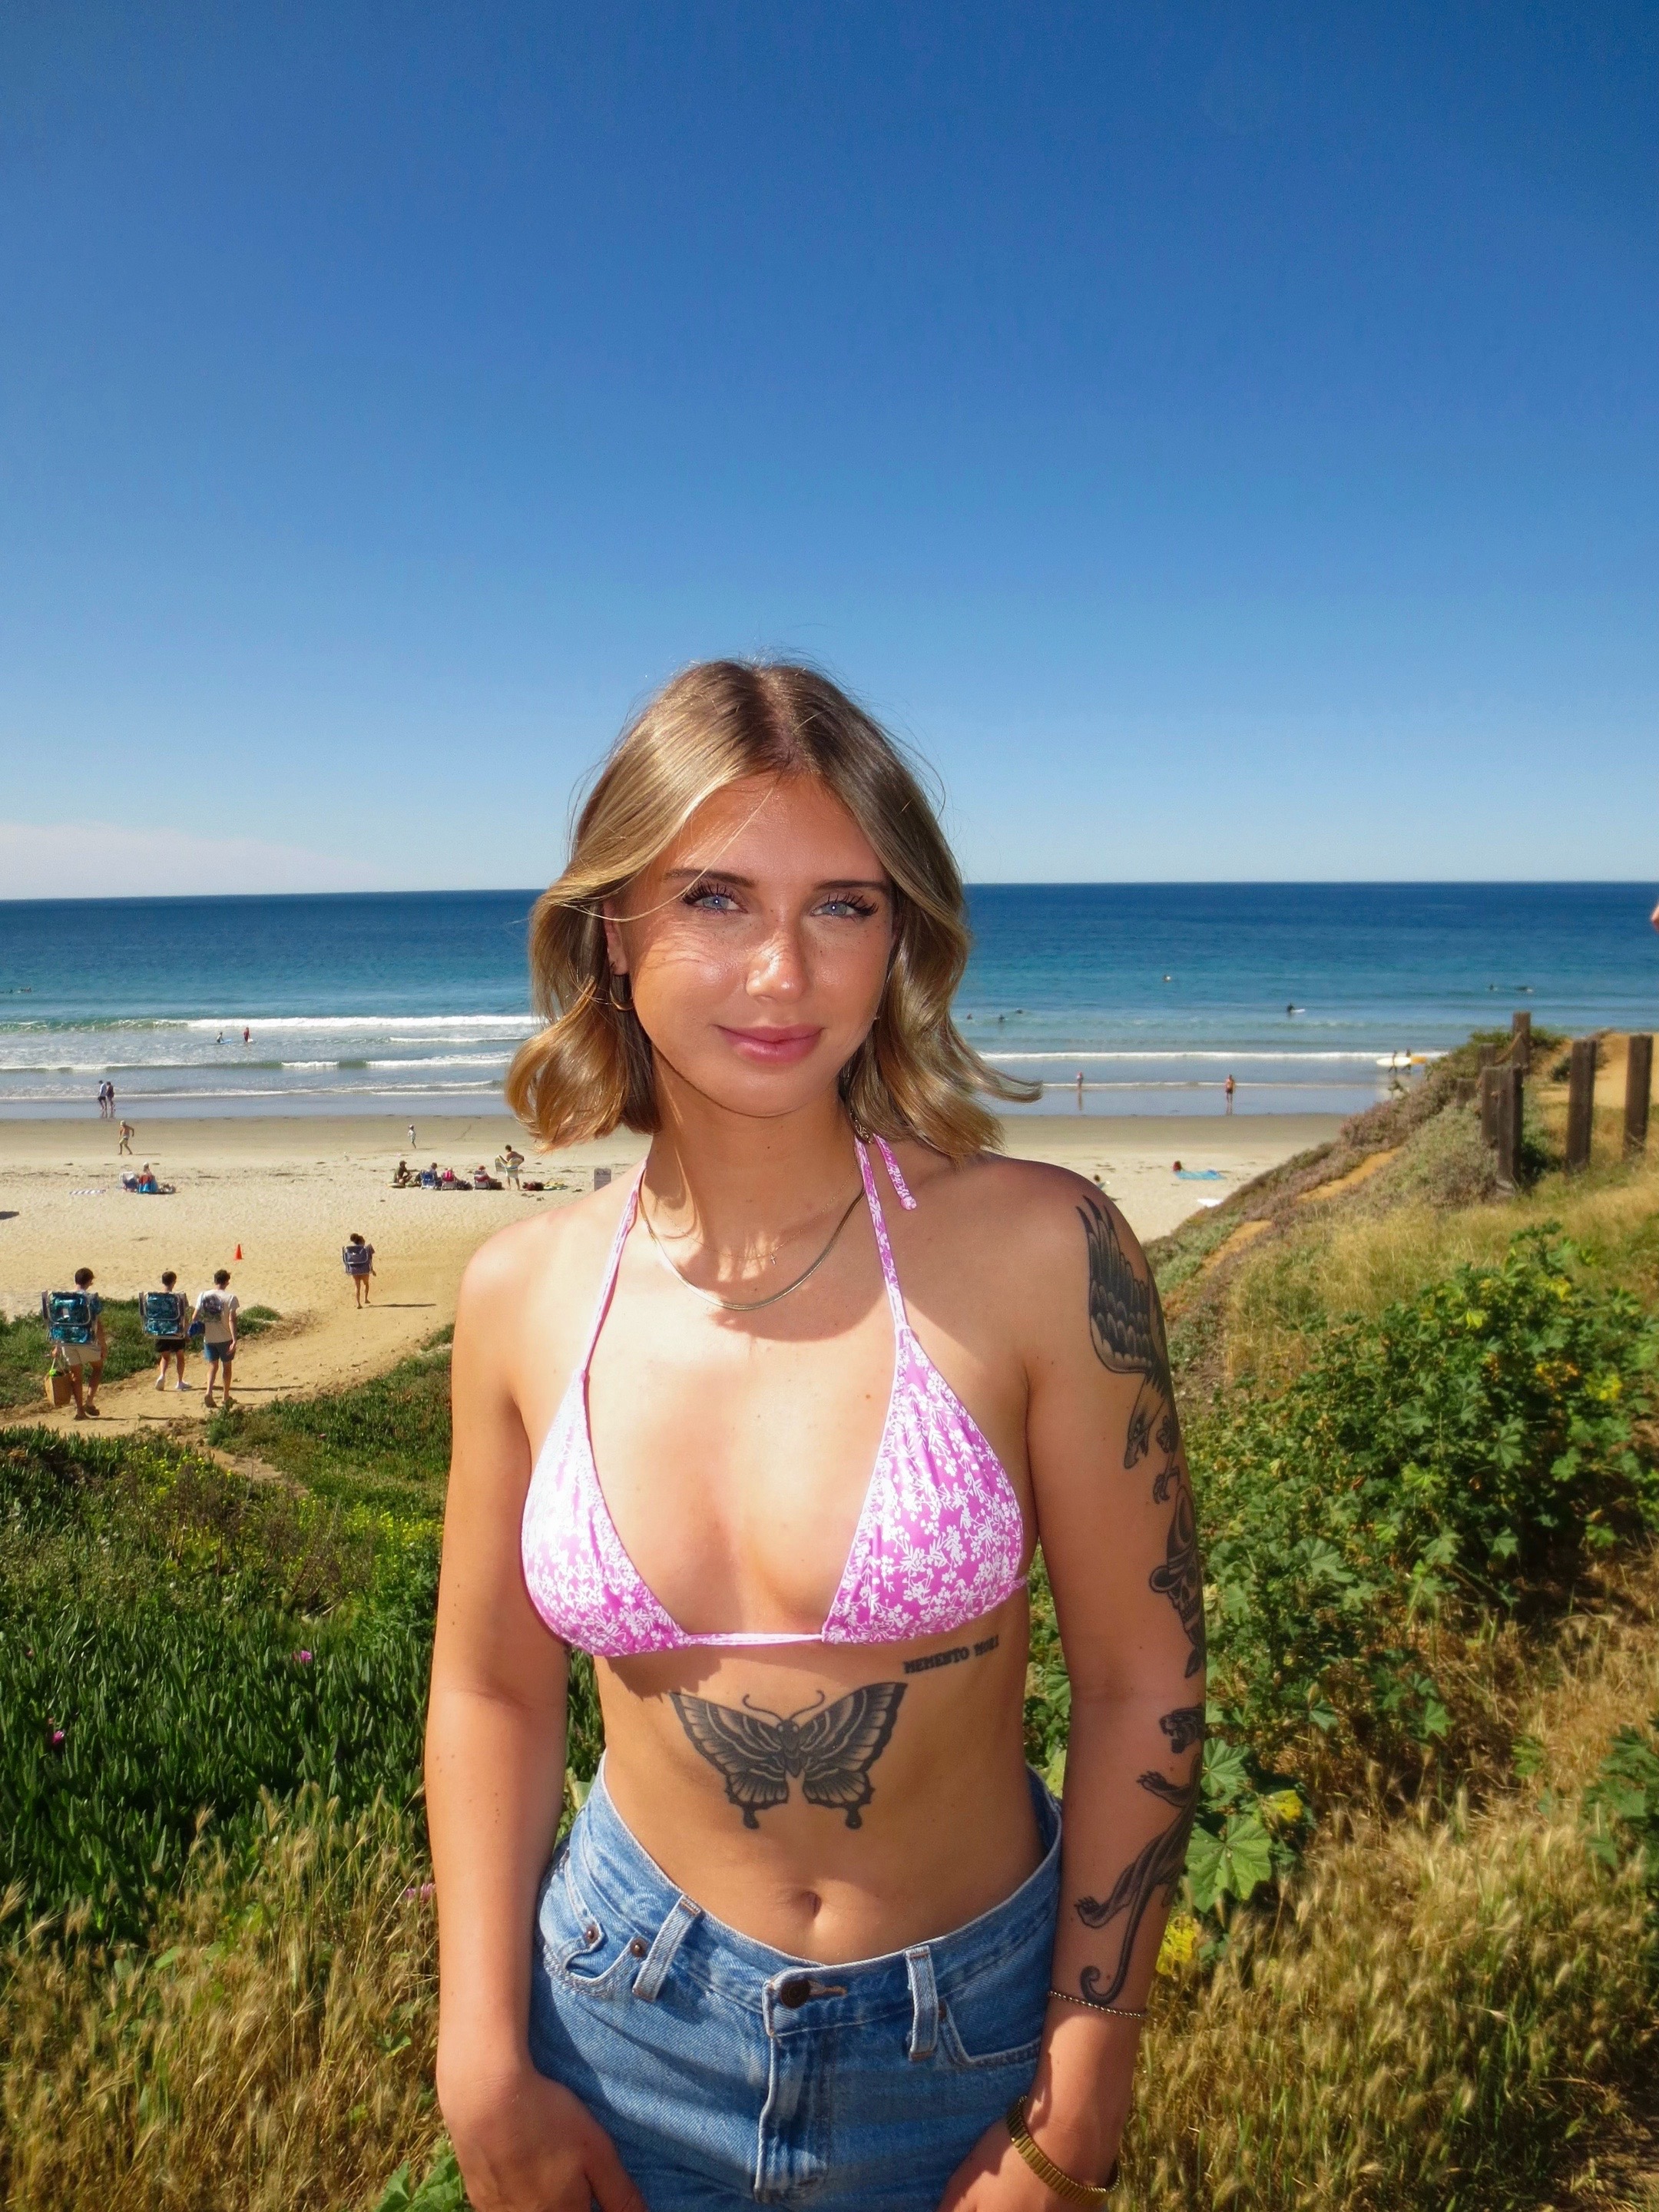
limehotpocket x Bright Swimwear
Influencer bio
san diego !! beach, fitness, and adventuring 🪩🌊✨🌅🐆 🍸 insta :ameliacalhn
Collaboration metrics
Get a free trial to find more data on influencer audiences, performance, and collaborations.
If you break this down further by content type on Instagram, this is what it looks like:
- Posts: 84.4%
- Reels: 15.6%
💡 Related resource: How To Find Instagram Influencers.
Influencer audience size breakdown (by views)
For their top social platform (Instagram), here is a breakdown of the type of influencers Bright Swimwear are collaborating with, by audience size.
Note: this breakdown is based on each influencer's average views (not follower/subscriber count), because views typically correlate more closely with influencer pricing and impact.
Bright Swimwear's influencers average views (Instagram)
Based on each influencer's average views per post
With 41.7% of partnerships featuring creators averaging 1K-5K views, Bright Swimwear's strategy suggests niche targeting and authenticity, likely leveraging collaboration models like gifting and affiliates to work with smaller creators.
Here is an example of a sponsored collaboration with a larger-audience creator on Instagram (11.2k avg views/post):
cryschau x Bright Swimwear
![Instagram post by @cryschau for Bright Swimwear. Caption reads: [...] for your feed 🌸🌼👙🌺🌻 Wearing....](https://images.od.modash.io/5b948924344275dea6cabbb9d1d25e01f0b27a59)
Influencer bio
💫 yappier in person 📍OC, CA | 🌱 UGC, couples, beauty, lifestyle 💌 work with me: crysnchau@gmail.com
Collaboration metrics
Get a free trial to find more data on influencer audiences, performance, and collaborations.
And here is another example with a smaller creator on Instagram (4.8k avg views/post):
amyloftusx x Bright Swimwear
![Instagram post by @amyloftusx for Bright Swimwear. Caption reads: [...] a sale with up to 50% off on @brightswimwear....](https://images.od.modash.io/332dd330093e32fda6f87de6451c63755e938a47)
Influencer bio
London 🍸
Collaboration metrics
Get a free trial to find more data on influencer audiences, performance, and collaborations.
Bright Swimwear's repeat partnerships
Out of 1.1k unique influencers in our dataset, 11 of them (1%) posted content for Bright Swimwear in 3 or more separate calendar months. The most consistent partner is @izzydalesandro, who has collaborated across 7 months with 25 total posts.
Here are 1 examples of Bright Swimwear's repeat influencer partnerships, with links to the sponsored content.
themedicalmind x Bright Swimwear
![TikTok post by @themedicalmind for Bright Swimwear. Caption reads: [...] my nervous system 🌞 👙 @Bright Swimwear....](https://images.od.modash.io/0fa327ebd142c9cced9c64b6583fdeafb5f06a37)
![TikTok post by @themedicalmind for Bright Swimwear. Caption reads: [...] (Hawaii edition) 🌴🥥 @Bright Swimwear....](https://images.od.modash.io/a947fc7bb784b9c43aeb5e1804bff7b5a0fc92f2)
💡 Related resource: Long-Term Influencer Partnerships: Pros, Cons & How The Pros Manage Them.
Geographical breakdown
In our dataset, United States is where Bright Swimwear had the most influencer activity. 60.7% of their live influencer content in the last 12 months was posted by American influencers.
Based on the percentage of influencer content per market, other important markets include:
- Australia (12.6%)
- United Kingdom (5.9%)
- Spain (3.4%)
Bright Swimwear's influencer activity by market
Here is another example of Bright Swimwear collaborating with an influencer in United States.
emma_elizaa x Bright Swimwear

Bright Swimwear's influencer activity vs. related brands
Bright Swimwear competes in women’s swim with fit-focused try-ons and vacation styling content. Cupshe and Monday Swimwear target similar beachwear shoppers and are common benchmarks for influencer-led haul and resort-ready campaigns.
Total influencer content
Bright Swimwear vs. related brands influencer activity
Total sponsored posts tracked (last 12 months)
Cupshe leads with 11.3k sponsored posts, significantly outpacing Monday Swimwear (2.6k posts) and Bright Swimwear (1.6k posts). Across all three brands, the average volume is 5.2k posts, indicating mature, scaled influencer programs. Cupshe has multiple times more total posts than Bright Swimwear and Monday Swimwear.
By social platform
Bright Swimwear vs. related brands influencer activity (by social platform)
Sponsored posts by platform
Among these brands, Cupshe leads on Instagram, TikTok, and YouTube. The gap is most notable on TikTok, with Cupshe at 6.9k, Monday Swimwear at 586, Bright Swimwear at 432 posts. Bright Swimwear's activity is particularly concentrated on Instagram. On TikTok, Cupshe has multiple times more posts than Bright Swimwear and Monday Swimwear, while Bright Swimwear has very few posts on YouTube.
By geographical market
Bright Swimwear vs. related brands influencer activity (by country)
Estimated sponsored posts in Bright Swimwear's top markets
Cupshe has the highest estimated sponsored-post volume in United States (6.2k posts, 54.5%), United Kingdom (1k posts, 8.9%), France (725 posts, 6.4%), suggesting a Europe focus, while Bright Swimwear leads in Australia with 201 posts (12.6%). Looking at United States specifically, the split is Cupshe at 6.2k posts (54.5%), Monday Swimwear at 1.4k posts (52.6%), Bright Swimwear at 971 posts (60.7%).
Read more influencer strategy breakdowns
Looking for more like this? Here are 5 similar influencer marketing strategy breakdowns for other brands:
- Cupshe's Influencer Marketing Strategy
- Monday Swimwear's Influencer Marketing Strategy
- Shaperx's Influencer Marketing Strategy
- – Laura Geller's Influencer Marketing Strategy
- TLF Apparel's Influencer Marketing Strategy
Or, if you want to access data like this for your own software or processes, take a look at Modash's API products:
Frequently asked questions
Scaling your influencer program?
When you outgrow your mishmash of spreadsheets & free tools, try Modash. Find & email influencers, track campaigns, ship products & more - all in one place.