Shaperx Influencer Marketing Strategy
(2026 Data & Insights)
We analyzed 3.5k pieces of influencer content sponsored by Shaperx over the last 12 months.
This report breaks down where & how Shaperx invests in influencer marketing, which social platforms they prioritize, top geographical markets, and more.
The data in this report comes from Modash's Brand Collaborations API.
P.S. for a simple list of influencers who have collaborated with Shaperx, see here: Shaperx influencers.
Influencer activity throughout the year
Shaperx's influencer campaigns are active year-round with notable month-to-month fluctuation. The chart below shows month-by-month data for total sponsored posts tracked.
Shaperx's influencer activity by month
Number of sponsored posts
Shaperx's sponsored post volume peaks in January with 499 posts, 71% higher than the monthly average of 291. August recorded the lowest activity at 129 posts, 56% below average.
Social platforms breakdown
In our dataset (which only includes Instagram, YouTube, and TikTok), this is how the volume of Shaperx's sponsored influencer collaborations break down by social platform:
- TikTok: 3.2k posts (92.4%)
- Instagram: 268 posts (7.6%)
Shaperx's influencer activity by platform
Share of sponsored content by social network
TikTok influencer marketing is a clear focus for Shaperx.
Here are 2 examples of Shaperx's recent sponsored collaborations (one each for Instagram, TikTok).
nahrinpearl x Shaperx
Influencer bio
miami | bangladesh 💌nahrinpearl29@gmail.com check out my YouTube channel down below
Collaboration metrics
Get a free trial to find more data on influencer audiences, performance, and collaborations.
krunch.7 x Shaperx
![TikTok post by @krunch.7 for Shaperx. Caption reads: [...] #shapewear #snatched #compression #shaperx....](https://images.od.modash.io/e546314c57b72706968b682e6750612ea2ec6b19)
Influencer bio
Your hygiene + glow up bestie 💕 Fresh • Confident • Snatched TikTok Shop finds I love 🛍️ ⬇️ Shop my favorites 📧 Krunch0420@gmail.com
Collaboration metrics
Get a free trial to find more data on influencer audiences, performance, and collaborations.
If you break this down further by content type on TikTok, this is what it looks like:
- Videos: 97.5%
- Carousels: 2.5%
💡 Related resource: How To Find TikTok Influencers.
Influencer audience size breakdown (by views)
For their top social platform (TikTok), here is a breakdown of the type of influencers Shaperx are collaborating with, by audience size.
Note: this breakdown is based on each influencer's average views (not follower/subscriber count), because views typically correlate more closely with influencer pricing and impact.
Shaperx's influencers average views (TikTok)
Based on each influencer's average views per post
With 62.4% of partnerships featuring creators averaging <1K views, Shaperx's strategy suggests niche targeting and authenticity, likely leveraging collaboration models like gifting and affiliates to work with smaller creators.
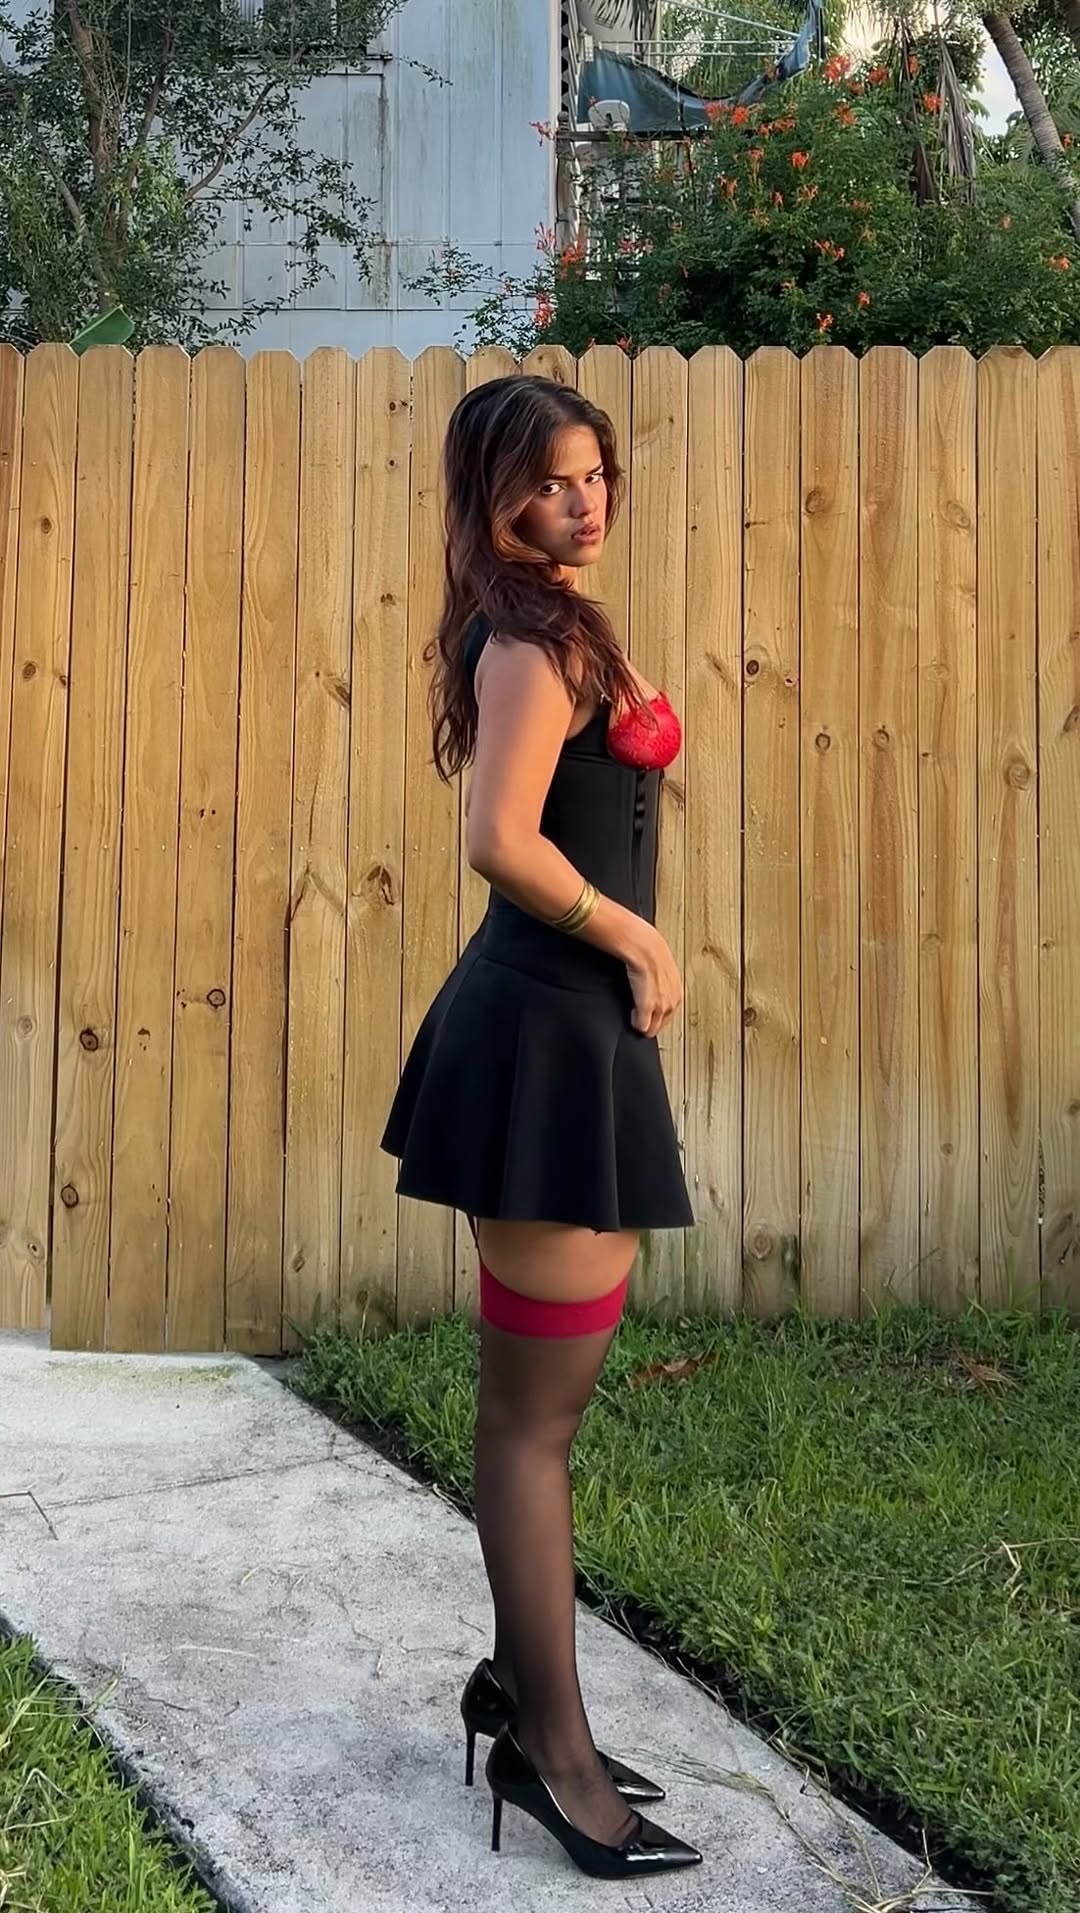
Here is an example of a sponsored collaboration with a larger-audience creator on TikTok (1.1M avg views/post):
chanelraphael x Shaperx

Influencer bio
🌹Lady in Red🌹
Collaboration metrics
Get a free trial to find more data on influencer audiences, performance, and collaborations.
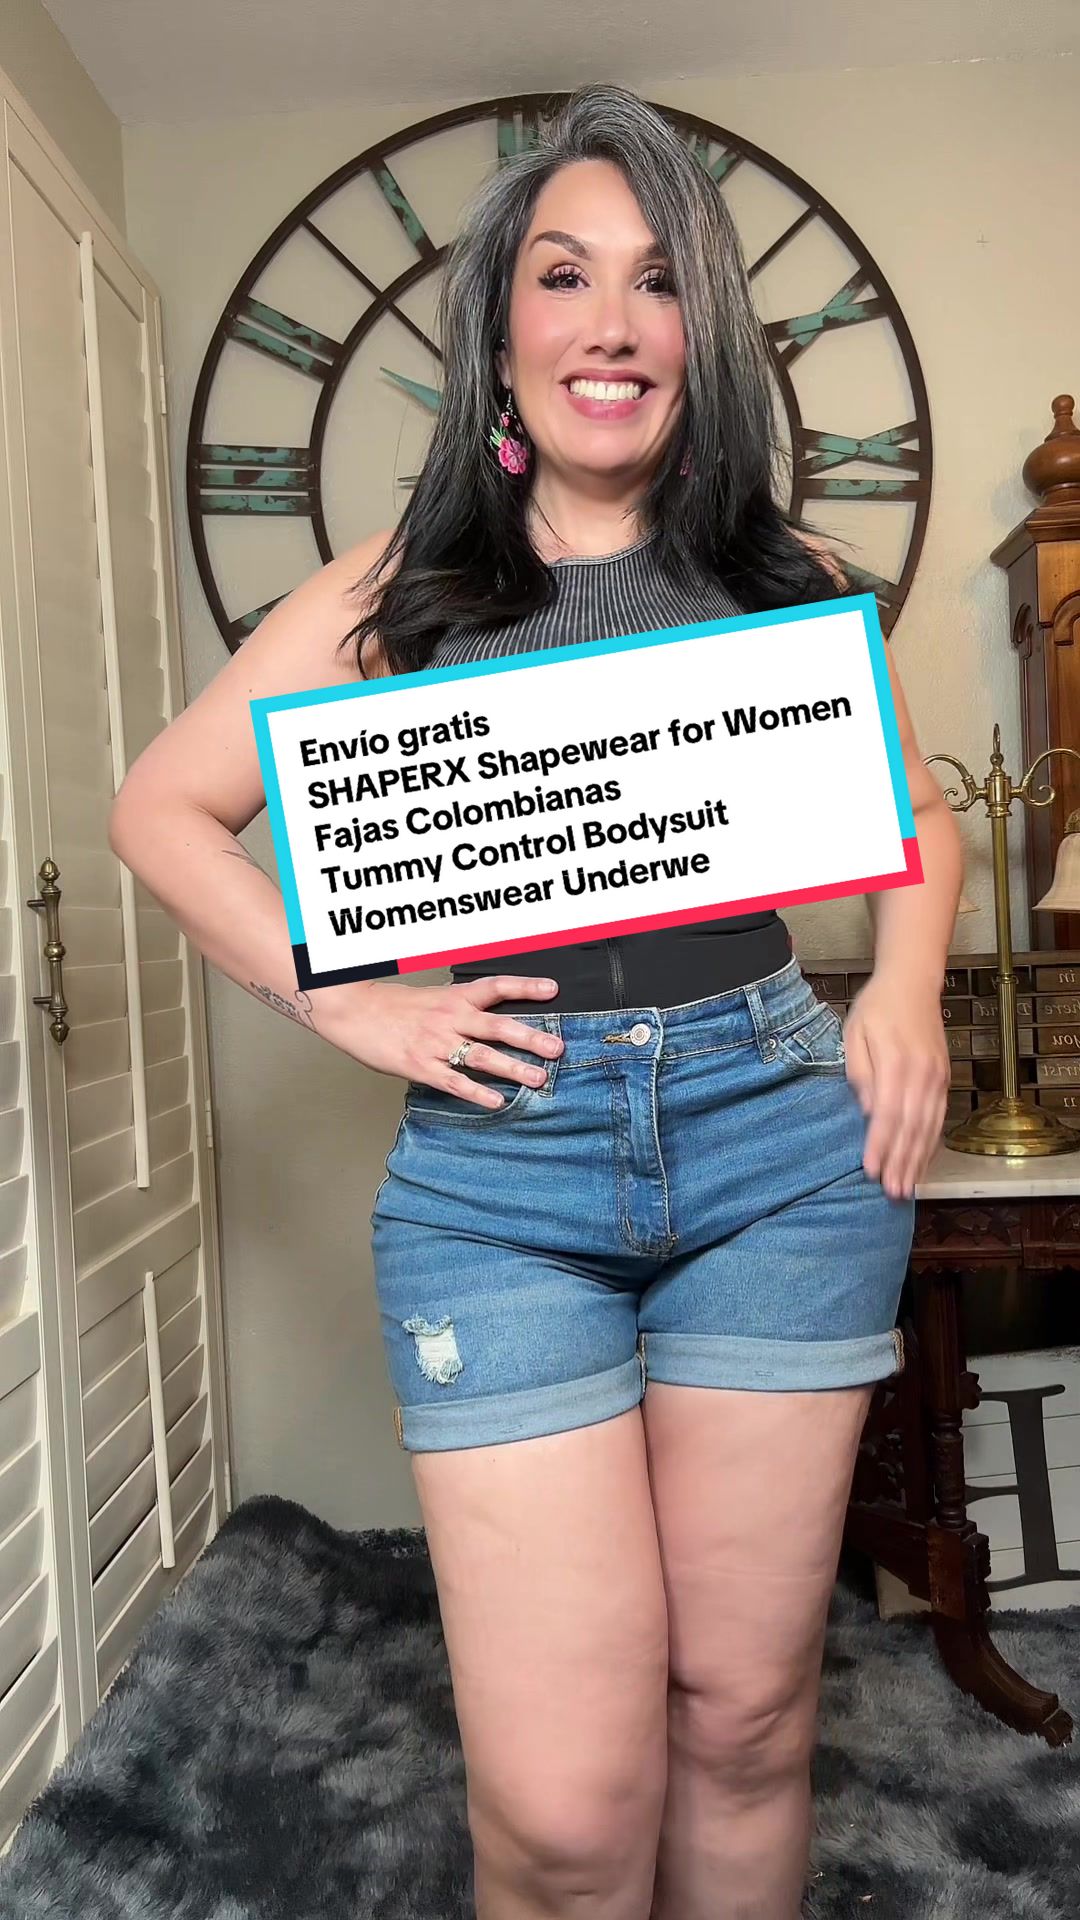
And here is another example with a smaller creator on TikTok (9.0k avg views/post):
nursem22 x Shaperx
![TikTok post by @nursem22 for Shaperx. Caption reads: [...] #BodyShaper #FitnessWear #fyp @SHAPERX.](https://images.od.modash.io/0a6c48a73c1532c9f387c4fc3f8d4c83e30c981c)
Influencer bio
TikTok Shop Affiliate 📦 | UGC Creator 🎥 | Biz: Dm
Collaboration metrics
Get a free trial to find more data on influencer audiences, performance, and collaborations.
Shaperx's repeat partnerships
Out of 988 unique influencers in our dataset, 101 of them (10%) posted content for Shaperx in 3 or more separate calendar months. The most consistent partner is @blanca7902, who has collaborated across 10 months with 212 total posts. @blanca7902 alone accounts for 6% of all tracked sponsored content.
Here are 3 examples of Shaperx's repeat influencer partnerships, with links to the sponsored content.
blanca7902 x Shaperx
![TikTok post by @blanca7902 for Shaperx. Caption reads: [...] #bodysuit #shapewear @ShaperX.](https://images.od.modash.io/bee938a1d7c60ae193ac257a6ea9b0d805d414bd)
![TikTok post by @blanca7902 for Shaperx. Caption reads: [...] #TikTokShopCreatorPicks @ShaperX.](https://images.od.modash.io/763256abad93ab53e47736066035025907f03e67)
![TikTok post by @blanca7902 for Shaperx. Caption reads: [...] #bodysuit #bodysuitshapewear @SHAPERX.](https://images.od.modash.io/aec3ebaf49c4fbbf6b0d4d5bf293132905b56371)
limon.con.ron x Shaperx
![TikTok post by @limon.con.ron for Shaperx. Caption reads: SHAPERX Full Body Shapewear Tummy [...].](https://images.od.modash.io/b3f53a5f0f08b9d228f157c3f8825c68c84e3b42)
![TikTok post by @limon.con.ron for Shaperx. Caption reads: [...] a @Angeles Martínez Vlogs SHAPERX Shapewear....](https://images.od.modash.io/1703b2aa972f6d72c220026046417c41efd4cbac)
chicaflowyestilo x Shaperx
![TikTok post by @chicaflowyestilo for Shaperx. Caption reads: Faja invisible @SHAPERX #SummerVibes [...].](https://images.od.modash.io/712df0f1bc81da1f4899f9fcedb5b4164cd33901)

![TikTok post by @chicaflowyestilo for Shaperx. Caption reads: Faja invisible @SHAPERX #SummerVibes [...].](https://images.od.modash.io/744c2c44a6db5fd48fb668612038735a7b2b64ac)
💡 Related resource: Long-Term Influencer Partnerships: Pros, Cons & How The Pros Manage Them.
Geographical breakdown
In our dataset, United States is where Shaperx had the most influencer activity. 43.5% of their live influencer content in the last 12 months was posted by American influencers.
Based on the percentage of influencer content per market, other important markets include:
- Italy (8.7%)
- Spain (7.4%)
- Brazil (6.2%)
Shaperx's influencer activity by market
Here is another example of Shaperx collaborating with an influencer in United States.
chicaflowyestilo x Shaperx
Shaperx's influencer activity vs. related brands
Shaperx competes directly with Shapellx and SPANX in shapewear and body-smoothing essentials where fit, comfort, and before/after visuals are key. These brands commonly target the same fashion and lifestyle creators for try-on content.
Total influencer content
Shaperx vs. related brands influencer activity
Total sponsored posts tracked (last 12 months)
Shapellx leads with 12.2k sponsored posts, significantly outpacing Shaperx (3.5k posts) and SPANX (3.2k posts). Across all three brands, the average volume is 6.3k posts, indicating mature, scaled influencer programs.
By social platform
Shaperx vs. related brands influencer activity (by social platform)
Sponsored posts by platform
Among these brands, SPANX leads on Instagram and YouTube and Shapellx leads on TikTok. The gap is most notable on TikTok, with Shapellx at 11.9k, Shaperx at 3.2k, SPANX at 515 posts. Shaperx's activity is particularly concentrated on TikTok. TikTok has far more posts than Instagram or YouTube for all three brands, and SPANX has many more Instagram posts than Shaperx while Shapellx has none.
By geographical market
Shaperx vs. related brands influencer activity (by country)
Estimated sponsored posts in Shaperx's top markets
Shapellx has the highest estimated sponsored-post volume in United States (9.6k posts, 79%), India (952 posts, 7.8%), United Kingdom (415 posts, 3.4%), while Shaperx has the highest estimated sponsored-post volume in Italy (306 posts, 8.7%), Spain (260 posts, 7.4%), suggesting a Europe focus, while SPANX leads in Canada with 165 posts (5.1%). Looking at United States specifically, the split is Shapellx at 9.6k posts (79%), SPANX at 2.4k posts (74.1%), Shaperx at 1.5k posts (43.5%).
Read more influencer strategy breakdowns
Looking for more like this? Here are 5 similar influencer marketing strategy breakdowns for other brands:
- Shapellx's Influencer Marketing Strategy
- SPANX's Influencer Marketing Strategy
- Levoit's Influencer Marketing Strategy
- Liquid Death's Influencer Marketing Strategy
- Cécred's Influencer Marketing Strategy
Or, if you want to access data like this for your own software or processes, take a look at Modash's API products:
Frequently asked questions
Scaling your influencer program?
When you outgrow your mishmash of spreadsheets & free tools, try Modash. Find & email influencers, track campaigns, ship products & more - all in one place.