Caden Lane Influencer Marketing Strategy
(2026 Data & Insights)
We analyzed 1.2k pieces of influencer content sponsored by Caden Lane over the last 12 months.
This report breaks down where & how Caden Lane invests in influencer marketing, which social platforms they prioritize, top geographical markets, and more.
The data in this report comes from Modash's Brand Collaborations API.
P.S. for a simple list of influencers who have collaborated with Caden Lane, see here: Caden Lane influencers.
Influencer activity throughout the year
Caden Lane's influencer campaigns are active year-round with notable month-to-month fluctuation. The chart below shows month-by-month data for total sponsored posts tracked.
Caden Lane's influencer activity by month
Number of sponsored posts
Caden Lane's influencer output appears relatively consistent throughout the year, averaging about 98 sponsored posts per month. March recorded the highest volume at 162 posts (65% above average), while July was the quietest at 65 posts.
Social platforms breakdown
In our dataset (which only includes Instagram, YouTube, and TikTok), this is how the volume of Caden Lane's sponsored influencer collaborations break down by social platform:
- Instagram: 883 posts (75.2%)
- TikTok: 288 posts (24.5%)
- YouTube: 3 posts (0.3%)
Caden Lane's influencer activity by platform
Share of sponsored content by social network
Instagram influencer marketing is a clear focus for Caden Lane.
Here are 3 examples of Caden Lane's recent sponsored collaborations (one each for Instagram, TikTok, YouTube).
themelaniecruz x Caden Lane
Influencer bio
Founder | Cruz Collective Beauty Fort Worth's Luxury Extension Salon Color + Extension Expert ✝️ Wife · Mom of 3 · CRE @cruzcollectivebeauty | DFW, TX
Collaboration metrics
Get a free trial to find more data on influencer audiences, performance, and collaborations.
mothercookiecake x Caden Lane
![TikTok post by @mothercookiecake for Caden Lane. Caption reads: [...] code NOCOCOOKIE to get 20% off your @Caden....](https://images.od.modash.io/ea4c10e01fe267c7cb9d2cd9221433cbe9d60220)
Influencer bio
📍 Fort Collins, CO 🍪 loved by all, annoyed by everyone 💌 shelby@proudmanagement.net
Collaboration metrics
Get a free trial to find more data on influencer audiences, performance, and collaborations.
juicystar07 x Caden Lane
![YouTube post by @juicystar07 for Caden Lane. Caption reads: [...] ▪️Button Up Nightgown (Black): ▪️Caden Lane....](https://images.od.modash.io/14088a22c7941e4eb87dd8f05d09c0b3e52a5219)
Influencer bio
Welcome to my channel! I'm Blair Fowler and have been uploading beauty, fashion and lifestyle videos since 2008. Show your support by subscribing! Business Inquiries Only: BlairFowlerPromo@gmail.com
Collaboration metrics
Get a free trial to find more data on influencer audiences, performance, and collaborations.
If you break this down further by content type on Instagram, this is what it looks like:
- Reels: 60.7%
- Posts: 39.3%
💡 Related resource: How To Find Instagram Influencers.
Influencer audience size breakdown (by views)
For their top social platform (Instagram), here is a breakdown of the type of influencers Caden Lane are collaborating with, by audience size.
Note: this breakdown is based on each influencer's average views (not follower/subscriber count), because views typically correlate more closely with influencer pricing and impact.
Caden Lane's influencers average views (Instagram)
Based on each influencer's average views per post
Caden Lane's creator selection appears relatively diversified across size tiers, with no single segment dominating. This suggests a balanced approach to influencer partnerships, spreading investment across different audience sizes.
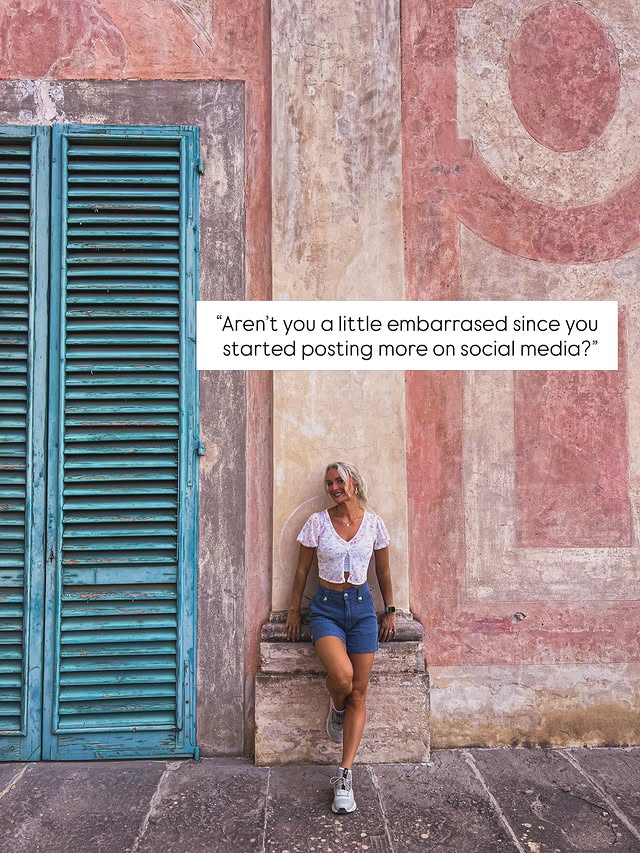
Here is an example of a sponsored collaboration with a larger-audience creator on Instagram (95.7k avg views/post):
brittanygarzillostephens x Caden Lane
![Instagram post by @brittanygarzillostephens for Caden Lane. Caption reads: [...] 💋 How cute are these pajamas from....](https://images.od.modash.io/98d80b2f8f34c24305b5515b3d32bb161001048e)
Influencer bio
Motherhood | Hair | Beauty Emmy Award-winning network journalist turned SAHM ✉️ brittanygstephens@gmail.com | Shop ↓
Collaboration metrics
Get a free trial to find more data on influencer audiences, performance, and collaborations.
And here is another example with a smaller creator on Instagram (4.7k avg views/post):
ruth_swing316 x Caden Lane
Influencer bio
The feel good mom & dad content you need — faith, health & wellness, RN 💌 ruthswingler316@gmail.com 🌺management @bluebirdinfluence
Collaboration metrics
Get a free trial to find more data on influencer audiences, performance, and collaborations.
Caden Lane's repeat partnerships
Out of 788 unique influencers in our dataset, 20 of them (3%) posted content for Caden Lane in 3 or more separate calendar months. The most consistent partner is @jessica.mcdanie.l, who has collaborated across 7 months with 8 total posts.
Here are 2 examples of Caden Lane's repeat influencer partnerships, with links to the sponsored content.
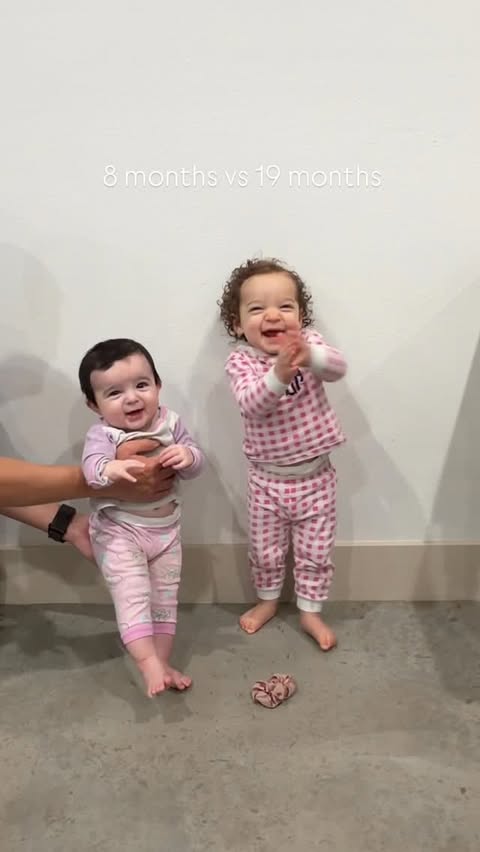
madissonstickel x Caden Lane
![Instagram post by @madissonstickel for Caden Lane. Caption reads: [...] preschool! 🍎 Head over to @cadenlane to....](https://images.od.modash.io/3953c4d41c4d6086f5cf9c31084c1123048247e5)
![Instagram post by @madissonstickel for Caden Lane. Caption reads: [...] cutest pajama prints from @cadenlane! #ad....](https://images.od.modash.io/1a2450dd3bd81bddc578e4a064b20320024797dd)
![Instagram post by @madissonstickel for Caden Lane. Caption reads: [...] with these sweet gifts from Caden Lane! #ad....](https://images.od.modash.io/d5b124dab80ba4182d64cb2e757ffd41aabe0801)
theclassymamabear x Caden Lane
![Instagram post by @theclassymamabear for Caden Lane. Caption reads: [...] meets coziness 🖍✨ Our new @cadenlane....](https://images.od.modash.io/b923182642fa362d2b5c947bbdf4b5a22de7d5f1)
![Instagram post by @theclassymamabear for Caden Lane. Caption reads: [...] the tree this year from @cadenlane — the....](https://images.od.modash.io/f7aab9d5901aaf1678527e0d4d7805c6166ce8d5)
![Instagram post by @theclassymamabear for Caden Lane. Caption reads: [...] their adorable jammies from @cadenlane! Not....](https://images.od.modash.io/94b62b9300ca62433794c49490a02e0807781b8d)
💡 Related resource: Long-Term Influencer Partnerships: Pros, Cons & How The Pros Manage Them.
Geographical breakdown
In our dataset, United States is where Caden Lane had the most influencer activity. 82.3% of their live influencer content in the last 12 months was posted by American influencers.
Based on the percentage of influencer content per market, other important markets include:
- United Kingdom (3.8%)
- Canada (3.4%)
- Brazil (2.8%)
Caden Lane's influencer activity by market
Here is another example of Caden Lane collaborating with an influencer in United States.
micah.juliet x Caden Lane
![Instagram post by @micah.juliet for Caden Lane. Caption reads: [...] with the link to this post on my LTK ⬇....](https://images.od.modash.io/bde29aabdf92fd2e5f5d4c62a8de10196cd8113a)
Caden Lane's influencer activity vs. related brands
Caden Lane overlaps with Lovevery and PatPat in baby/parenting purchasing moments like gifting, nursery setup, and early-life essentials. All three can compete for the same parent creator communities and family-focused influencer placements.
Total influencer content
Caden Lane vs. related brands influencer activity
Total sponsored posts tracked (last 12 months)
PatPat leads with 4.1k sponsored posts, marginally ahead of Lovevery (3.8k posts) and Caden Lane (1.2k posts). Across all three brands, the average volume is 3k posts, indicating mature, scaled influencer programs. Lovevery and PatPat each have more than three times as many total posts as Caden Lane.
By social platform
Caden Lane vs. related brands influencer activity (by social platform)
Sponsored posts by platform
Among these brands, Lovevery leads on Instagram and YouTube and PatPat leads on TikTok. The gap is most notable on TikTok, with PatPat at 3.8k, Lovevery at 1.5k, Caden Lane at 288 posts. Caden Lane's activity is particularly concentrated on Instagram. PatPat has more than twice as many TikTok posts as Lovevery and more than ten times as many as Caden Lane, while Lovevery has more than twice as many Instagram posts as Caden Lane and almost six times as many as PatPat.
By geographical market
Caden Lane vs. related brands influencer activity (by country)
Estimated sponsored posts in Caden Lane's top markets
Lovevery has the highest estimated sponsored-post volume in United States (1.7k posts, 45.5%), United Kingdom (492 posts, 13.1%), Australia (199 posts, 5.3%), while PatPat has the highest estimated sponsored-post volume in Brazil (556 posts, 13.5%), Italy (333 posts, 8.1%), while Caden Lane leads in Canada with 40 posts (3.4%). Looking at United States specifically, the split is Lovevery at 1.7k posts (45.5%), PatPat at 1.6k posts (38.9%), Caden Lane at 966 posts (82.3%).
Read more influencer strategy breakdowns
Looking for more like this? Here are 5 similar influencer marketing strategy breakdowns for other brands:
- Lovevery's Influencer Marketing Strategy
- PatPat's Influencer Marketing Strategy
- Polaroid's Influencer Marketing Strategy
- Native Pet's Influencer Marketing Strategy
- KATCH ME's Influencer Marketing Strategy
Or, if you want to access data like this for your own software or processes, take a look at Modash's API products:
Frequently asked questions
Scaling your influencer program?
When you outgrow your mishmash of spreadsheets & free tools, try Modash. Find & email influencers, track campaigns, ship products & more - all in one place.