Chomps Influencer Marketing Strategy
(2026 Data & Insights)
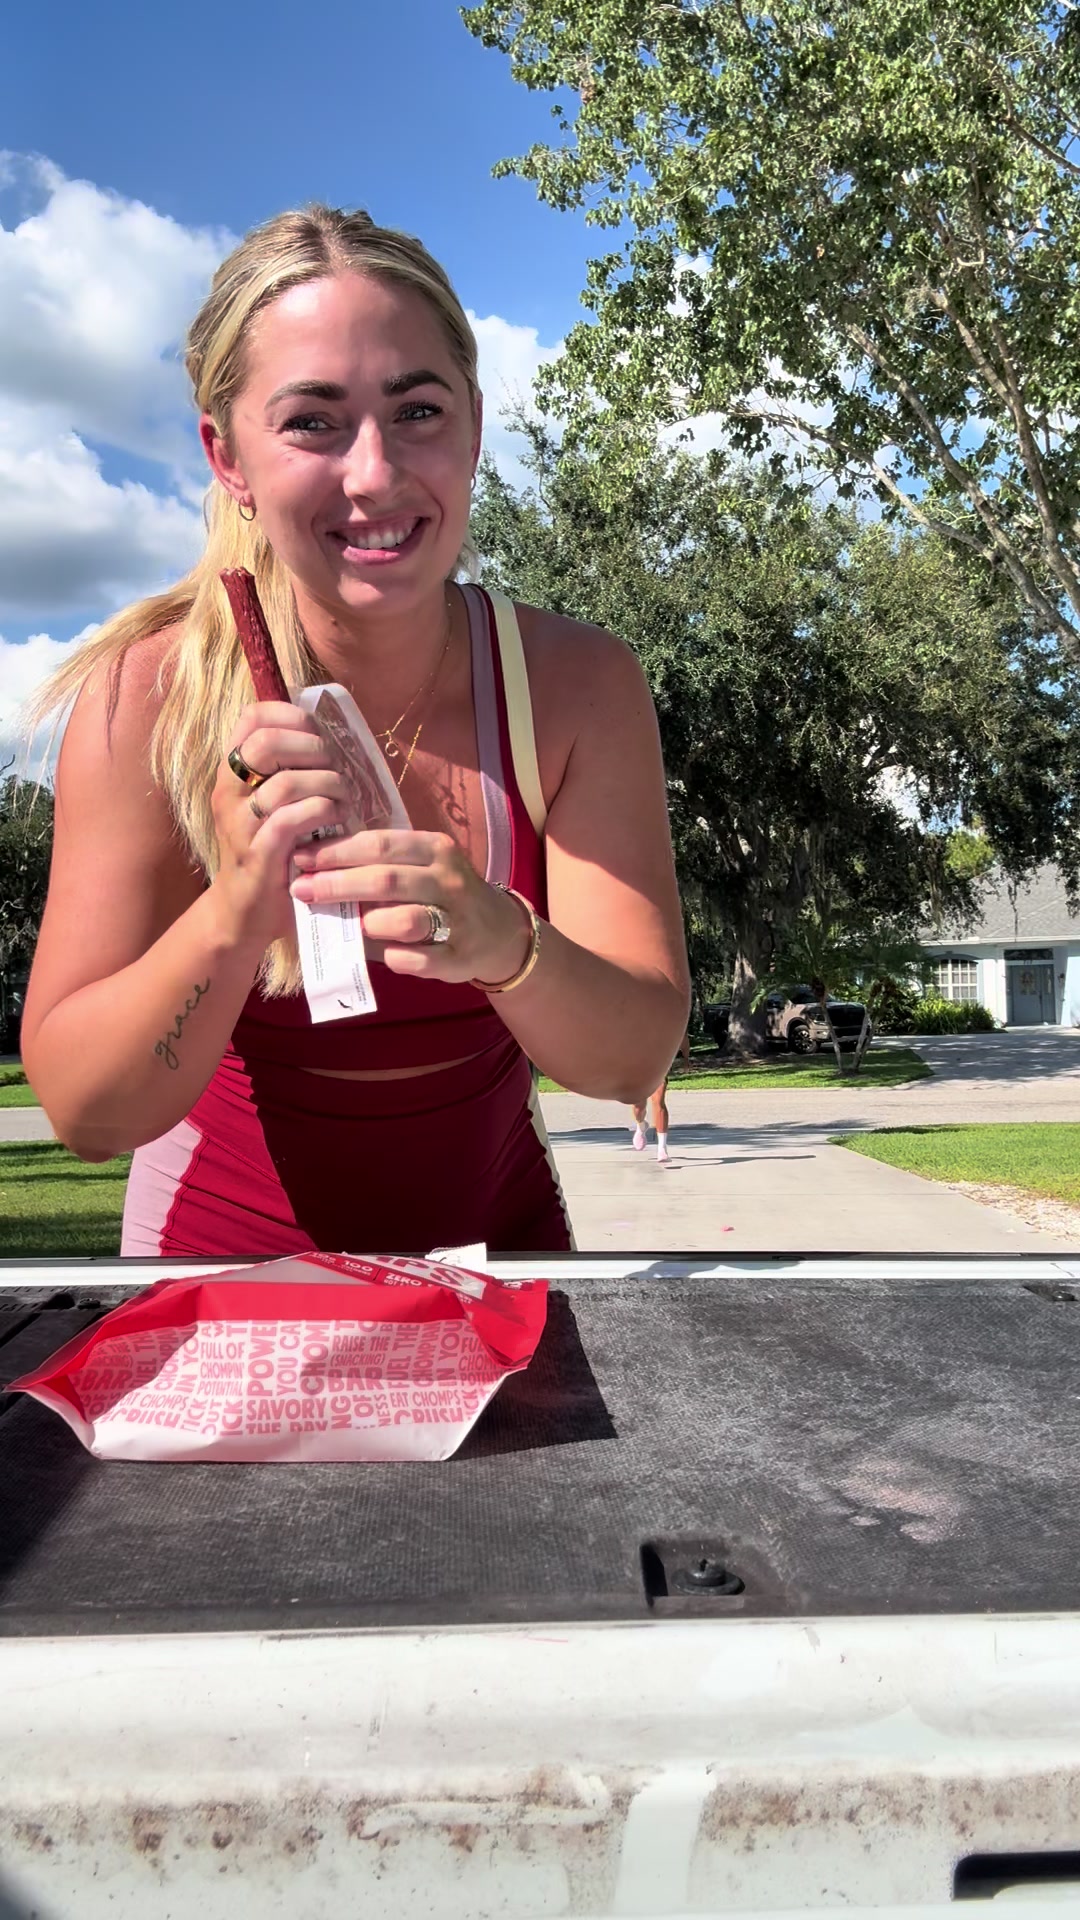
We analyzed 1.9k pieces of influencer content sponsored by Chomps over the last 12 months.
This report breaks down where & how Chomps invests in influencer marketing, which social platforms they prioritize, top geographical markets, and more.
The data in this report comes from Modash's Brand Collaborations API.
P.S. for a simple list of influencers who have collaborated with Chomps, see here: Chomps influencers.
Influencer activity throughout the year
Chomps's influencer campaigns are active year-round with notable month-to-month fluctuation. The chart below shows month-by-month data for total sponsored posts tracked.
Chomps's influencer activity by month
Number of sponsored posts
Chomps's influencer activity appears to have tapered over the year, from 113 posts in January down to 111 in December. March was the busiest month at 281 posts, 82% above the monthly average.
Social platforms breakdown
In our dataset (which only includes Instagram, YouTube, and TikTok), this is how the volume of Chomps's sponsored influencer collaborations break down by social platform:
- Instagram: 1.0k posts (54.5%)
- TikTok: 845 posts (45.5%)
Chomps's influencer activity by platform
Share of sponsored content by social network
Instagram influencer marketing is a clear focus for Chomps.
Here are 2 examples of Chomps's recent sponsored collaborations (one each for Instagram, TikTok).
teachertastes x Chomps
![Instagram post by @teachertastes for Chomps. Caption reads: [...] are getting shorter. Always grab for a....](https://images.od.modash.io/016fc5a674ada8c1d16e10ab49ae6872d599e319)
Influencer bio
Hi! I’m Becca Special Ed Teacher | Mom🩵 Meal Prep | Everyday Life 🥑✏️🛒🍎
Collaboration metrics
Get a free trial to find more data on influencer audiences, performance, and collaborations.
kadin_kerns x Chomps
Influencer bio
Yall need to smile more Kadin.kerns@cycle.media INSTA AND YOUTUBE
Collaboration metrics
Get a free trial to find more data on influencer audiences, performance, and collaborations.
If you break this down further by content type on Instagram, this is what it looks like:
- Reels: 86.6%
- Posts: 13.4%
💡 Related resource: How To Find Instagram Influencers.
Influencer audience size breakdown (by views)
For their top social platform (Instagram), here is a breakdown of the type of influencers Chomps are collaborating with, by audience size.
Note: this breakdown is based on each influencer's average views (not follower/subscriber count), because views typically correlate more closely with influencer pricing and impact.
Chomps's influencers average views (Instagram)
Based on each influencer's average views per post
With 32.4% of partnerships featuring creators averaging 10K-50K views, Chomps's strategy suggests cost-efficiency and engagement-focused partnerships.
Here is an example of a sponsored collaboration with a larger-audience creator on Instagram (1.0M avg views/post):
sarah_bee x Chomps
![Instagram post by @sarah_bee for Chomps. Caption reads: [...] we need a back to school stash of @chomps....](https://images.od.modash.io/accf6509c9a69e72622c13cdcfd99d88f9b5475f)
Influencer bio
Mom to 3✨ 28 | married to @derikbeeston Sharing family life & my favorites 🔗 Collabs: beestonfam@parkertalentmanagement.com
Collaboration metrics
Get a free trial to find more data on influencer audiences, performance, and collaborations.
And here is another example with a smaller creator on Instagram (9.8k avg views/post):
_cultlead3r_ x Chomps
![Instagram post by @_cultlead3r_ for Chomps. Caption reads: [...] Which one was your favourite? ✨ @Chomps....](https://images.od.modash.io/98f6be963fb9eb41a8c7da647d31f7bf17888054)
Influencer bio
Collaboration metrics
Get a free trial to find more data on influencer audiences, performance, and collaborations.
Chomps's repeat partnerships
Out of 1.3k unique influencers in our dataset, 40 of them (3%) posted content for Chomps in 3 or more separate calendar months. The most consistent partner is @restockmyhome, who has collaborated across 8 months with 16 total posts.
Here are 3 examples of Chomps's repeat influencer partnerships, with links to the sponsored content.
restockmyhome x Chomps
![Instagram post by @restockmyhome for Chomps. Caption reads: [...] candy box restock! 🕷️🎃🍬 #chompspartner....](https://images.od.modash.io/3565ac6c539c848caf2c86e5fc1b8b1012b86430)
![Instagram post by @restockmyhome for Chomps. Caption reads: [...] first week of back to school! #chompspartner....](https://images.od.modash.io/7576dab1ee567259130bdfaffdece1ef754b24ae)
![Instagram post by @restockmyhome for Chomps. Caption reads: [...] #halloweenrestock #chompspartner @chomps.](https://images.od.modash.io/5dcd1a75f4a78ea6e967a3ae930fd86bf804b546)
caitliniola x Chomps
![Instagram post by @caitliniola for Chomps. Caption reads: [...] #snackbox #satisfying #asmr #chompspartner....](https://images.od.modash.io/e7ff75578e16ee95db29c05a3ac3b76220c1b106)
![Instagram post by @caitliniola for Chomps. Caption reads: [...] #asmrsounds #restockasmr #chompspartner....](https://images.od.modash.io/e49fa89f28c6c2d1fcbf78b6140e27c2f08e912d)
![Instagram post by @caitliniola for Chomps. Caption reads: [...] #asmrsounds #satisfyingvideos #chompspartner....](https://images.od.modash.io/475b4e28fa86099d7fecc5164d78970ed3db3996)
caitliniola x Chomps
![TikTok post by @caitliniola for Chomps. Caption reads: [...] #asmrsounds #restockasmr #chompspartner....](https://images.od.modash.io/3c15c62434baa03077cb86d72e0278d710478777)
![TikTok post by @caitliniola for Chomps. Caption reads: [...] #satisfyingvideo #asmr #chompspartner....](https://images.od.modash.io/ca184e100ec6be2f64dc9581769c2e6c9af1d73e)
![TikTok post by @caitliniola for Chomps. Caption reads: [...] #snacks #restock #chompspartner @Chomps.](https://images.od.modash.io/e8d61769400af3622880b5e20c5493ae9d8aad93)
💡 Related resource: Long-Term Influencer Partnerships: Pros, Cons & How The Pros Manage Them.
Geographical breakdown
In our dataset, United States is where Chomps had the most influencer activity. 84.2% of their live influencer content in the last 12 months was posted by American influencers.
Based on the percentage of influencer content per market, other important markets include:
- Canada (3.8%)
- United Kingdom (3.4%)
- Brazil (2.3%)
Chomps's influencer activity by market
Here is another example of Chomps collaborating with an influencer in United States.
_catben_ x Chomps
![TikTok post by @_catben_ for Chomps. Caption reads: [...] 📦🚚🎅🏼🎄🎁 had to throw in some @Chomps....](https://images.od.modash.io/e2f99fb810b7e46178bcfc3c51b54db8c5ec63c8)
Chomps's influencer activity vs. related brands
Chomps competes for on-the-go snacking with CLIF BAR and Magic Spoon by targeting health-leaning consumers who discover new staples via fitness, wellness, and grocery-haul creators.
Total influencer content
Chomps vs. related brands influencer activity
Total sponsored posts tracked (last 12 months)
Magic Spoon leads with 2.4k sponsored posts, notably outpacing Chomps (1.9k posts) and CLIF BAR (536 posts). Across all three brands, the average volume is 1.6k posts, suggesting established influencer marketing investments.
By social platform
Chomps vs. related brands influencer activity (by social platform)
Sponsored posts by platform
Chomps leads on Instagram, while Magic Spoon has the most activity on TikTok and YouTube. The gap is most notable on TikTok, with Magic Spoon at 1.7k, Chomps at 845, CLIF BAR at 134 posts. CLIF BAR's activity is particularly concentrated on Instagram. On TikTok, Magic Spoon has 1745 posts, which is about double Chomps (845) and far above CLIF BAR (134).
By geographical market
Chomps vs. related brands influencer activity (by country)
Estimated sponsored posts in Chomps's top markets
Magic Spoon has the highest estimated sponsored-post volume in United States (1.8k posts, 73.4%), United Kingdom (170 posts, 7.1%), Canada (129 posts, 5.4%), suggesting a North America focus. Looking at United States specifically, the split is Magic Spoon at 1.8k posts (73.4%), Chomps at 1.6k posts (84.2%), CLIF BAR at 319 posts (59.5%).
Read more influencer strategy breakdowns
Looking for more like this? Here are 5 similar influencer marketing strategy breakdowns for other brands:
- CLIF BAR's Influencer Marketing Strategy
- Magic Spoon's Influencer Marketing Strategy
- SALT & STONE's Influencer Marketing Strategy
- New Era Cap's Influencer Marketing Strategy
- NOYZ's Influencer Marketing Strategy
Or, if you want to access data like this for your own software or processes, take a look at Modash's API products:
Frequently asked questions
Scaling your influencer program?
When you outgrow your mishmash of spreadsheets & free tools, try Modash. Find & email influencers, track campaigns, ship products & more - all in one place.