Magic Spoon Influencer Marketing Strategy
(2026 Data & Insights)
We analyzed 2.4k pieces of influencer content sponsored by Magic Spoon over the last 12 months.
This report breaks down where & how Magic Spoon invests in influencer marketing, which social platforms they prioritize, top geographical markets, and more.
The data in this report comes from Modash's Brand Collaborations API.
P.S. for a simple list of influencers who have collaborated with Magic Spoon, see here: Magic Spoon influencers.
Influencer activity throughout the year
Magic Spoon's influencer campaigns are active year-round with notable month-to-month fluctuation. The chart below shows month-by-month data for total sponsored posts tracked.
Magic Spoon's influencer activity by month
Number of sponsored posts
Magic Spoon's sponsored post volume appears to trend upward over the 12-month period, rising from 297 posts in January to 247 in December. The peak month, January, reached 297 posts, 49% higher than the monthly average of 199.
Social platforms breakdown
In our dataset (which only includes Instagram, YouTube, and TikTok), this is how the volume of Magic Spoon's sponsored influencer collaborations break down by social platform:
- TikTok: 1.7k posts (73%)
- Instagram: 340 posts (14.2%)
- YouTube: 307 posts (12.8%)
Magic Spoon's influencer activity by platform
Share of sponsored content by social network
TikTok influencer marketing is a clear focus for Magic Spoon.
Here are 3 examples of Magic Spoon's recent sponsored collaborations (one each for Instagram, TikTok, YouTube).
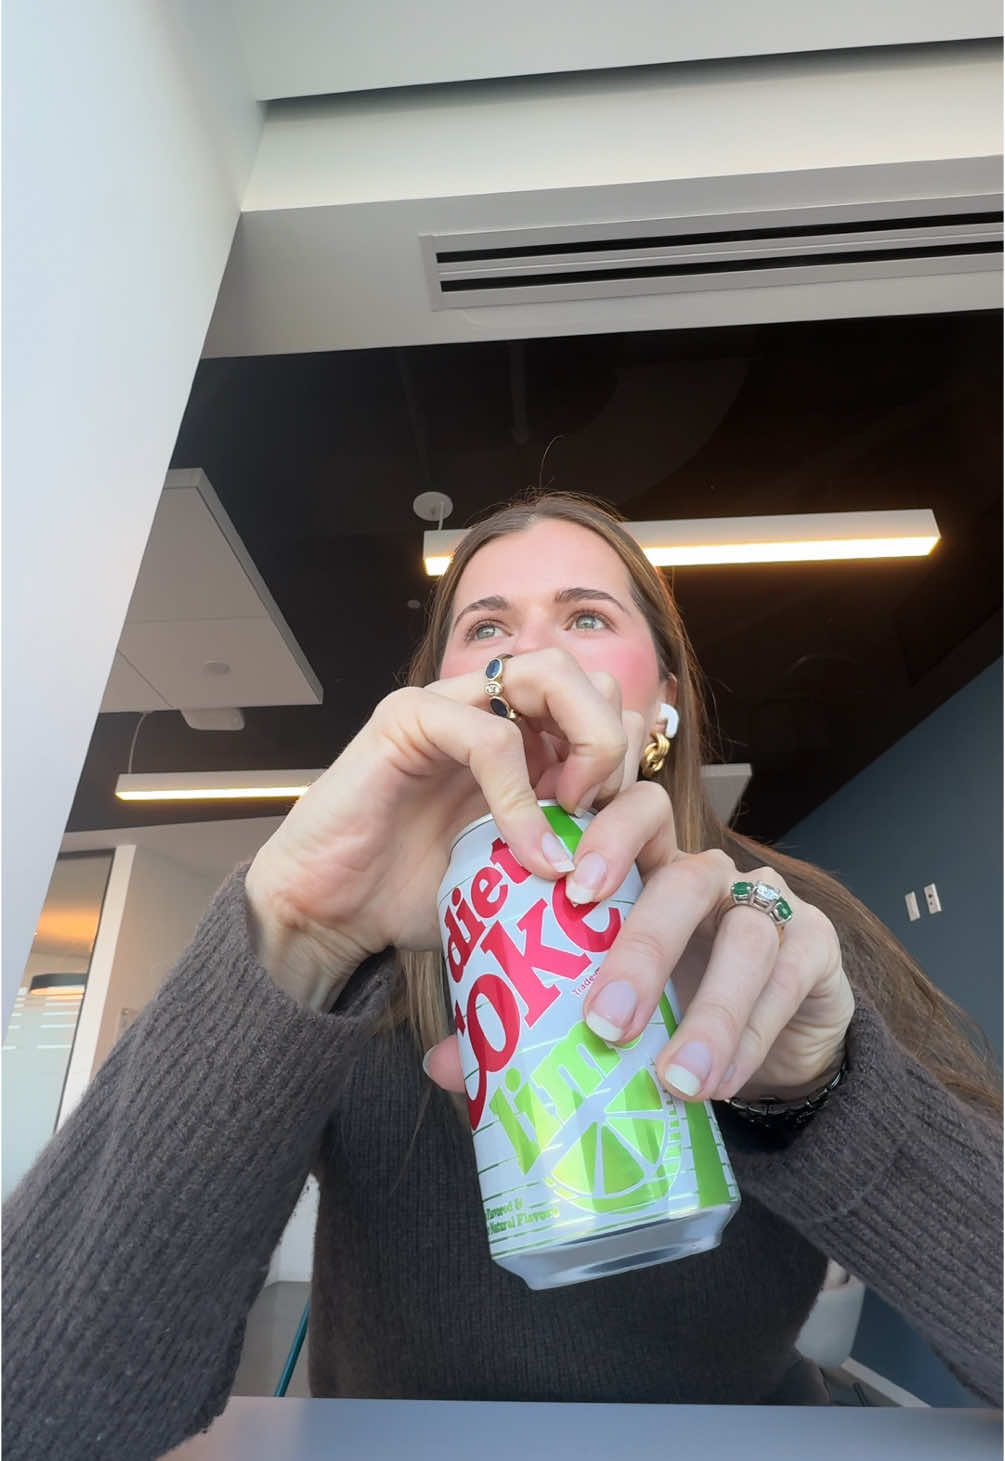
just.jueit x Magic Spoon
Influencer bio
📍NYC Flexibly discipline coaching for high-performing humans ⬇️ Strength. Endurance. Sustainability.
Collaboration metrics
Get a free trial to find more data on influencer audiences, performance, and collaborations.
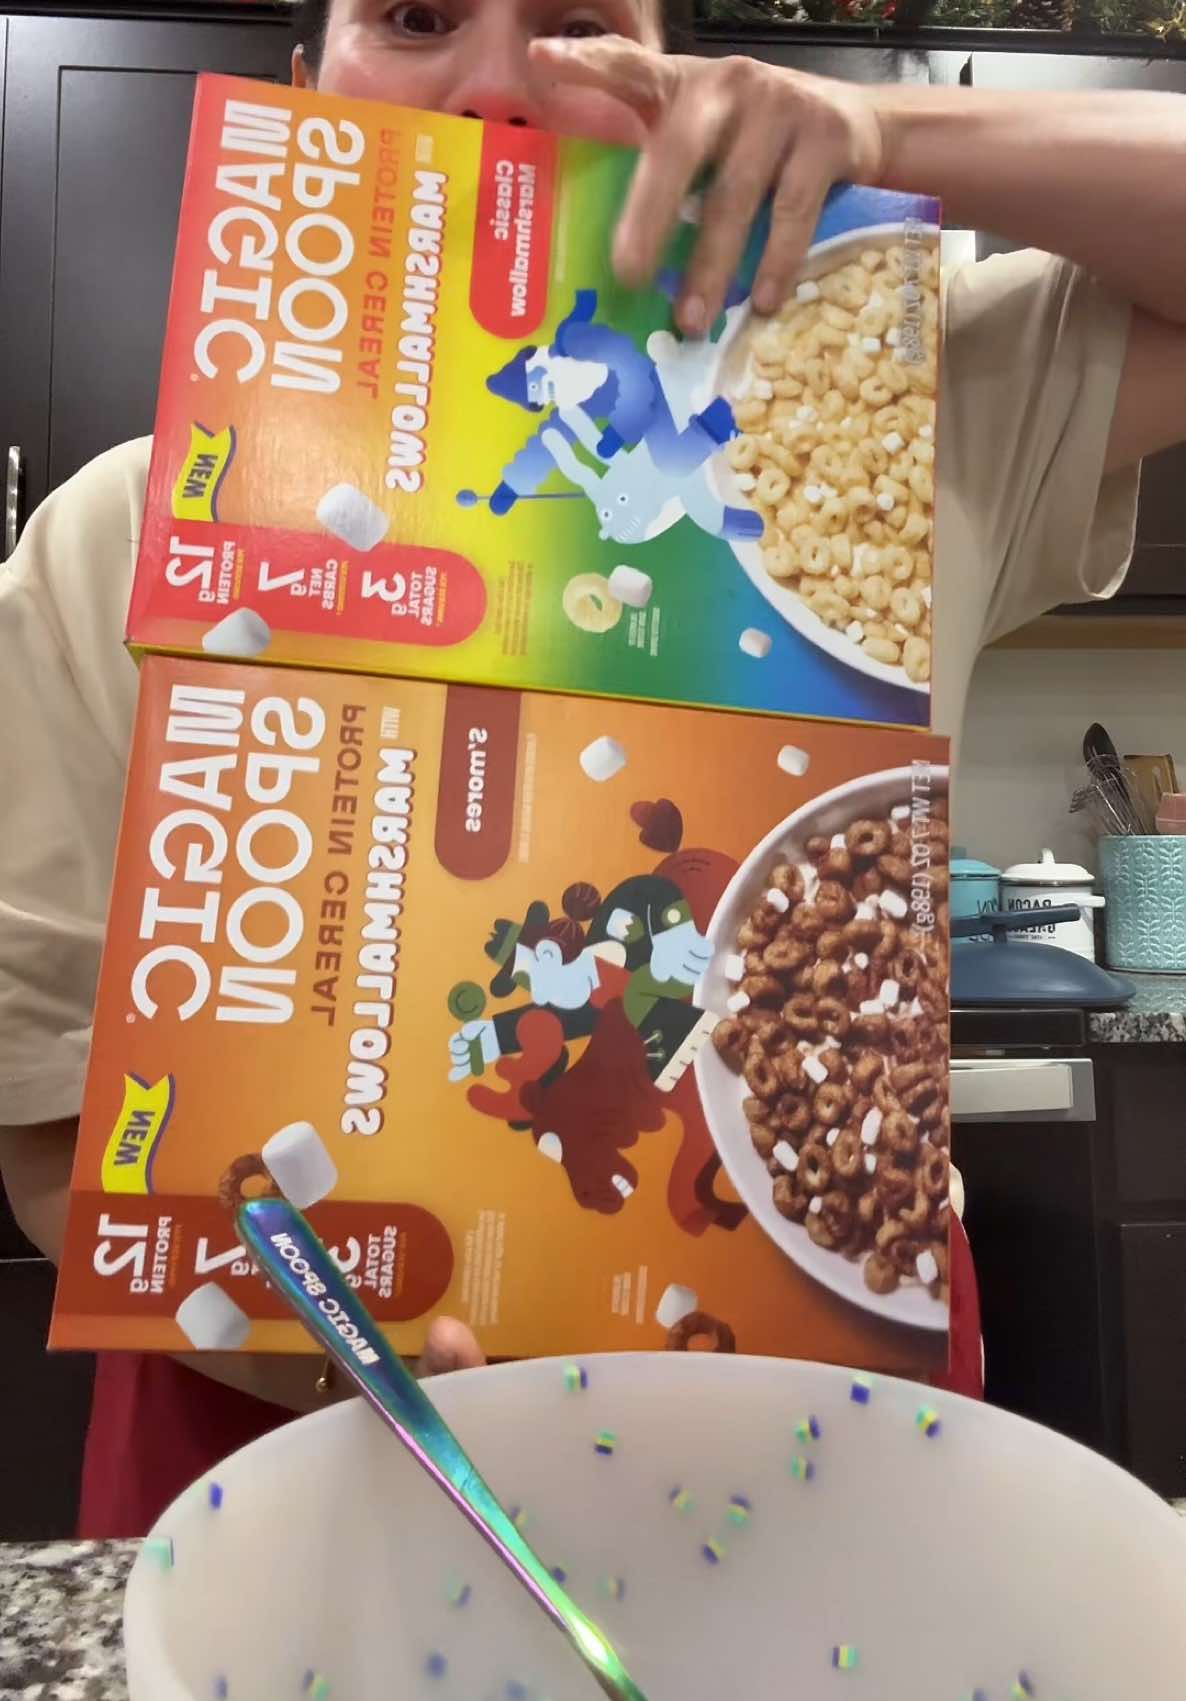
tiktok_shop_mama x Magic Spoon
Influencer bio
✨ Kids • Home • Lifestyle • School 💕 💕 Toys • Tumblers • Family • Games • Organize✨
Collaboration metrics
Get a free trial to find more data on influencer audiences, performance, and collaborations.
therealsamreid x Magic Spoon
![YouTube post by @therealsamreid for Magic Spoon. Caption reads: [...] code SAMREID at checkout, or look for Magic....](https://images.od.modash.io/06d1dd74b769d7fb837e6487a080d8e278cfad47)
Influencer bio
The feel-good variety show about food, travel, and the questions you didn't know you had. Interested in working together for brand partnerships or other opportunities? Email samreidproductions@gmail.com. Sam Reid is a fast food enthusiast, former Olympic hopeful, and your new biggest fan. He's also the host of the Studio Revue, which has been making life a little bit lighter since 2021. For free Studio Revue stickers, send a self-addressed stamped envelope to: Sam Reid Productions PO Box 199 Lexington, VA 24450 And just remember that even when it doesn't feel like it, it's going to be okay. I'll see you soon! Crisis Text Line (US): Text "hello" to 741-741 National Suicide Prevention Lifeline (US): 988 Nacional de Prevención del Suicidio (EEUU): 1-888-628-9454 More suicide prevention resources, including options for the deaf and hard of hearing: https://988lifeline.org/ International suicide prevention resources: https://www.befrienders.org/
Collaboration metrics
Get a free trial to find more data on influencer audiences, performance, and collaborations.
If you break this down further by content type on TikTok, this is what it looks like:
- Videos: 92.4%
- Carousels: 7.6%
💡 Related resource: How To Find TikTok Influencers.
Influencer audience size breakdown (by views)
For their top social platform (TikTok), here is a breakdown of the type of influencers Magic Spoon are collaborating with, by audience size.
Note: this breakdown is based on each influencer's average views (not follower/subscriber count), because views typically correlate more closely with influencer pricing and impact.
Magic Spoon's influencers average views (TikTok)
Based on each influencer's average views per post
With 61.3% of partnerships featuring creators averaging <1K views, Magic Spoon's strategy suggests niche targeting and authenticity, likely leveraging collaboration models like gifting and affiliates to work with smaller creators. Notably, there appears to be minimal activity in the 500K+ segment.
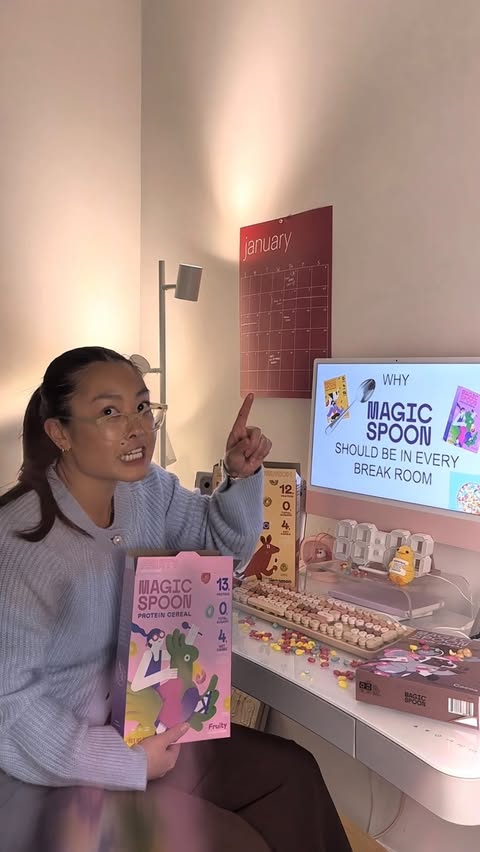
Here is an example of a sponsored collaboration with a larger-audience creator on TikTok (199.9k avg views/post):
_ryeh x Magic Spoon
Influencer bio
NYC corporate girl & office life probably snacking 💌ryanelizabeth.info@gmail.com
Collaboration metrics
Get a free trial to find more data on influencer audiences, performance, and collaborations.
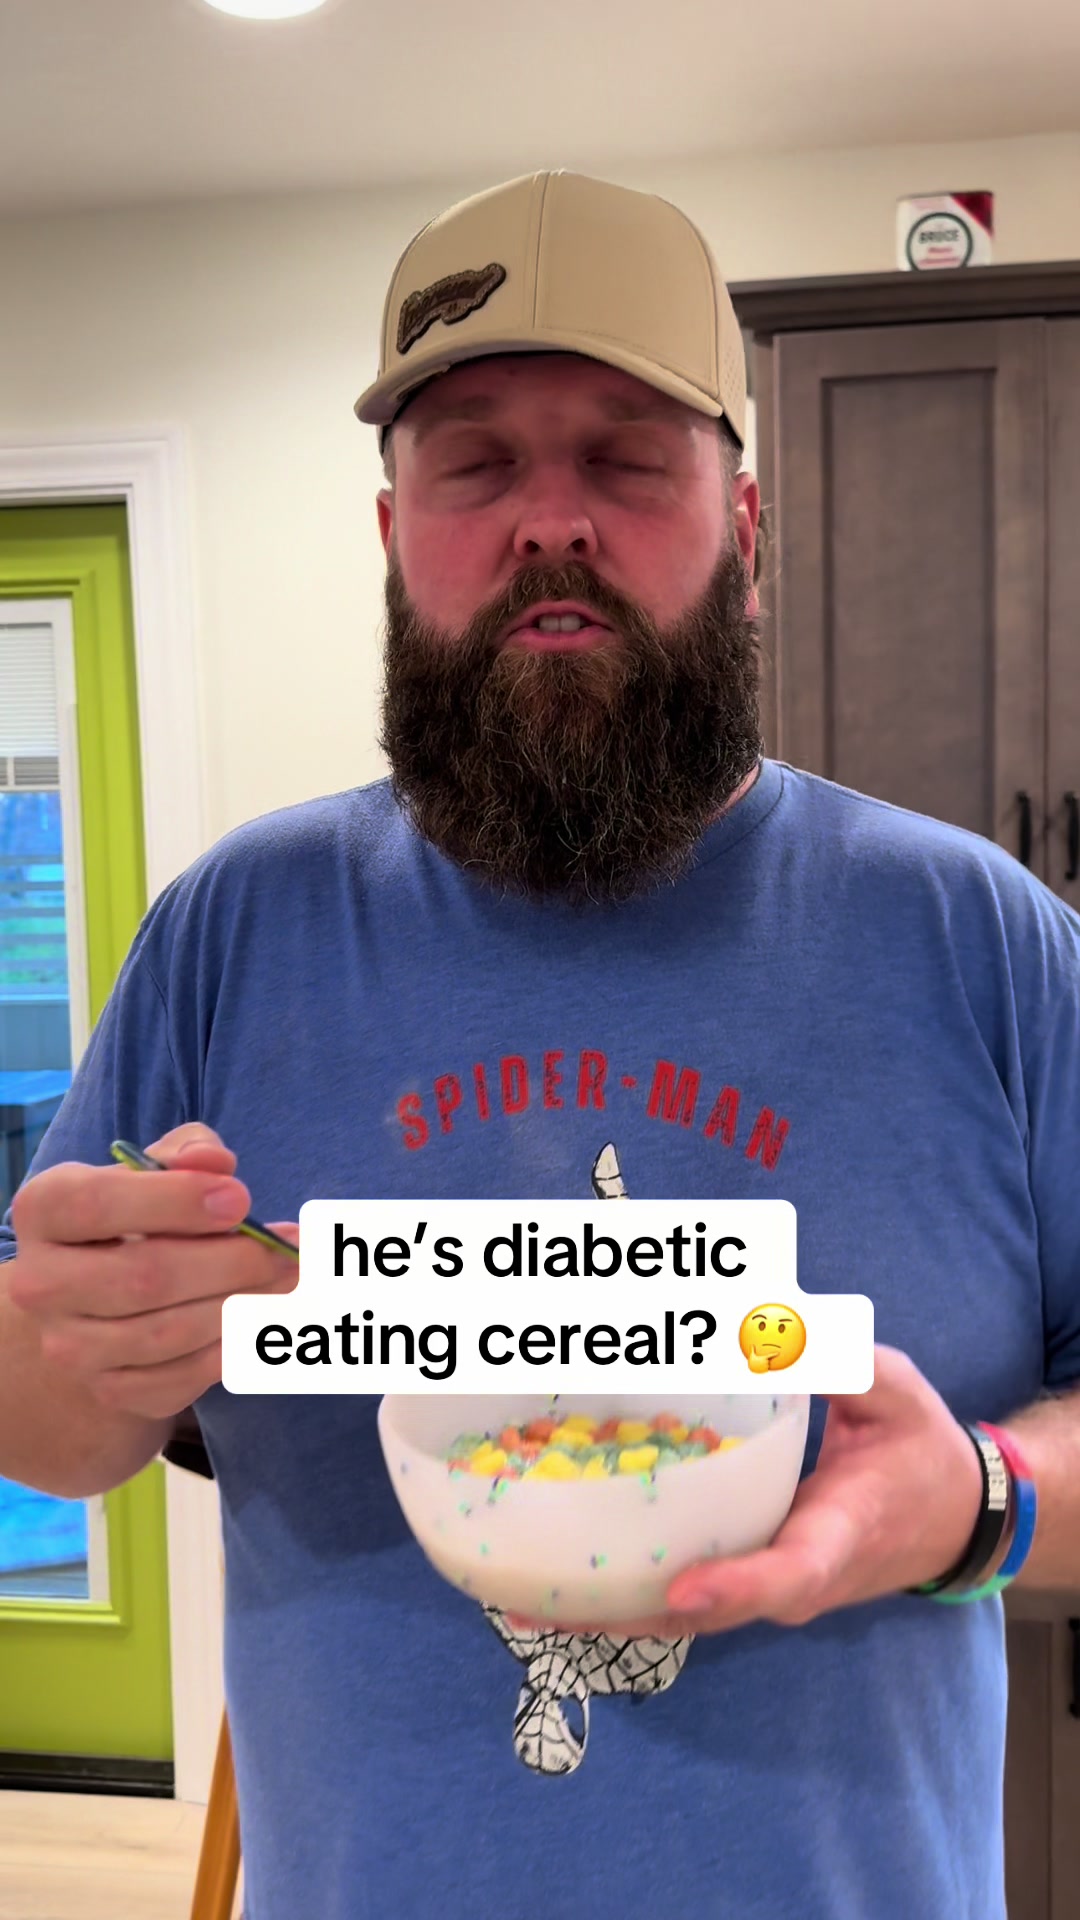
And here is another example with a smaller creator on TikTok (8.1k avg views/post):
beautyqueen_2024 x Magic Spoon
Influencer bio
Todo lo puedo en Cristo que me fortalece.
Collaboration metrics
Get a free trial to find more data on influencer audiences, performance, and collaborations.
Magic Spoon's repeat partnerships
Out of 1.4k unique influencers in our dataset, 61 of them (4%) posted content for Magic Spoon in 3 or more separate calendar months. The most consistent partner is @MurrayNJ08, who has collaborated across 11 months with 29 total posts.
Here are 3 examples of Magic Spoon's repeat influencer partnerships, with links to the sponsored content.
MurrayNJ08 x Magic Spoon
![YouTube post by @MurrayNJ08 for Magic Spoon. Caption reads: [...] taste like dirt? Try Magic Spoon Today with....](https://images.od.modash.io/e90a829b1363b4aaae1677f09ff6b32a2e3cb5b3)
![YouTube post by @MurrayNJ08 for Magic Spoon. Caption reads: [...] taste like dirt? Try Magic Spoon Today with....](https://images.od.modash.io/122123a013525dd1aded87a9f398154bb732a611)
![YouTube post by @MurrayNJ08 for Magic Spoon. Caption reads: [...] taste like dirt? Try Magic Spoon Today with....](https://images.od.modash.io/dc2e2a10a4696a6bfe255bdbf1d662fc0b9ff6d7)
glorifiedpaperpusher x Magic Spoon
![TikTok post by @glorifiedpaperpusher for Magic Spoon. Caption reads: [...] make sure you stock up ❤️ @Magic Spoon.](https://images.od.modash.io/f0388f0ed0e024a820ce036cc3041913b887e54d)
selfcarequeen.em x Magic Spoon
![TikTok post by @selfcarequeen.em for Magic Spoon. Caption reads: the new @Magic Spoon drop we didn’t know we [...].](https://images.od.modash.io/627b0e73ff40bb87c2ba49d6e59c0439ee8f9b2a)
![TikTok post by @selfcarequeen.em for Magic Spoon. Caption reads: [...] in their cereal?! @Magic Spoon....](https://images.od.modash.io/efd3c875b8bf93740c1c7d5c09abeaa72b18538e)
![TikTok post by @selfcarequeen.em for Magic Spoon. Caption reads: [...] #tiktokshopaprilrestock #magicspoon....](https://images.od.modash.io/808b7761f8ca5878b7ec391417215982dff91e65)
💡 Related resource: Long-Term Influencer Partnerships: Pros, Cons & How The Pros Manage Them.
Geographical breakdown
In our dataset, United States is where Magic Spoon had the most influencer activity. 73.4% of their live influencer content in the last 12 months was posted by American influencers.
Based on the percentage of influencer content per market, other important markets include:
- United Kingdom (7.1%)
- Canada (5.4%)
- India (3.2%)
Magic Spoon's influencer activity by market
Here is another example of Magic Spoon collaborating with an influencer in United States.
KPassionate x Magic Spoon
![YouTube post by @KPassionate for Magic Spoon. Caption reads: [...] KPASSIONATE at checkout, or look for Magic....](https://images.od.modash.io/71ddb7512494f17fbbdd741dc0da22e298ebeced)
Magic Spoon's influencer activity vs. related brands
Magic Spoon’s better-for-you breakfast positioning is adjacent to Kodiak Cakes and CLIF BAR, which compete for health-leaning, convenience-driven consumers via fitness, nutrition, and snack/breakfast routines.
Total influencer content
Magic Spoon vs. related brands influencer activity
Total sponsored posts tracked (last 12 months)
Magic Spoon leads with 2.4k sponsored posts, significantly outpacing Kodiak Cakes (1.6k posts) and CLIF BAR (536 posts). Across all three brands, the average volume is 1.5k posts, suggesting established influencer marketing investments.
By social platform
Magic Spoon vs. related brands influencer activity (by social platform)
Sponsored posts by platform
Magic Spoon leads on TikTok and YouTube, while Kodiak Cakes leads on Instagram. The gap is most notable on TikTok, with Magic Spoon at 1.7k, Kodiak Cakes at 704, CLIF BAR at 134 posts. Magic Spoon's activity is particularly concentrated on TikTok. Magic Spoon has far more TikTok posts than Kodiak Cakes and CLIF BAR.
By geographical market
Magic Spoon vs. related brands influencer activity (by country)
Estimated sponsored posts in Magic Spoon's top markets
Magic Spoon has the highest estimated sponsored-post volume in United States (1.8k posts, 73.4%), United Kingdom (170 posts, 7.1%), Canada (129 posts, 5.4%), suggesting a North America focus. Looking at United States specifically, the split is Magic Spoon at 1.8k posts (73.4%), Kodiak Cakes at 1.3k posts (82.5%), CLIF BAR at 319 posts (59.5%).
Read more influencer strategy breakdowns
Looking for more like this? Here are 5 similar influencer marketing strategy breakdowns for other brands:
- Kodiak Cakes's Influencer Marketing Strategy
- CLIF BAR's Influencer Marketing Strategy
- DKNY's Influencer Marketing Strategy
- currentbody's Influencer Marketing Strategy
- MuscleBlaze's Influencer Marketing Strategy
Or, if you want to access data like this for your own software or processes, take a look at Modash's API products:
Frequently asked questions
Scaling your influencer program?
When you outgrow your mishmash of spreadsheets & free tools, try Modash. Find & email influencers, track campaigns, ship products & more - all in one place.