EcoFlow Influencer Marketing Strategy
(2026 Data & Insights)
We analyzed 3.9k pieces of influencer content sponsored by EcoFlow over the last 12 months.
This report breaks down where & how EcoFlow invests in influencer marketing, which social platforms they prioritize, top geographical markets, and more.
The data in this report comes from Modash's Brand Collaborations API.
P.S. for a simple list of influencers who have collaborated with EcoFlow, see here: EcoFlow influencers.
Influencer activity throughout the year
EcoFlow's influencer campaigns are active year-round with notable month-to-month fluctuation. The chart below shows month-by-month data for total sponsored posts tracked.
EcoFlow's influencer activity by month
Number of sponsored posts
EcoFlow's sponsored post volume appears to trend upward over the 12-month period, rising from 335 posts in January to 416 in December. The peak month, November, reached 610 posts, 89% higher than the monthly average of 322.
Social platforms breakdown
In our dataset (which only includes Instagram, YouTube, and TikTok), this is how the volume of EcoFlow's sponsored influencer collaborations break down by social platform:
- TikTok: 1.8k posts (47.3%)
- YouTube: 1.1k posts (27.4%)
- Instagram: 981 posts (25.3%)
EcoFlow's influencer activity by platform
Share of sponsored content by social network
TikTok influencer marketing is a clear focus for EcoFlow.
Here are 3 examples of EcoFlow's recent sponsored collaborations (one each for Instagram, TikTok, YouTube).
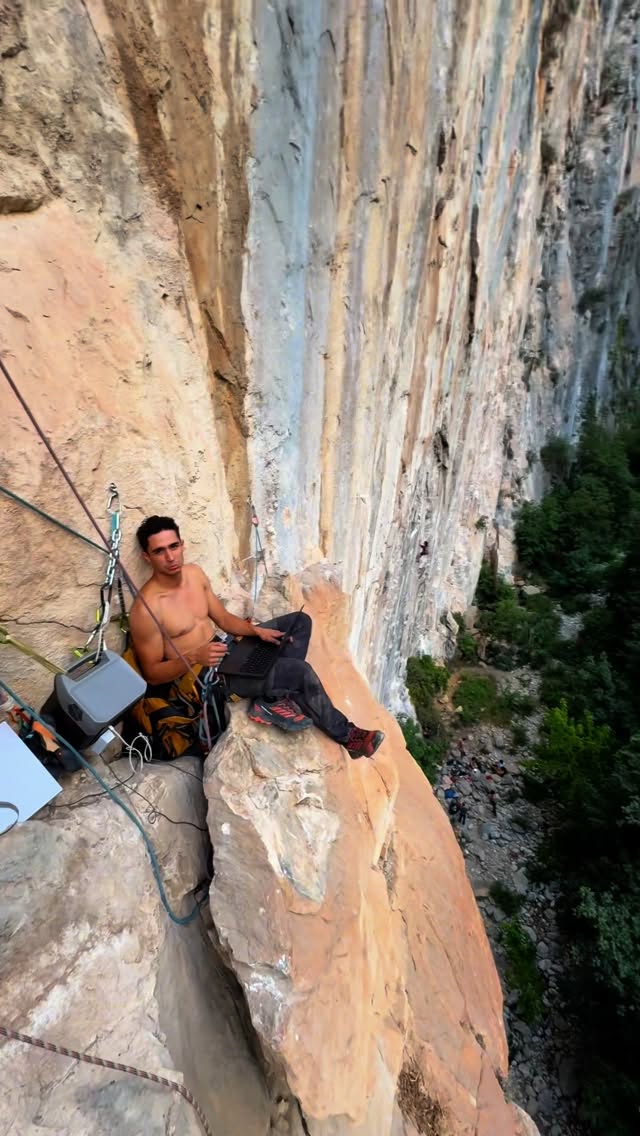
canabeibi x EcoFlow
Influencer bio
Mexican Climber & Photographer 🏳️🌈🇲🇽 🧗♀️ El Salto Nuevo León @mountain.bites.mx 🤘🏾
Collaboration metrics
Get a free trial to find more data on influencer audiences, performance, and collaborations.
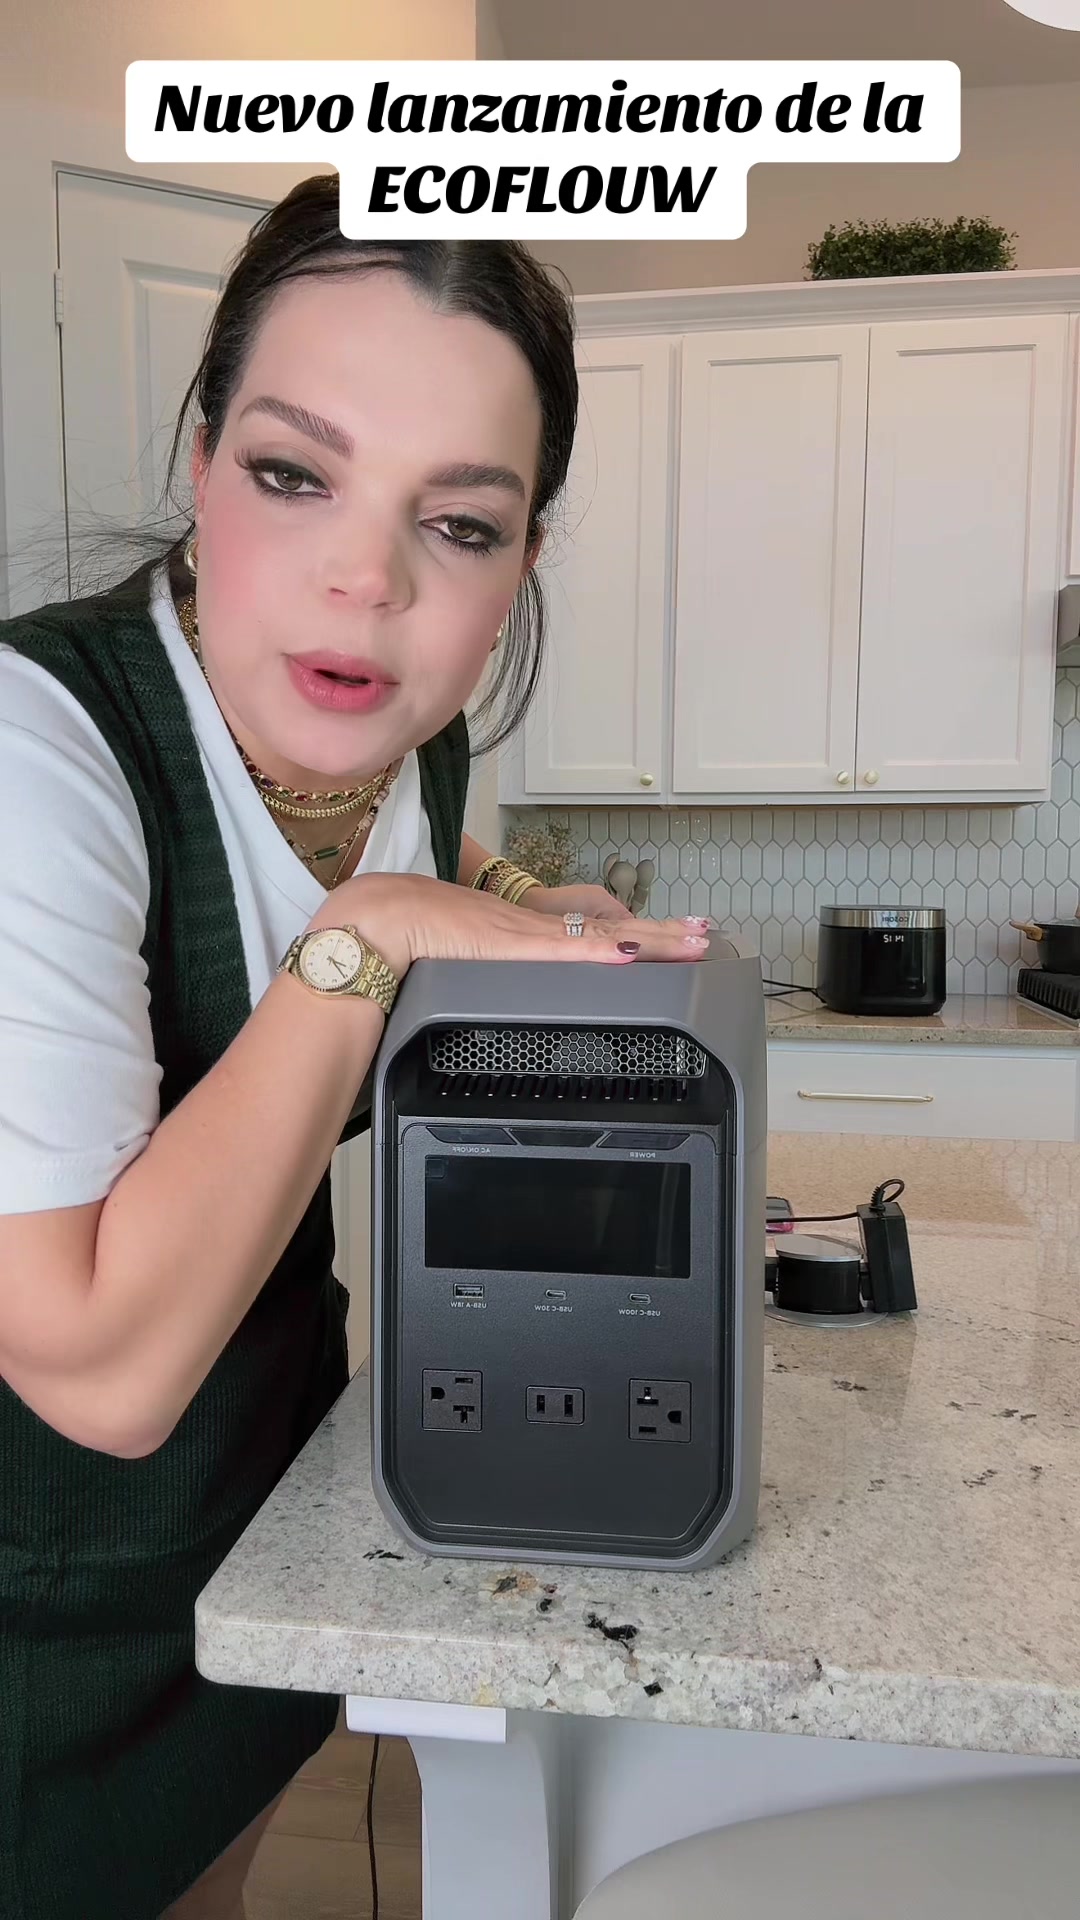
yaina1202 x EcoFlow
Influencer bio
LA FE ES LA CERTEZA DE LO QUE SE ESPERA LA CONVICCIÓN DE LO QUE NO SE VE ⬇️MÁS OFERTAS⬇️
Collaboration metrics
Get a free trial to find more data on influencer audiences, performance, and collaborations.
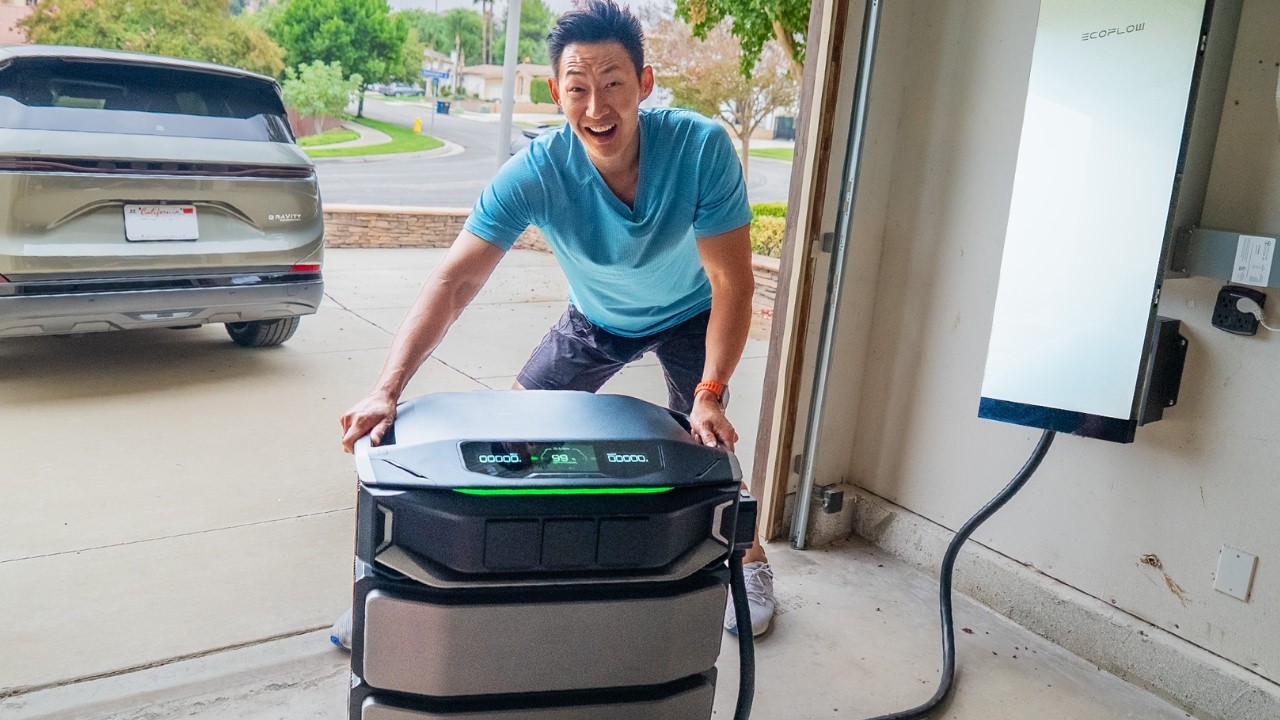
EverydayChris x EcoFlow
Influencer bio
Welcome to Everyday Chris!!! Your #1 place for TESLA, Electric Vehicles, TECH, and EVERYDAY LIFE Life can have its ups and downs. Some days are amazing, others.. not so much. Here at this channel, my goal is help make your lives easier at home and in your everyday life with technology! Make sure to Subscribe to the channel for new videos every week! For Brand Opportunites: everydaychrisofficial@gmail.com
Collaboration metrics
Get a free trial to find more data on influencer audiences, performance, and collaborations.
If you break this down further by content type on TikTok, this is what it looks like:
- Videos: 91%
- Carousels: 9%
💡 Related resource: How To Find TikTok Influencers.
Influencer audience size breakdown (by views)
For their top social platform (TikTok), here is a breakdown of the type of influencers EcoFlow are collaborating with, by audience size.
Note: this breakdown is based on each influencer's average views (not follower/subscriber count), because views typically correlate more closely with influencer pricing and impact.
EcoFlow's influencers average views (TikTok)
Based on each influencer's average views per post
With 42.5% of partnerships featuring creators averaging <1K views, EcoFlow's strategy suggests niche targeting and authenticity, likely leveraging collaboration models like gifting and affiliates to work with smaller creators.
Here is an example of a sponsored collaboration with a larger-audience creator on TikTok (209.6k avg views/post):
thereallifeguys x EcoFlow

Influencer bio
Wir veranstalten im August ein eigenes Festival 🛠🛁😂 Sei unbedingt mit dabei!
Collaboration metrics
Get a free trial to find more data on influencer audiences, performance, and collaborations.
And here is another example with a smaller creator on TikTok (9.7k avg views/post):
yorditrodriguez x EcoFlow
![TikTok post by @yorditrodriguez for EcoFlow. Caption reads: [...] tus proyectos y tu vida diaria con el....](https://images.od.modash.io/cf63f62a3a59f28aa928a744c999f40c18fd25cf)
Influencer bio
🔥 Productos virales, ofertas reales y hallazgos que valen la pena. Pruebo, comparo y te muestro lo mejor para comprar con confianza. 🚀🛒 🇨🇺🇺🇸
Collaboration metrics
Get a free trial to find more data on influencer audiences, performance, and collaborations.
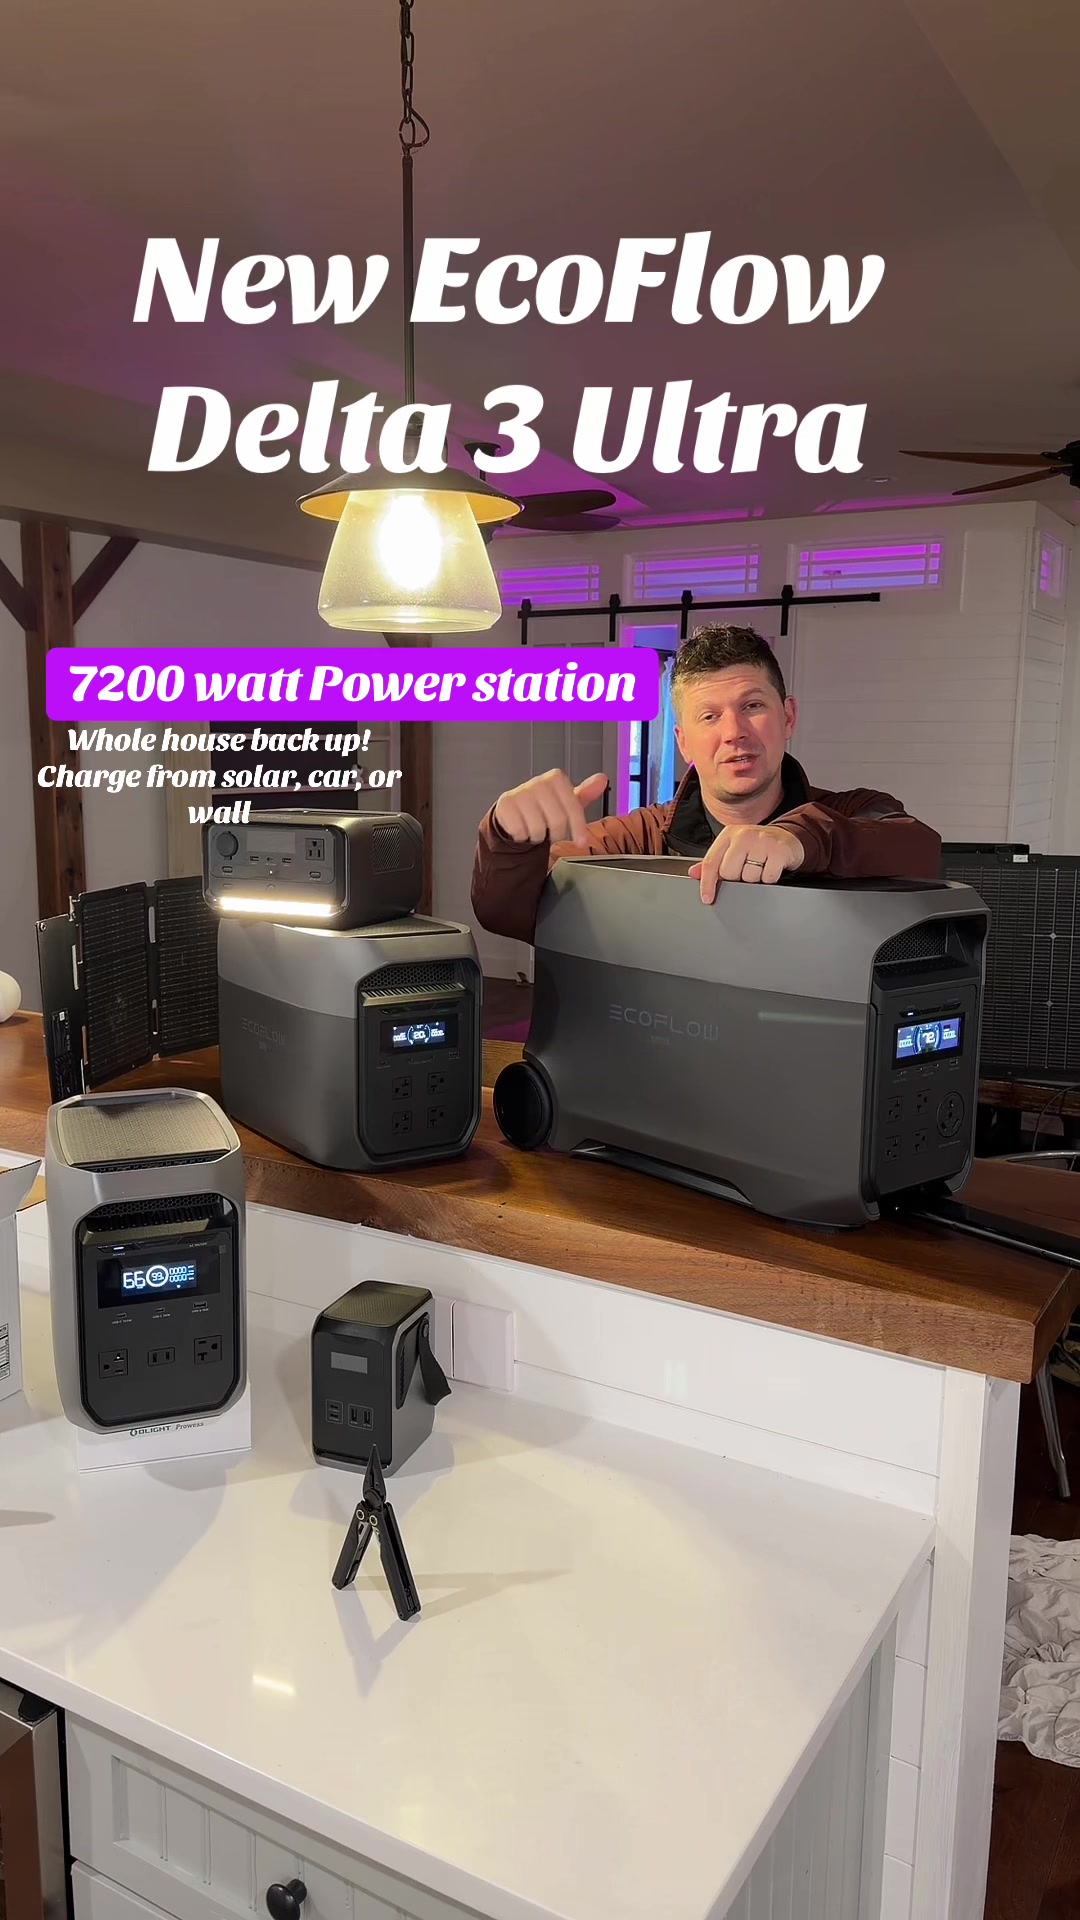
EcoFlow's repeat partnerships
Out of 1.4k unique influencers in our dataset, 114 of them (8%) posted content for EcoFlow in 3 or more separate calendar months. The most consistent partner is @how_to_dad, who has collaborated across 12 months with 184 total posts. @how_to_dad alone accounts for 5% of all tracked sponsored content.
Here are 3 examples of EcoFlow's repeat influencer partnerships, with links to the sponsored content.
how_to_dad x EcoFlow
![TikTok post by @how_to_dad for EcoFlow. Caption reads: [...] off grid living #delta3ultra #ecoflowdelta....](https://images.od.modash.io/17d6e43c52dcd73770cd71183b1f477122a42c39)
![TikTok post by @how_to_dad for EcoFlow. Caption reads: The Ecoflow Delta pro 3 quite literally [...].](https://images.od.modash.io/2caa993327f65329e6c44db7398a691ad1be8072)
thousandlanes x EcoFlow
![YouTube post by @thousandlanes for EcoFlow. Caption reads: [...] Race*: 10% discount at Ecoflow! Order via....](https://images.od.modash.io/b65e7032612a2f988482ca03bf7f7ab5088513e2)
![YouTube post by @thousandlanes for EcoFlow. Caption reads: [...] Race*: 10% Rabatt bei Ecoflow! Bestelle über....](https://images.od.modash.io/44c52fecfed6d42e42e0534d3372528a98b11cb6)
![YouTube post by @thousandlanes for EcoFlow. Caption reads: [...] Race*: 10% discount at Ecoflow! Order via....](https://images.od.modash.io/32197c1335b6468e1248021aeec64fa047f97b91)
sandrabosque99 x EcoFlow
![TikTok post by @sandrabosque99 for EcoFlow. Caption reads: Delta 3 Classic #ecoflow #portablepowerbank [...].](https://images.od.modash.io/cd4b7409a0d6e32c7677bd4a430783fbcbea281f)
![TikTok post by @sandrabosque99 for EcoFlow. Caption reads: Ecoflow 2 #ecoflow #portablepowerbank [...].](https://images.od.modash.io/bee4bbf08983c2ceb541e3dd09a660d37d2ec115)
![TikTok post by @sandrabosque99 for EcoFlow. Caption reads: Ecoflow Delta 3 classic con panel [...].](https://images.od.modash.io/016a240114a683edef4e6c683cb153d0a857de35)
💡 Related resource: Long-Term Influencer Partnerships: Pros, Cons & How The Pros Manage Them.
Geographical breakdown
In our dataset, United States is where EcoFlow had the most influencer activity. 24.6% of their live influencer content in the last 12 months was posted by American influencers.
Based on the percentage of influencer content per market, other important markets include:
- Japan (12.4%)
- Germany (9.4%)
- France (5.5%)
EcoFlow's influencer activity by market
Here is another example of EcoFlow collaborating with an influencer in United States.
jonrettinger x EcoFlow

EcoFlow's influencer activity vs. related brands
EcoFlow competes in portable power stations for camping, emergency backup, and off-grid lifestyles. Jackery and BLUETTI are direct category rivals targeting the same outdoor and preparedness audiences influenced by review and adventure creators.
Total influencer content
EcoFlow vs. related brands influencer activity
Total sponsored posts tracked (last 12 months)
EcoFlow leads with 3.9k sponsored posts, notably outpacing Jackery (3.1k posts) and BLUETTI (2.8k posts). Across all three brands, the average volume is 3.3k posts, indicating mature, scaled influencer programs.
By social platform
EcoFlow vs. related brands influencer activity (by social platform)
Sponsored posts by platform
EcoFlow leads on TikTok, while BLUETTI has the most activity on Instagram and Jackery has the most activity on YouTube. The gap is most notable on TikTok, with EcoFlow at 1.8k, BLUETTI at 682, Jackery at 612 posts. On TikTok, EcoFlow has 1830 posts, which is about three times Jackery’s 612 and nearly three times BLUETTI’s 682.
By geographical market
EcoFlow vs. related brands influencer activity (by country)
Estimated sponsored posts in EcoFlow's top markets
Jackery has the highest estimated sponsored-post volume in United States (1.4k posts, 44.1%), United Kingdom (291 posts, 9.3%), while EcoFlow has the highest estimated sponsored-post volume in Japan (480 posts, 12.4%), Germany (364 posts, 9.4%), while BLUETTI leads in France with 220 posts (8%). Looking at United States specifically, the split is Jackery at 1.4k posts (44.1%), BLUETTI at 1.1k posts (39.9%), EcoFlow at 953 posts (24.6%).
Read more influencer strategy breakdowns
Looking for more like this? Here are 5 similar influencer marketing strategy breakdowns for other brands:
- Jackery's Influencer Marketing Strategy
- BLUETTI's Influencer Marketing Strategy
- Lovevery's Influencer Marketing Strategy
- Native's Influencer Marketing Strategy
- First Aid Beauty's Influencer Marketing Strategy
Or, if you want to access data like this for your own software or processes, take a look at Modash's API products:
Frequently asked questions
Scaling your influencer program?
When you outgrow your mishmash of spreadsheets & free tools, try Modash. Find & email influencers, track campaigns, ship products & more - all in one place.