Feelingirl Influencer Marketing Strategy
(2026 Data & Insights)
We analyzed 26.8k pieces of influencer content sponsored by Feelingirl over the last 12 months.
This report breaks down where & how Feelingirl invests in influencer marketing, which social platforms they prioritize, top geographical markets, and more.
The data in this report comes from Modash's Brand Collaborations API.
P.S. for a simple list of influencers who have collaborated with Feelingirl, see here: Feelingirl influencers.
Influencer activity throughout the year
Feelingirl's influencer campaigns are active year-round with notable month-to-month fluctuation. The chart below shows month-by-month data for total sponsored posts tracked.
Feelingirl's influencer activity by month
Number of sponsored posts
Feelingirl's sponsored post volume appears to trend upward over the 12-month period, rising from 3.3k posts in January to 3.6k in December. The peak month, November, reached 3.8k posts, 69% higher than the monthly average of 2.2k.
Social platforms breakdown
In our dataset (which only includes Instagram, YouTube, and TikTok), this is how the volume of Feelingirl's sponsored influencer collaborations break down by social platform:
- TikTok: 24.6k posts (92%)
- Instagram: 2.2k posts (8%)
Feelingirl's influencer activity by platform
Share of sponsored content by social network
TikTok influencer marketing is a clear focus for Feelingirl.
Here are 2 examples of Feelingirl's recent sponsored collaborations (one each for Instagram, TikTok).
dyamondmyne x Feelingirl
![Instagram post by @dyamondmyne for Feelingirl. Caption reads: [...] the colors in stock nowwww sissss |....](https://images.od.modash.io/a7de44aa612d46662d4a4f699eb27a75a5b812be)
Influencer bio
🩷Mompreneur & Wife @ariyanaskloset 🎙️My Podcast @ihustleandjuggle 🩷400K YOUTUBE 🩷80K TikTok
Collaboration metrics
Get a free trial to find more data on influencer audiences, performance, and collaborations.
brittanybeeex x Feelingirl
Influencer bio
welcome to B's World 🙂↔️💕 Dallas, TX📍 💌 : brittanybeeinfo@gmail.com CEO of @BeePretty💕💄💋✨
Collaboration metrics
Get a free trial to find more data on influencer audiences, performance, and collaborations.
If you break this down further by content type on TikTok, this is what it looks like:
- Videos: 96.2%
- Carousels: 3.8%
💡 Related resource: How To Find TikTok Influencers.
Influencer audience size breakdown (by views)
For their top social platform (TikTok), here is a breakdown of the type of influencers Feelingirl are collaborating with, by audience size.
Note: this breakdown is based on each influencer's average views (not follower/subscriber count), because views typically correlate more closely with influencer pricing and impact.
Feelingirl's influencers average views (TikTok)
Based on each influencer's average views per post
With 51.1% of partnerships featuring creators averaging <1K views, Feelingirl's strategy suggests niche targeting and authenticity, likely leveraging collaboration models like gifting and affiliates to work with smaller creators.
Here is an example of a sponsored collaboration with a larger-audience creator on TikTok (2.1M avg views/post):
tessnogales x Feelingirl
![TikTok post by @tessnogales for Feelingirl. Caption reads: [...] under dresses. I look snattcchhhedd....](https://images.od.modash.io/de658dff97ae88a9957e7562033848f6d647834c)
Influencer bio
Shopaholic who posts daily ⋆˚✿24|UT✿˚⋆ @Tess tessnogales@gmail.com
Collaboration metrics
Get a free trial to find more data on influencer audiences, performance, and collaborations.
And here is another example with a smaller creator on TikTok (9.9k avg views/post):
katlee_333 x Feelingirl
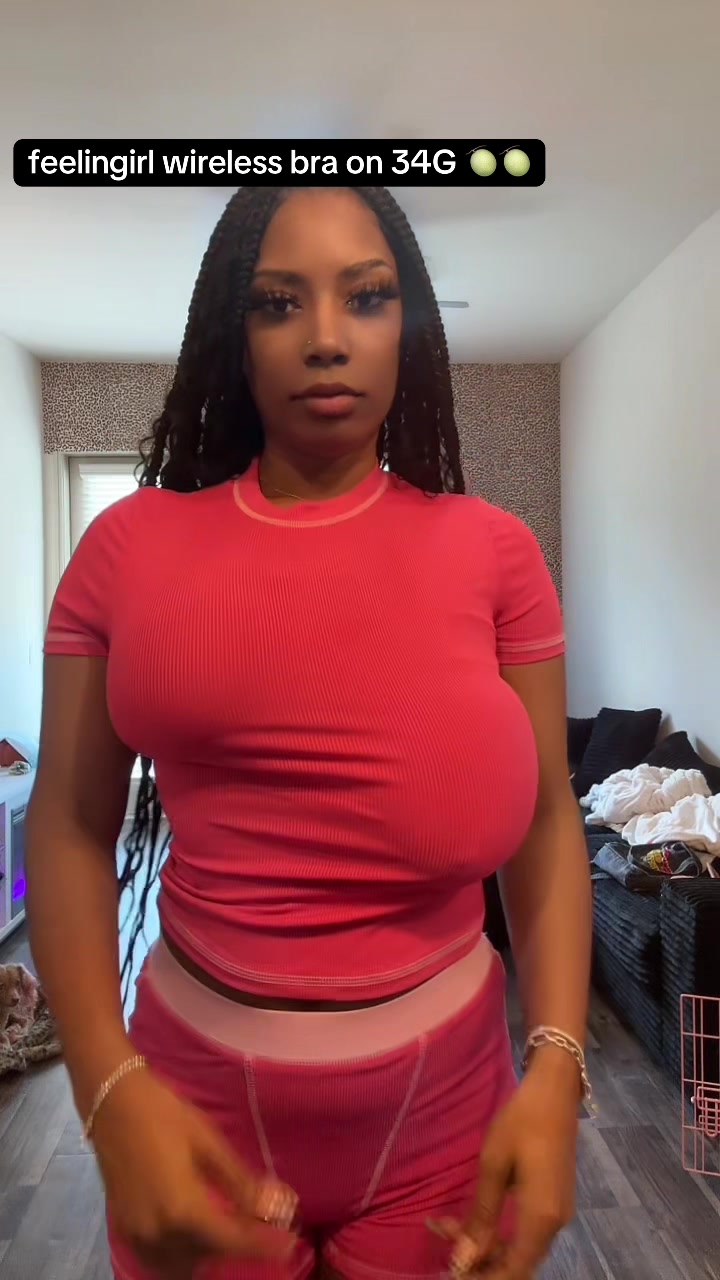
![TikTok post by @katlee_333 for Feelingirl. Caption reads: @FeelinGirl LLC #bra #tiktokshopcreatorpicks [...].](https://images.od.modash.io/55d81f251259a77b8c6db91d0acc7fe51f1de245)
Influencer bio
Beauty & Fashion Content Creator Fashion Inspo | Skincare | Makeup | Fragrance I Wigs Collabs/Promos: Info.Katlee12@gmal.com
Collaboration metrics
Get a free trial to find more data on influencer audiences, performance, and collaborations.
Feelingirl's repeat partnerships
Out of 9.6k unique influencers in our dataset, 1.3k of them (14%) posted content for Feelingirl in 3 or more separate calendar months. The most consistent partner is @mrsvaillancourt, who has collaborated across 11 months with 85 total posts.
Here are 3 examples of Feelingirl's repeat influencer partnerships, with links to the sponsored content.
mrsvaillancourt x Feelingirl
![TikTok post by @mrsvaillancourt for Feelingirl. Caption reads: The Feelingirl bodysuit is your new wardrobe [...].](https://images.od.modash.io/9dc1825c2ea0ef601c0fe6372eb785e3789978c1)
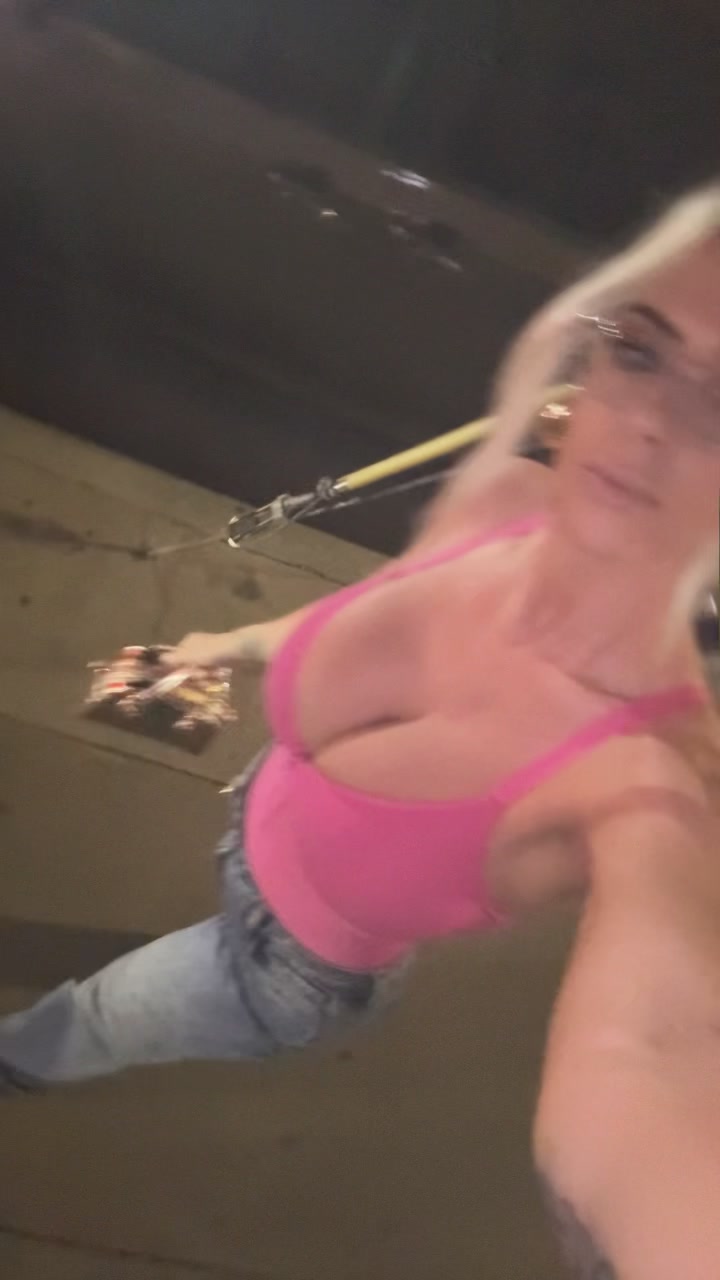
![TikTok post by @mrsvaillancourt for Feelingirl. Caption reads: [...] #SeamlessShapewear @FeelinGirl LLC.](https://images.od.modash.io/854c724ccb1fd6a52aac5e72b5c502662cc7fd2e)
tiff_tokz x Feelingirl
![TikTok post by @tiff_tokz for Feelingirl. Caption reads: @FeelinGirl LLC #feelingirl #bodysuit [...].](https://images.od.modash.io/2c99dc456247e58fc7b6448765bfc1aa61b13a2e)
![TikTok post by @tiff_tokz for Feelingirl. Caption reads: @FeelinGirl LLC #tiktokshopjumpstartsale [...].](https://images.od.modash.io/277beaf328e22a2f547a72574b19403beddf60d6)
![TikTok post by @tiff_tokz for Feelingirl. Caption reads: @FeelinGirl LLC #tiktokshopstockup [...].](https://images.od.modash.io/0b90cf887260e55c177a5c10e6646e8877868f44)
vallesjennifer80 x Feelingirl
![TikTok post by @vallesjennifer80 for Feelingirl. Caption reads: [...] this is super cute @FeelinGirl LLC....](https://images.od.modash.io/fcc13905f94bfd890923572022eaed282754a2ac)
![TikTok post by @vallesjennifer80 for Feelingirl. Caption reads: [...] yours while the sale last @FeelinGirl LLC....](https://images.od.modash.io/af6d96a8c29209d4bb7919b6a7ebf207885d72a7)
![TikTok post by @vallesjennifer80 for Feelingirl. Caption reads: [...] me with my stomach pains @FeelinGirl LLC....](https://images.od.modash.io/9170ee16a3fc01535828cbf24d230336d37f8d5a)
💡 Related resource: Long-Term Influencer Partnerships: Pros, Cons & How The Pros Manage Them.
Geographical breakdown
In our dataset, United States is where Feelingirl had the most influencer activity. 62.4% of their live influencer content in the last 12 months was posted by American influencers.
Based on the percentage of influencer content per market, other important markets include:
- United Kingdom (5.3%)
- Brazil (4.2%)
- Mexico (3.2%)
Feelingirl's influencer activity by market
Here is another example of Feelingirl collaborating with an influencer in United States.
errrcat x Feelingirl
![TikTok post by @errrcat for Feelingirl. Caption reads: [...] to @𝓓𝓸𝓻𝓲𝓼 𝓐𝓿𝓲𝓵𝓪-𝓒reator....](https://images.od.modash.io/0ff4e8257d730ee2a362e3fd8ef047971f7ba658)
Feelingirl's influencer activity vs. related brands
Feelingirl competes with Shapermint and Shapellx in shapewear and body-contouring basics where fit, comfort, and confidence messaging are central. Influencer try-ons and sizing education are key conversion drivers across all three brands.
Total influencer content
Feelingirl vs. related brands influencer activity
Total sponsored posts tracked (last 12 months)
Feelingirl leads with 26.8k sponsored posts, significantly outpacing Shapellx (10.8k posts) and Shapermint (1.9k posts). Across all three brands, the average volume is 13.2k posts, indicating mature, scaled influencer programs. Feelingirl has far more total posts than Shapermint and Shapellx.
By social platform
Feelingirl vs. related brands influencer activity (by social platform)
Sponsored posts by platform
Feelingirl leads on Instagram and TikTok, while Shapellx leads on YouTube. The gap is most notable on TikTok, with Feelingirl at 24.6k, Shapellx at 10.7k, Shapermint at 1k posts. Feelingirl's activity is particularly concentrated on TikTok. On TikTok, Feelingirl has far more posts than Shapermint and Shapellx.
By geographical market
Feelingirl vs. related brands influencer activity (by country)
Estimated sponsored posts in Feelingirl's top markets
Feelingirl has the highest estimated sponsored-post volume in United States (17k posts, 62.4%), United Kingdom (1.4k posts, 5.3%), Brazil (1.1k posts, 4.2%), while Shapellx leads in South Africa with 2.1k posts (19.9%), while Shapermint leads in Canada with 110 posts (5.7%). Looking at United States specifically, the split is Feelingirl at 17k posts (62.4%), Shapellx at 5.7k posts (52.8%), Shapermint at 1.4k posts (70.5%). Feelingirl's strength in United States and United Kingdom may indicate a home-market focus, while Shapellx shows broader regional investment.
Read more influencer strategy breakdowns
Looking for more like this? Here are 5 similar influencer marketing strategy breakdowns for other brands:
- Shapermint's Influencer Marketing Strategy
- Shapellx's Influencer Marketing Strategy
- Beauty Of Joseon's Influencer Marketing Strategy
- Goodr's Influencer Marketing Strategy
- Club L London's Influencer Marketing Strategy
Or, if you want to access data like this for your own software or processes, take a look at Modash's API products:
Frequently asked questions
Scaling your influencer program?
When you outgrow your mishmash of spreadsheets & free tools, try Modash. Find & email influencers, track campaigns, ship products & more - all in one place.