GORGIE Influencer Marketing Strategy
(2026 Data & Insights)
We analyzed 1.9k pieces of influencer content sponsored by GORGIE over the last 12 months.
This report breaks down where & how GORGIE invests in influencer marketing, which social platforms they prioritize, top geographical markets, and more.
The data in this report comes from Modash's Brand Collaborations API.
P.S. for a simple list of influencers who have collaborated with GORGIE, see here: GORGIE influencers.
Influencer activity throughout the year
GORGIE's influencer campaigns are active year-round with notable month-to-month fluctuation. The chart below shows month-by-month data for total sponsored posts tracked.
GORGIE's influencer activity by month
Number of sponsored posts
GORGIE's sponsored post volume appears to trend upward over the 12-month period, rising from 243 posts in January to 157 in December. The peak month, July, reached 273 posts, 74% higher than the monthly average of 157.
Social platforms breakdown
In our dataset (which only includes Instagram, YouTube, and TikTok), this is how the volume of GORGIE's sponsored influencer collaborations break down by social platform:
- TikTok: 1.9k posts (100%)
GORGIE's influencer activity by platform
Share of sponsored content by social network
TikTok influencer marketing is a clear focus for GORGIE.
Here are 1 examples of GORGIE's recent sponsored collaborations (one each for TikTok).
kaylagresh x GORGIE
Influencer bio
home & mom life🍓🧺🎀🌼 dfw, tx🌾 mama of 3 🤍 💌teamkayla@emeraldwoodsmgmt.com ⇣all links⇣
Collaboration metrics
Get a free trial to find more data on influencer audiences, performance, and collaborations.
If you break this down further by content type on TikTok, this is what it looks like:
- Videos: 95.5%
- Carousels: 4.5%
💡 Related resource: How To Find TikTok Influencers.
Influencer audience size breakdown (by views)
For their top social platform (TikTok), here is a breakdown of the type of influencers GORGIE are collaborating with, by audience size.
Note: this breakdown is based on each influencer's average views (not follower/subscriber count), because views typically correlate more closely with influencer pricing and impact.
GORGIE's influencers average views (TikTok)
Based on each influencer's average views per post
With 62.3% of partnerships featuring creators averaging <1K views, GORGIE's strategy suggests niche targeting and authenticity, likely leveraging collaboration models like gifting and affiliates to work with smaller creators.
Here is an example of a sponsored collaboration with a larger-audience creator on TikTok (188.8k avg views/post):
jordynjones x GORGIE
![TikTok post by @jordynjones for GORGIE. Caption reads: [...] life rn or is it just me 🤧 #erewhon....](https://images.od.modash.io/26cf3779c9b90eaf9836135612f0e4069ad25cf7)
Influencer bio
Thought Daughter. 💌 Jordyn@Night.co
Collaboration metrics
Get a free trial to find more data on influencer audiences, performance, and collaborations.
And here is another example with a smaller creator on TikTok (7.8k avg views/post):
dinaanp x GORGIE
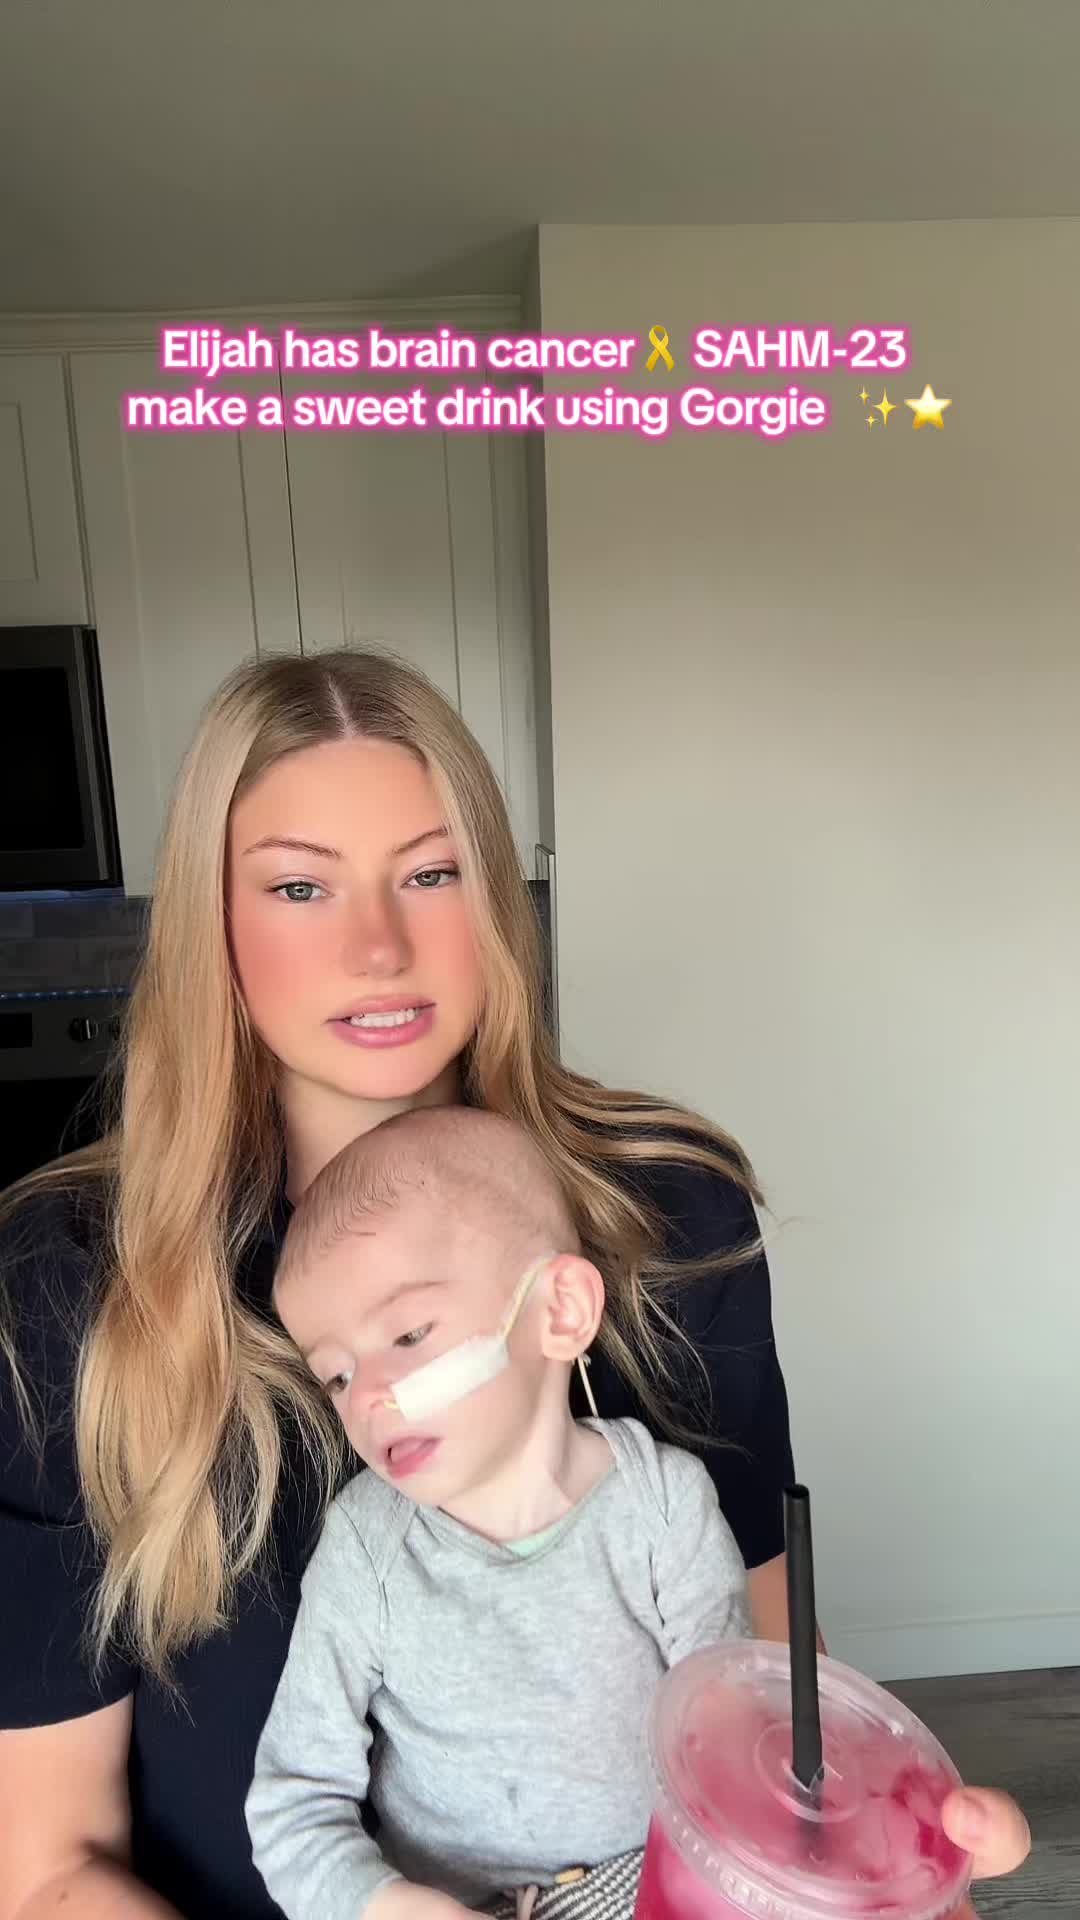
Influencer bio
SAHM| WA 👦🎗️medical mama 💌Email: dinaanp2222@gmail.com
Collaboration metrics
Get a free trial to find more data on influencer audiences, performance, and collaborations.
GORGIE's repeat partnerships
Out of 833 unique influencers in our dataset, 84 of them (10%) posted content for GORGIE in 3 or more separate calendar months. The most consistent partner is @brylie.j, who has collaborated across 10 months with 25 total posts.
Here are 3 examples of GORGIE's repeat influencer partnerships, with links to the sponsored content.
brylie.j x GORGIE
queen_ellle x GORGIE
![TikTok post by @queen_ellle for GORGIE. Caption reads: [...] and always you’re getting the Gorgie....](https://images.od.modash.io/d57a6559e7ecb2783095dbe76813bd8956d12c4f)
![TikTok post by @queen_ellle for GORGIE. Caption reads: [...] like 27 gifts ! one bag of 15 Gorgie glow....](https://images.od.modash.io/ea5b920d3361b617c7da7af74a22cb811e6f35ae)
![TikTok post by @queen_ellle for GORGIE. Caption reads: [...] yours today ! #holidayhustle #gorgiecrew....](https://images.od.modash.io/bd502557d46bcef7aef8f653a6c2d89577663b3e)
soulmuther0 x GORGIE
![TikTok post by @soulmutherllc for GORGIE. Caption reads: [...] tantrums, I deserve it. @GETGORGIE....](https://images.od.modash.io/ac2f50dcf213f0eec09b8e05569be1bc51f0109a)
![TikTok post by @soulmutherllc for GORGIE. Caption reads: [...] & no crash or headache 💖@GETGORGIE #gorgie....](https://images.od.modash.io/f63a696e4879961ba3f3eb0d7ab9c10547e40be2)
![TikTok post by @soulmutherllc for GORGIE. Caption reads: [...] sugar free 💖 amazing flavors....](https://images.od.modash.io/72a69e54fdff442650dff287e640119a66aede89)
💡 Related resource: Long-Term Influencer Partnerships: Pros, Cons & How The Pros Manage Them.
Geographical breakdown
In our dataset, United States is where GORGIE had the most influencer activity. 72.1% of their live influencer content in the last 12 months was posted by American influencers.
Based on the percentage of influencer content per market, other important markets include:
- United Kingdom (11.1%)
- Canada (6.3%)
- Philippines (5.6%)
GORGIE's influencer activity by market
Here is another example of GORGIE collaborating with an influencer in United States.
adigutierrezxoxo x GORGIE
![TikTok post by @adigutierrezxoxo for GORGIE. Caption reads: [...] a day when I’m cute and caffeinated ☕💖....](https://images.od.modash.io/7927e4996efad0dc902166f6a2dfd13f762fa9ee)
GORGIE's influencer activity vs. related brands
GORGIE competes in better-for-you functional beverages alongside Poppi and OLIPOP, which also rely on social buzz and lifestyle creators. They target similar consumers looking for tasty drinks with wellness-forward positioning.
Total influencer content
GORGIE vs. related brands influencer activity
Total sponsored posts tracked (last 12 months)
Poppi leads with 9.5k sponsored posts, significantly outpacing OLIPOP (5.9k posts) and GORGIE (1.9k posts). Across all three brands, the average volume is 5.8k posts, indicating mature, scaled influencer programs. GORGIE has multiple times fewer total posts than Poppi and OLIPOP.
By social platform
GORGIE vs. related brands influencer activity (by social platform)
Sponsored posts by platform
Among these brands, Poppi leads on Instagram and TikTok and OLIPOP leads on YouTube. The gap is most notable on TikTok, with Poppi at 6.7k, OLIPOP at 2.7k, GORGIE at 1.9k posts. GORGIE's activity is particularly concentrated on TikTok. On TikTok, GORGIE has multiple times fewer posts than Poppi.
By geographical market
GORGIE vs. related brands influencer activity (by country)
Estimated sponsored posts in GORGIE's top markets
Poppi has the highest estimated sponsored-post volume in United States (7.4k posts, 77.4%), Canada (630 posts, 6.6%), United Kingdom (420 posts, 4.4%), suggesting a North America focus. Looking at United States specifically, the split is Poppi at 7.4k posts (77.4%), OLIPOP at 4.8k posts (81.9%), GORGIE at 1.4k posts (72.1%).
Read more influencer strategy breakdowns
Looking for more like this? Here are 5 similar influencer marketing strategy breakdowns for other brands:
- Poppi's Influencer Marketing Strategy
- OLIPOP's Influencer Marketing Strategy
- Pacifica Beauty's Influencer Marketing Strategy
- Eva NYC's Influencer Marketing Strategy
- Beyond Yoga's Influencer Marketing Strategy
Or, if you want to access data like this for your own software or processes, take a look at Modash's API products:
Frequently asked questions
Scaling your influencer program?
When you outgrow your mishmash of spreadsheets & free tools, try Modash. Find & email influencers, track campaigns, ship products & more - all in one place.