JLab Influencer Marketing Strategy
(2026 Data & Insights)
We analyzed 10.7k pieces of influencer content sponsored by JLab over the last 12 months.
This report breaks down where & how JLab invests in influencer marketing, which social platforms they prioritize, top geographical markets, and more.
The data in this report comes from Modash's Brand Collaborations API.
P.S. for a simple list of influencers who have collaborated with JLab, see here: JLab influencers.
Influencer activity throughout the year
JLab's influencer marketing output shows strong seasonal variation, with some months seeing 3x or more activity than others. The chart below shows month-by-month data for total sponsored posts tracked.
JLab's influencer activity by month
Number of sponsored posts
JLab's sponsored post volume appears to trend upward over the 12-month period, rising from 792 posts in January to 1.5k in December. The peak month, November, reached 1.7k posts, 92% higher than the monthly average of 885.
Social platforms breakdown
In our dataset (which only includes Instagram, YouTube, and TikTok), this is how the volume of JLab's sponsored influencer collaborations break down by social platform:
- TikTok: 9.9k posts (92.5%)
- Instagram: 752 posts (7.1%)
- YouTube: 45 posts (0.4%)
JLab's influencer activity by platform
Share of sponsored content by social network
TikTok influencer marketing is a clear focus for JLab.
Here are 3 examples of JLab's recent sponsored collaborations (one each for Instagram, TikTok, YouTube).
maddiescherr x JLab
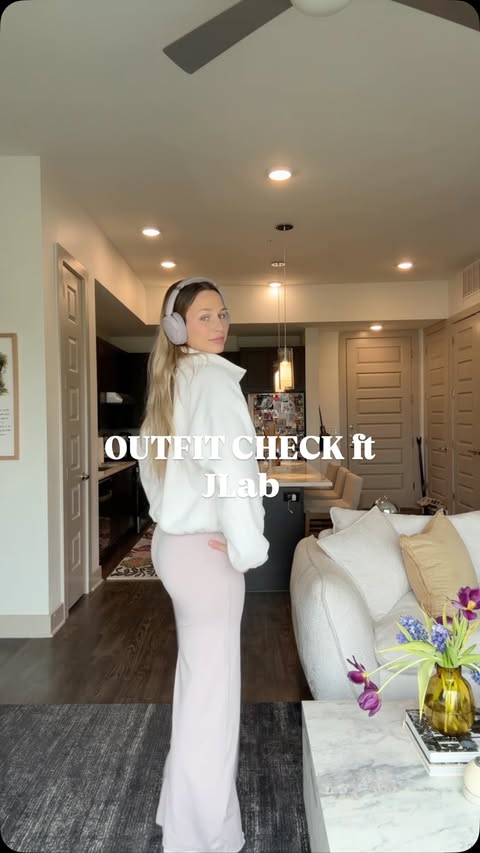
Influencer bio
1 peter 2:21 @madscharchives
Collaboration metrics
Get a free trial to find more data on influencer audiences, performance, and collaborations.
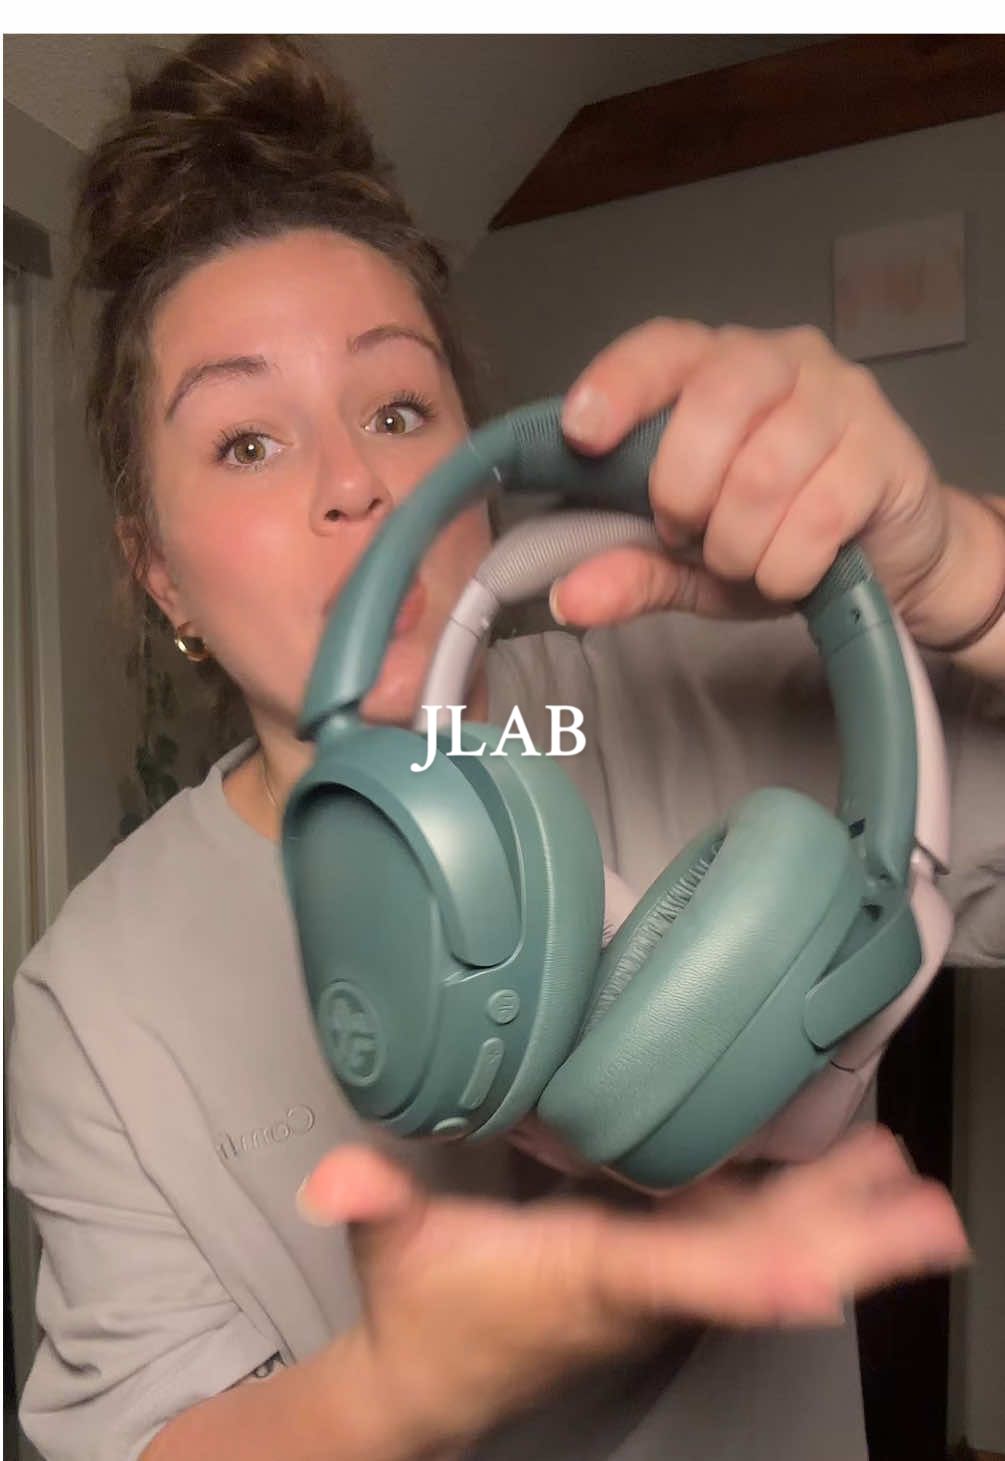
beautyintheblasphemy x JLab
![TikTok post by @beautyintheblasphemy for JLab. Caption reads: [...] check out the GO POP ANCs from @JLab #BFCM....](https://images.od.modash.io/27c18a1e0c6d59d85bee4ee6f086c2cfc8338bad)
Influencer bio
building a life in brazil 🇧🇷 where there are stronger legal protections for people like me. support via gofundme/cashapp/venmo + shop exclusive tees👇 link
Collaboration metrics
Get a free trial to find more data on influencer audiences, performance, and collaborations.
HasanMinhaj x JLab
Influencer bio
Subscribe and stay tuned for the latest from Hasan Minhaj right here. And don't worry -- you can still watch all episodes of Patriot Act with Hasan Minhaj on Netflix and find full episodes and digital exclusives including Deep Cuts at their new home on the Netflix is Joke channel (https://www.youtube.com/netflixisajoke).
Collaboration metrics
Get a free trial to find more data on influencer audiences, performance, and collaborations.
If you break this down further by content type on TikTok, this is what it looks like:
- Videos: 92%
- Carousels: 8%
💡 Related resource: How To Find TikTok Influencers.
Influencer audience size breakdown (by views)
For their top social platform (TikTok), here is a breakdown of the type of influencers JLab are collaborating with, by audience size.
Note: this breakdown is based on each influencer's average views (not follower/subscriber count), because views typically correlate more closely with influencer pricing and impact.
JLab's influencers average views (TikTok)
Based on each influencer's average views per post
With 65.9% of partnerships featuring creators averaging <1K views, JLab's strategy suggests niche targeting and authenticity, likely leveraging collaboration models like gifting and affiliates to work with smaller creators.
Here is an example of a sponsored collaboration with a larger-audience creator on TikTok (700.9k avg views/post):
laphytaphy x JLab
![TikTok post by @laphytaphy for JLab. Caption reads: [...] I consider this. It’s an office upgrade!....](https://images.od.modash.io/46460751b0a7cf2d7333e87a80b7d3b9d76066ec)
Influencer bio
God First. Cosmetologist/Culinary - CA🌵 Beauty-Home-Awkward. Laphybiz@gmail
Collaboration metrics
Get a free trial to find more data on influencer audiences, performance, and collaborations.
And here is another example with a smaller creator on TikTok (9.6k avg views/post):
x9anahi x JLab
Influencer bio
HOME FINDS TTS REVIEWS MAIN: @anahimariche25 Anahimariche@gmail.com
Collaboration metrics
Get a free trial to find more data on influencer audiences, performance, and collaborations.
JLab's repeat partnerships
Out of 4.3k unique influencers in our dataset, 443 of them (10%) posted content for JLab in 3 or more separate calendar months. The most consistent partner is @beautyintheblasphemy, who has collaborated across 12 months with 134 total posts.
Here are 3 examples of JLab's repeat influencer partnerships, with links to the sponsored content.
beautyintheblasphemy x JLab
![TikTok post by @beautyintheblasphemy for JLab. Caption reads: [...] and i could use your help… #jlab #headphones....](https://images.od.modash.io/d30f0b55a8c7fc5d83c0f2fb6178aa6113c0d0f4)
![TikTok post by @beautyintheblasphemy for JLab. Caption reads: [...] over-ear headphones from @JLab #bfcm....](https://images.od.modash.io/3203bb31b7be8db18db0400d0c9dc4c3cfe44b1e)
raisingbabyt x JLab
![TikTok post by @raisingbabyt for JLab. Caption reads: [...] headphones are on SALE 🎧 ! @JLab #jlab....](https://images.od.modash.io/f5073d616371006b8d5cf038468cb339ddc2ceec)
![TikTok post by @raisingbabyt for JLab. Caption reads: [...] and exclusive only on tts! 🤩 @JLab #jlab....](https://images.od.modash.io/bb8347afd65aa7b324c94e5f2c32a035779ccf9b)
kennyshopsalot x JLab
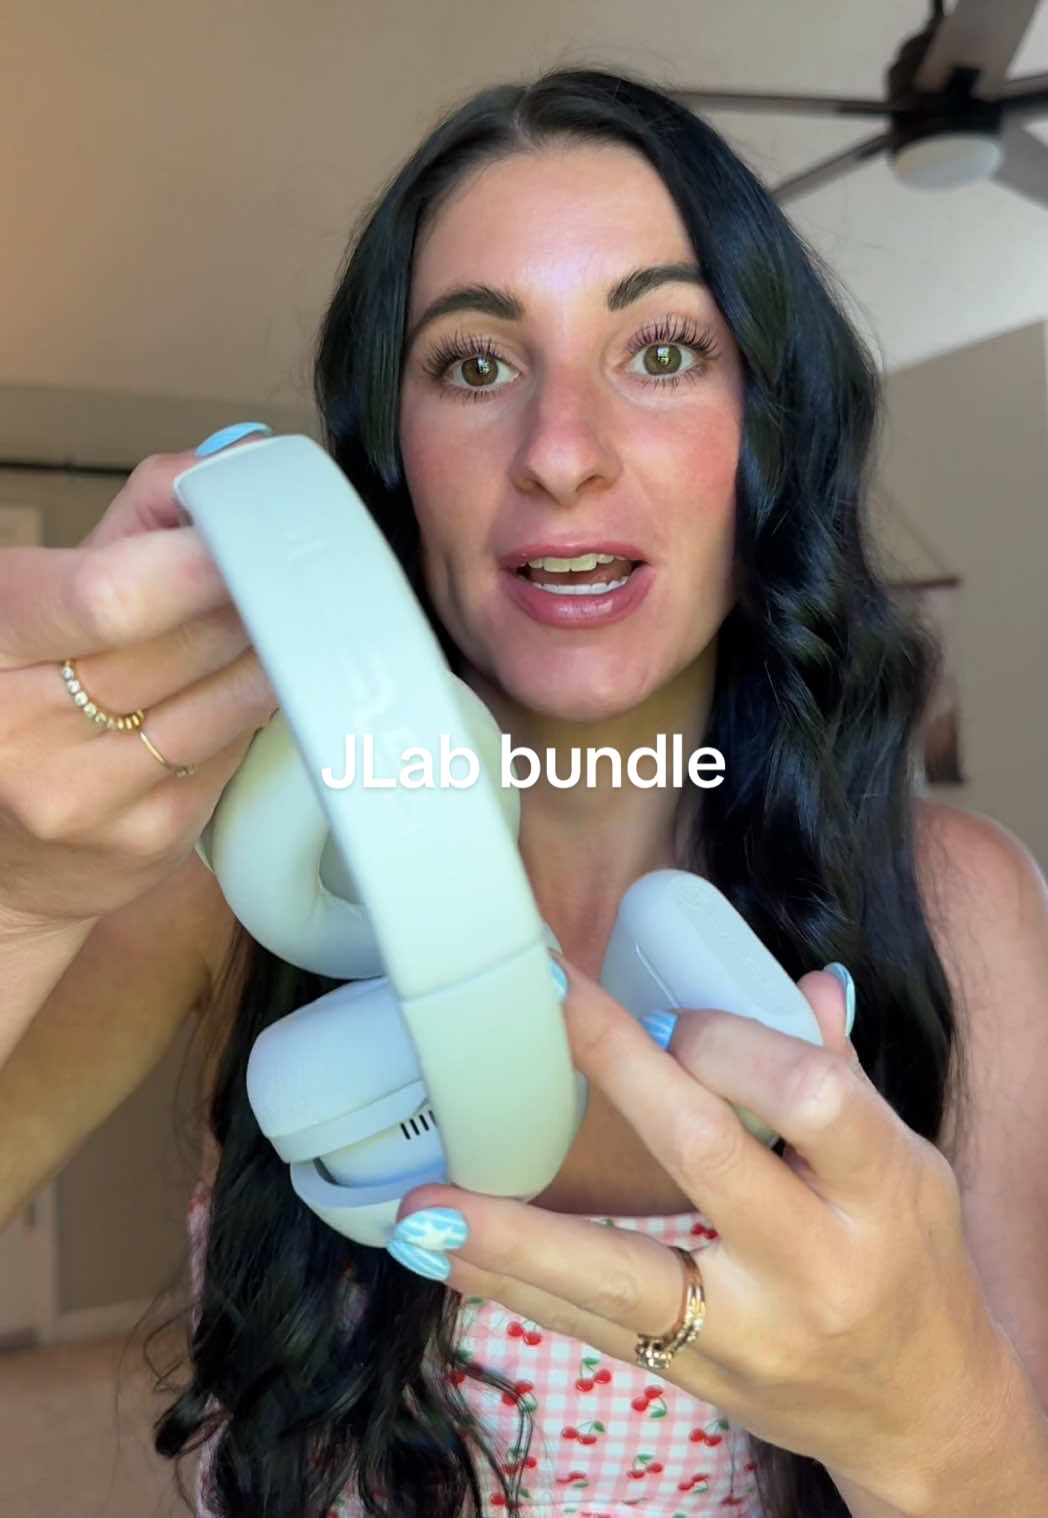
![TikTok post by @kennyshopsalot for JLab. Caption reads: [...] this bundle is so good rn 💫 @JLab #jlab....](https://images.od.modash.io/43284087faeb4eabe69c4b4c9d0704b5cdc90eee)
![TikTok post by @kennyshopsalot for JLab. Caption reads: [...] that keep the party going @JLab....](https://images.od.modash.io/573f3d7dca77646994f4fa1dd6a54f2df68ef708)
💡 Related resource: Long-Term Influencer Partnerships: Pros, Cons & How The Pros Manage Them.
Geographical breakdown
In our dataset, United States is where JLab had the most influencer activity. 64.8% of their live influencer content in the last 12 months was posted by American influencers.
Based on the percentage of influencer content per market, other important markets include:
- United Kingdom (5.6%)
- Taiwan (4.4%)
- India (3%)
JLab's influencer activity by market
Here is another example of JLab collaborating with an influencer in United States.
seasonaldiariess x JLab
JLab's influencer activity vs. related brands
JLab competes for value-to-mid audio buyers with Skullcandy and Shokz, all relying on creator reviews, lifestyle use-cases (gym/commute), and sound/comfort comparisons to drive purchase.
Total influencer content
JLab vs. related brands influencer activity
Total sponsored posts tracked (last 12 months)
JLab leads with 10.7k sponsored posts, notably outpacing Shokz (8.4k posts) and Skullcandy (2k posts). Across all three brands, the average volume is 7k posts, indicating mature, scaled influencer programs. JLab has multiple times more total posts than Skullcandy, and also exceeds Shokz.
By social platform
JLab vs. related brands influencer activity (by social platform)
Sponsored posts by platform
JLab leads on TikTok, while Shokz has the most activity on Instagram and YouTube. The gap is most notable on TikTok, with JLab at 9.9k, Shokz at 1.3k, Skullcandy at 669 posts. JLab's activity is particularly concentrated on TikTok. On Instagram, Shokz has multiple times more posts than JLab and Skullcandy, while on TikTok, JLab has multiple times more posts than Skullcandy and Shokz.
By geographical market
JLab vs. related brands influencer activity (by country)
Estimated sponsored posts in JLab's top markets
JLab has the highest estimated sponsored-post volume in United States (6.9k posts, 64.8%), United Kingdom (597 posts, 5.6%), Taiwan (469 posts, 4.4%), while Shokz has the highest estimated sponsored-post volume in Japan (1.1k posts, 12.9%), France (585 posts, 7%), while Skullcandy has the highest estimated sponsored-post volume in India (274 posts, 13.9%), Brazil (111 posts, 5.6%). Looking at United States specifically, the split is JLab at 6.9k posts (64.8%), Shokz at 2.2k posts (26.1%), Skullcandy at 717 posts (36.3%). JLab's strength in United States and United Kingdom may indicate a home-market focus, while Skullcandy shows broader regional investment.
Read more influencer strategy breakdowns
Looking for more like this? Here are 5 similar influencer marketing strategy breakdowns for other brands:
- Skullcandy's Influencer Marketing Strategy
- Shokz's Influencer Marketing Strategy
- Owala's Influencer Marketing Strategy
- Ulanzi's Influencer Marketing Strategy
- NOYZ's Influencer Marketing Strategy
Or, if you want to access data like this for your own software or processes, take a look at Modash's API products:
Frequently asked questions
Scaling your influencer program?
When you outgrow your mishmash of spreadsheets & free tools, try Modash. Find & email influencers, track campaigns, ship products & more - all in one place.