Kodiak Cakes Influencer Marketing Strategy
(2026 Data & Insights)
We analyzed 1.7k pieces of influencer content sponsored by Kodiak Cakes over the last 12 months.
This report breaks down where & how Kodiak Cakes invests in influencer marketing, which social platforms they prioritize, top geographical markets, and more.
The data in this report comes from Modash's Brand Collaborations API.
P.S. for a simple list of influencers who have collaborated with Kodiak Cakes, see here: Kodiak Cakes influencers.
Influencer activity throughout the year
Kodiak Cakes's influencer campaigns are active year-round with notable month-to-month fluctuation. The chart below shows month-by-month data for total sponsored posts tracked.
Kodiak Cakes's influencer activity by month
Number of sponsored posts
Kodiak Cakes's influencer output appears relatively consistent throughout the year, averaging about 138 sponsored posts per month. August recorded the highest volume at 194 posts (41% above average), while June was the quietest at 64 posts.
Social platforms breakdown
In our dataset (which only includes Instagram, YouTube, and TikTok), this is how the volume of Kodiak Cakes's sponsored influencer collaborations break down by social platform:
- Instagram: 856 posts (51.7%)
- TikTok: 699 posts (42.2%)
- YouTube: 101 posts (6.1%)
Kodiak Cakes's influencer activity by platform
Share of sponsored content by social network
Instagram influencer marketing is a clear focus for Kodiak Cakes.
Here are 3 examples of Kodiak Cakes's recent sponsored collaborations (one each for Instagram, TikTok, YouTube).
witneycarson x Kodiak Cakes
![Instagram post by @witneycarson for Kodiak Cakes. Caption reads: [...] Tango this week? I fueled up with....](https://images.od.modash.io/3958390f926d5c540f0a1e9f9db27a2b0e376791)
Influencer bio
✨ Emmy nominee 🏆 2X Mirrorball Champ on DWTS ❤️🔥 Wife to @carson.mcallister 💌 witneycarsonteam@unitedtalent.com
Collaboration metrics
Get a free trial to find more data on influencer audiences, performance, and collaborations.
witneycarsonofficial x Kodiak Cakes
![TikTok post by @witneycarsonofficial for Kodiak Cakes. Caption reads: [...] for the first day of school! @KodiakCakes....](https://images.od.modash.io/f423e325e9238415939170516f99b36ed0198371)
Influencer bio
Dancer, choreographer, mama ✨🥰 💌witneycarsonteam@unitedtalent.com
Collaboration metrics
Get a free trial to find more data on influencer audiences, performance, and collaborations.
ClimbingGold x Kodiak Cakes
![YouTube post by @ClimbingGold for Kodiak Cakes. Caption reads: [...] Series at www.thenorthface.com. Kodiak Cakes....](https://images.od.modash.io/9618cd4825183cb92cdca4cfaf7217395f643f79)
Influencer bio
When climbing was a fringe sport, the epic tales of achievement were told around the campfire. As the sport continues to grow, Alex Honnold and co-host Fitz Cahall grab the mic to share stories from the people who define climbing by pushing the boundaries and challenging the status quo of the previous generation. Full episodes and snippets from our conversations with some of climbing's biggest names.
Collaboration metrics
Get a free trial to find more data on influencer audiences, performance, and collaborations.
If you break this down further by content type on Instagram, this is what it looks like:
- Reels: 86.8%
- Posts: 13.2%
💡 Related resource: How To Find Instagram Influencers.
Influencer audience size breakdown (by views)
For their top social platform (Instagram), here is a breakdown of the type of influencers Kodiak Cakes are collaborating with, by audience size.
Note: this breakdown is based on each influencer's average views (not follower/subscriber count), because views typically correlate more closely with influencer pricing and impact.
Kodiak Cakes's influencers average views (Instagram)
Based on each influencer's average views per post
With 33.7% of partnerships featuring creators averaging 10K-50K views, Kodiak Cakes's strategy suggests cost-efficiency and engagement-focused partnerships.
Here is an example of a sponsored collaboration with a larger-audience creator on Instagram (609.0k avg views/post):
rrayyme x Kodiak Cakes
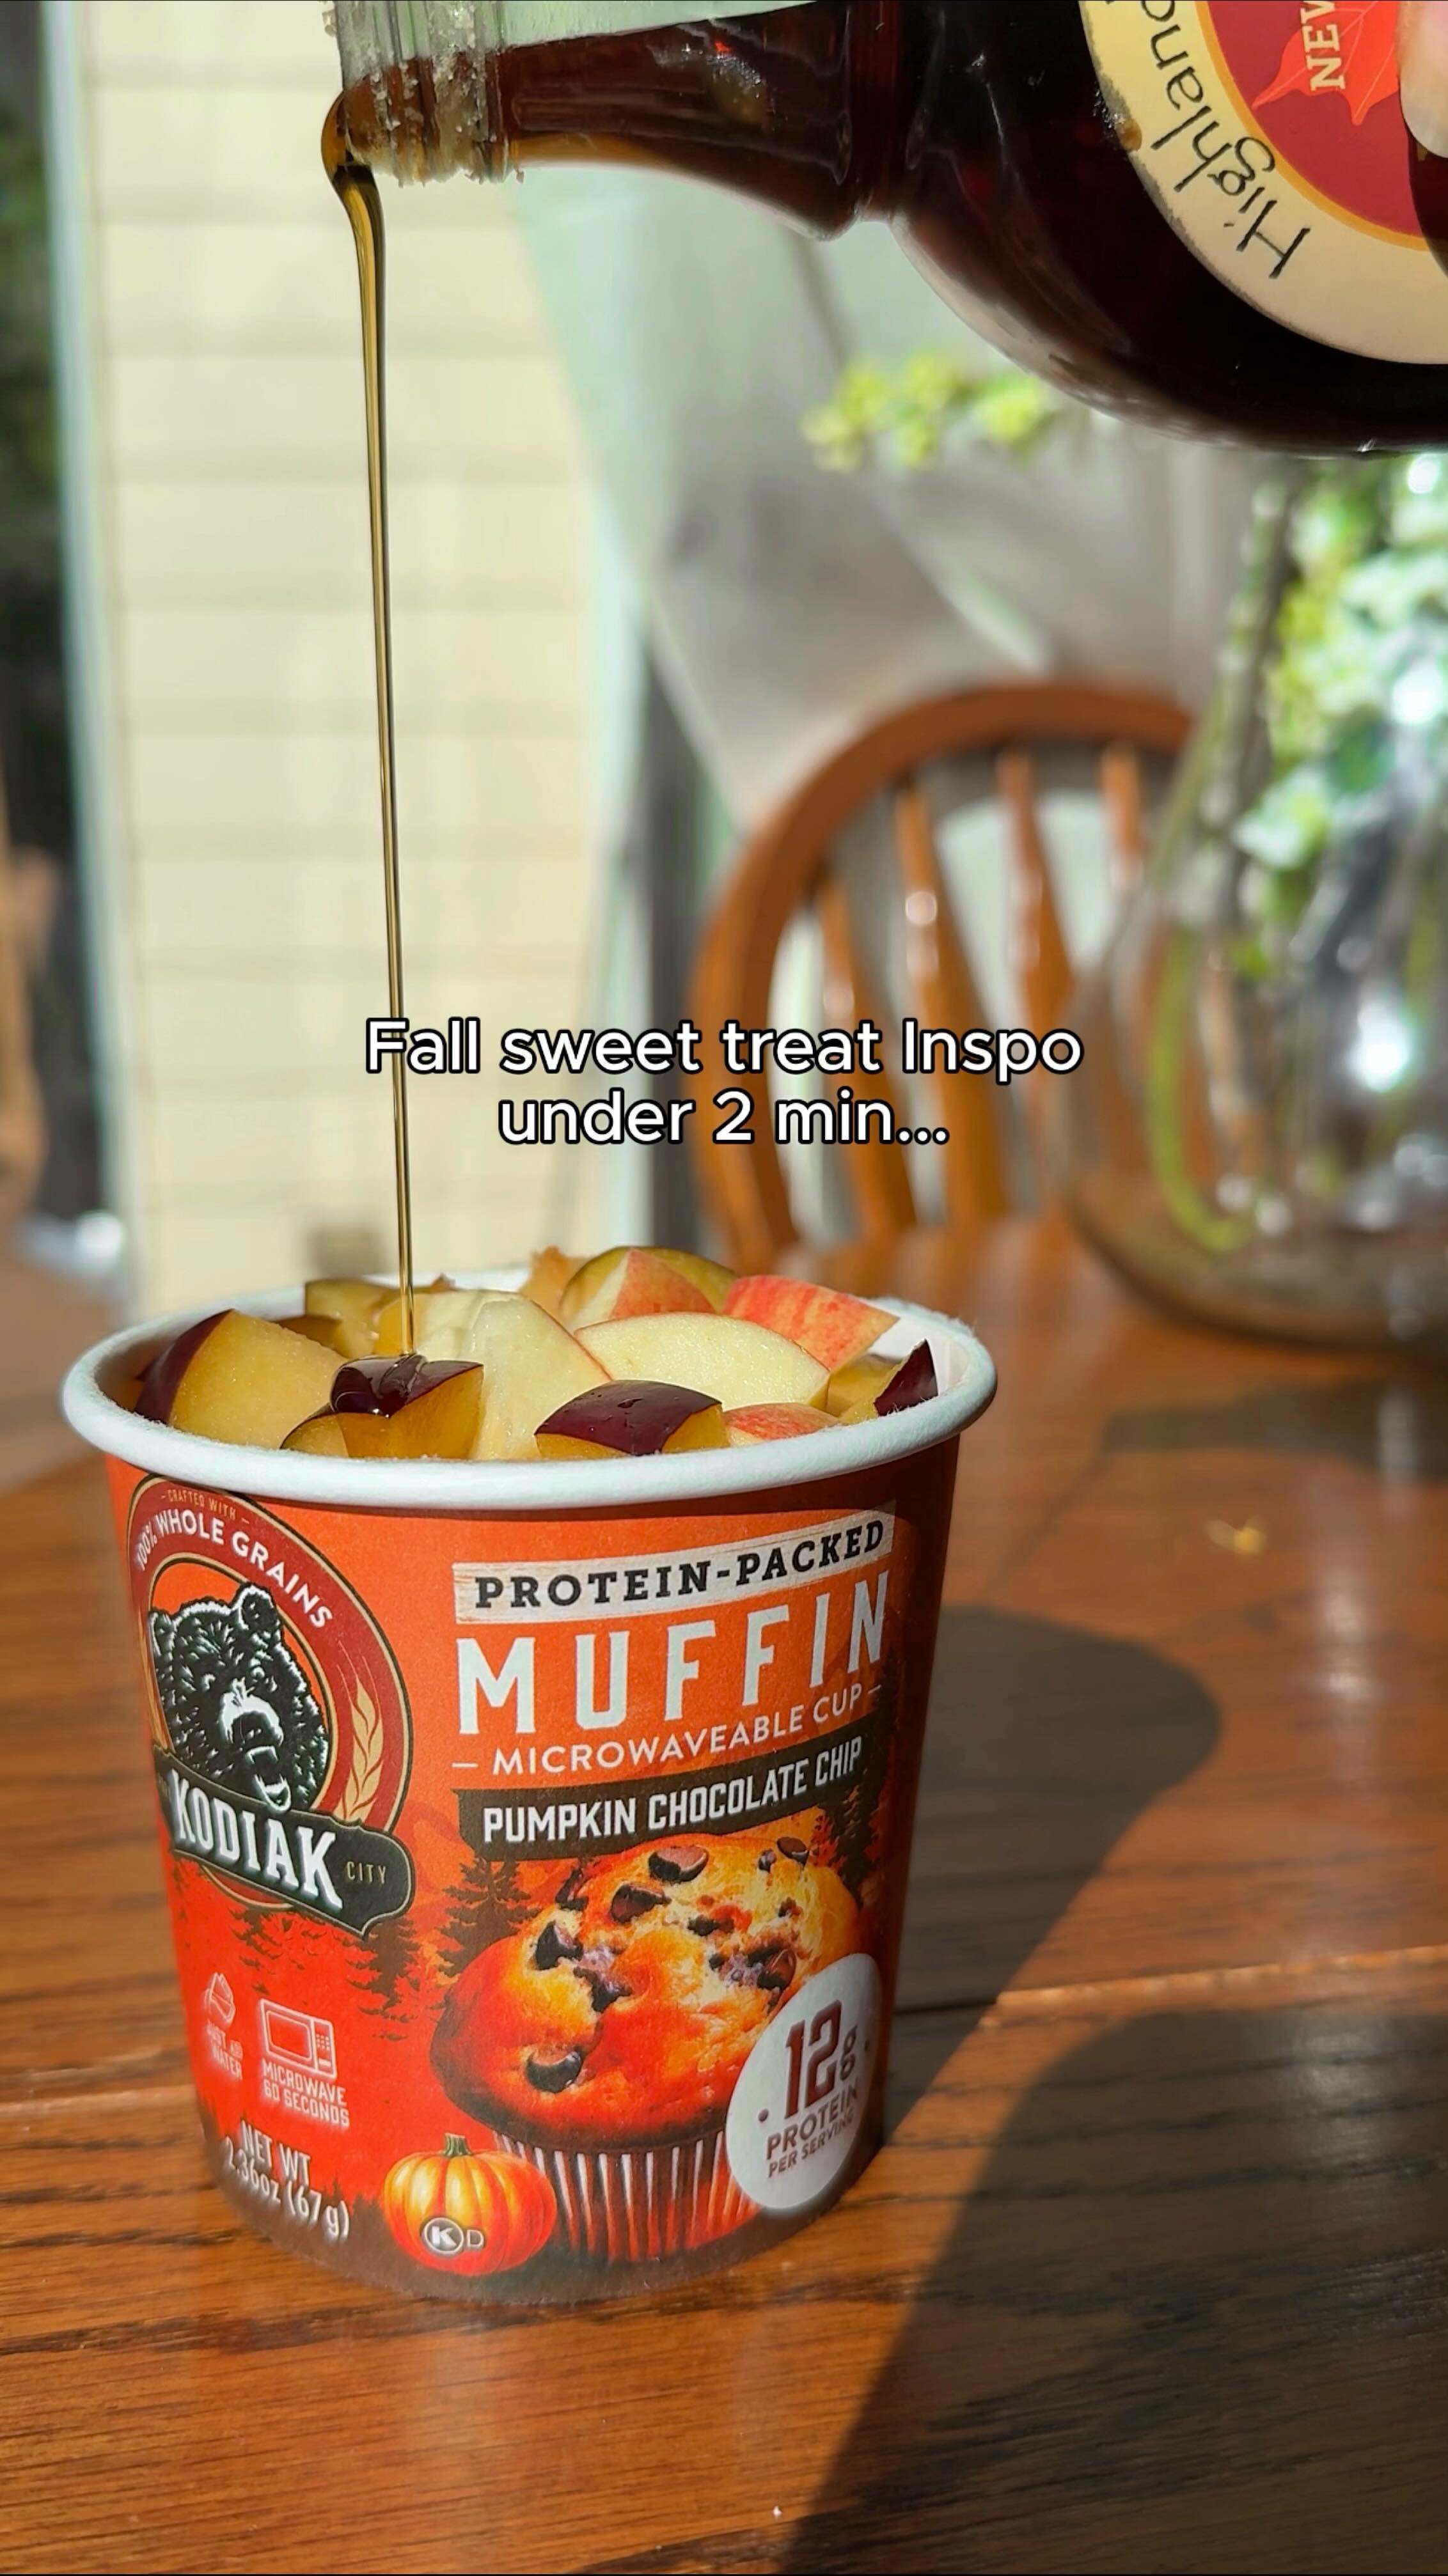
![Instagram post by @rrayyme for Kodiak Cakes. Caption reads: [...] and it made my day!! Buffet line up:....](https://images.od.modash.io/497ad36eefc69f7d21a073ccd99c41ae6fd72207)
Influencer bio
Wellness | Easy Recipes | Lifestyle 💌 remi@thedigitaldept.com Fitness @clubhomebodies Ranch wife @pontious_ranches Podcast @momfriendspod
Collaboration metrics
Get a free trial to find more data on influencer audiences, performance, and collaborations.
And here is another example with a smaller creator on Instagram (9.3k avg views/post):
oliviatohe_ x Kodiak Cakes
Influencer bio
Literally sharing daily randoms… Lifestyle • Motherhood 📍ATL Kojconnect@gmail.com
Collaboration metrics
Get a free trial to find more data on influencer audiences, performance, and collaborations.
Kodiak Cakes's repeat partnerships
Out of 1k unique influencers in our dataset, 45 of them (4%) posted content for Kodiak Cakes in 3 or more separate calendar months. The most consistent partner is @ClimbingGold, who has collaborated across 11 months with 52 total posts.
Here are 3 examples of Kodiak Cakes's repeat influencer partnerships, with links to the sponsored content.
ClimbingGold x Kodiak Cakes
![YouTube post by @ClimbingGold for Kodiak Cakes. Caption reads: [...] electrolyte water. Kodiak Cakes Find Kodiak....](https://images.od.modash.io/c0b73f4c4c60ef07a8c4b42e38c1fc803a19b298)
![YouTube post by @ClimbingGold for Kodiak Cakes. Caption reads: [...] electrolyte water. Kodiak Cakes Find Kodiak....](https://images.od.modash.io/e19ad744719aca59528e84fd28f16da887b5a4be)
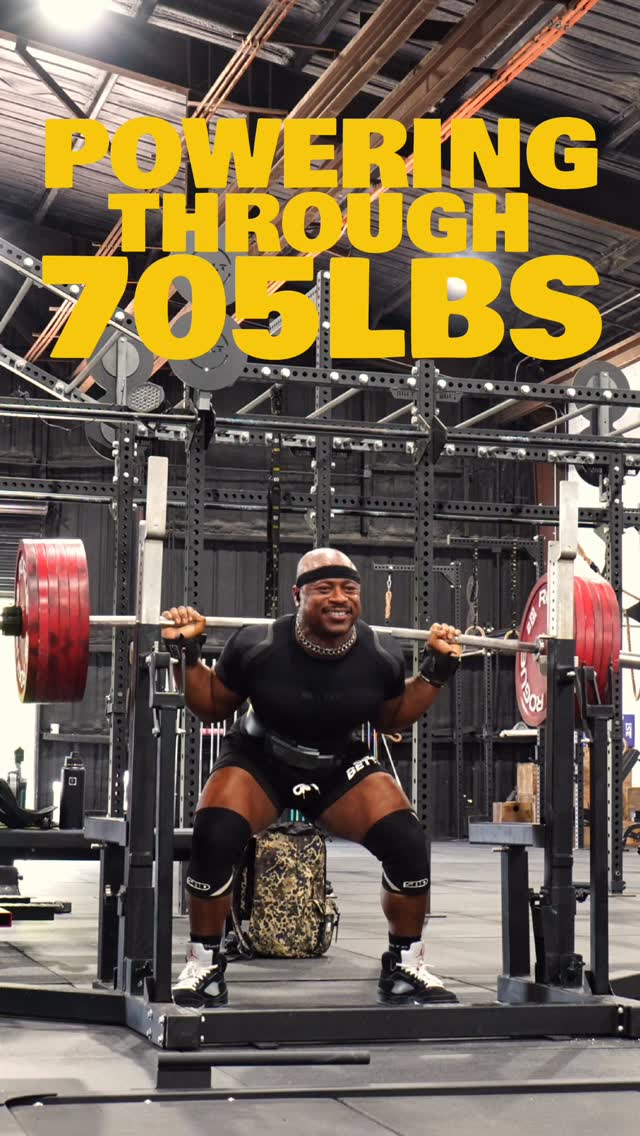
russwole x Kodiak Cakes
![Instagram post by @russwole for Kodiak Cakes. Caption reads: [...] I started my day off with @kodiakcakes....](https://images.od.modash.io/ee0e7227675ab82123d4f5efb49f1c78dcf7ef21)
![Instagram post by @russwole for Kodiak Cakes. Caption reads: [...] routine is locked in. I ate @kodiakcakes....](https://images.od.modash.io/afbd8dfdd29485ed620a15c019ffb8cbf39d645e)
emilyaharrington x Kodiak Cakes
![Instagram post by @emilyaharrington for Kodiak Cakes. Caption reads: [...] in my bio 😉 Sponsored by: @kodiakcakes....](https://images.od.modash.io/a90be613a20cb76f514a2afe9a6e444457a37fdf)
![Instagram post by @emilyaharrington for Kodiak Cakes. Caption reads: [...] in bio] ⭐️ Sponsored by @kodiakcakes (Title....](https://images.od.modash.io/4a647bb44c0daaf36259588868e73da193692eb0)
![Instagram post by @emilyaharrington for Kodiak Cakes. Caption reads: [...] in my bio. Sponsored by: @kodiakcakes (title....](https://images.od.modash.io/594b6aade398eb850cc06d4e8f39c1b5e9677c61)
💡 Related resource: Long-Term Influencer Partnerships: Pros, Cons & How The Pros Manage Them.
Geographical breakdown
In our dataset, United States is where Kodiak Cakes had the most influencer activity. 83.4% of their live influencer content in the last 12 months was posted by American influencers.
Based on the percentage of influencer content per market, other important markets include:
- Canada (4%)
- United Kingdom (3.4%)
- India (1.5%)
Kodiak Cakes's influencer activity by market
Here is another example of Kodiak Cakes collaborating with an influencer in United States.
haliealane x Kodiak Cakes
![Instagram post by @haliealane for Kodiak Cakes. Caption reads: [...] protein everything bagels again!!....](https://images.od.modash.io/75c7069e566cd570195688385845f1446d648256)
Kodiak Cakes's influencer activity vs. related brands
Kodiak Cakes competes in better-for-you, protein-forward pantry staples alongside Magic Spoon and CLIF BAR in the broader performance nutrition food space. Their influencer content often centers on macros, convenience, and active lifestyle fueling.
Total influencer content
Kodiak Cakes vs. related brands influencer activity
Total sponsored posts tracked (last 12 months)
Magic Spoon leads with 2.4k sponsored posts, significantly outpacing Kodiak Cakes (1.7k posts) and CLIF BAR (536 posts). Across all three brands, the average volume is 1.5k posts, suggesting established influencer marketing investments.
By social platform
Kodiak Cakes vs. related brands influencer activity (by social platform)
Sponsored posts by platform
Kodiak Cakes leads on Instagram, while Magic Spoon has the most activity on TikTok and YouTube. The gap is most notable on TikTok, with Magic Spoon at 1.7k, Kodiak Cakes at 699, CLIF BAR at 134 posts. Magic Spoon's activity is particularly concentrated on TikTok. Magic Spoon has multiple times more posts on TikTok and YouTube than Kodiak Cakes and CLIF BAR.
By geographical market
Kodiak Cakes vs. related brands influencer activity (by country)
Estimated sponsored posts in Kodiak Cakes's top markets
Magic Spoon has the highest estimated sponsored-post volume in United States (1.8k posts, 73.4%), United Kingdom (170 posts, 7.1%), Canada (129 posts, 5.4%), suggesting a North America focus. Looking at United States specifically, the split is Magic Spoon at 1.8k posts (73.4%), Kodiak Cakes at 1.4k posts (83.4%), CLIF BAR at 319 posts (59.5%).
Read more influencer strategy breakdowns
Looking for more like this? Here are 5 similar influencer marketing strategy breakdowns for other brands:
- Magic Spoon's Influencer Marketing Strategy
- CLIF BAR's Influencer Marketing Strategy
- DRMTLGY's Influencer Marketing Strategy
- MuscleBlaze's Influencer Marketing Strategy
- Youtooz's Influencer Marketing Strategy
Or, if you want to access data like this for your own software or processes, take a look at Modash's API products:
Frequently asked questions
Scaling your influencer program?
When you outgrow your mishmash of spreadsheets & free tools, try Modash. Find & email influencers, track campaigns, ship products & more - all in one place.