Kopari Beauty Influencer Marketing Strategy
(2026 Data & Insights)
We analyzed 5.7k pieces of influencer content sponsored by Kopari Beauty over the last 12 months.
This report breaks down where & how Kopari Beauty invests in influencer marketing, which social platforms they prioritize, top geographical markets, and more.
The data in this report comes from Modash's Brand Collaborations API.
P.S. for a simple list of influencers who have collaborated with Kopari Beauty, see here: Kopari Beauty influencers.
Influencer activity throughout the year
Kopari Beauty's influencer campaigns are active year-round with notable month-to-month fluctuation. The chart below shows month-by-month data for total sponsored posts tracked.
Kopari Beauty's influencer activity by month
Number of sponsored posts
Kopari Beauty's influencer activity appears to have tapered over the year, from 481 posts in January down to 269 in December. April was the busiest month at 855 posts, 79% above the monthly average.
Social platforms breakdown
In our dataset (which only includes Instagram, YouTube, and TikTok), this is how the volume of Kopari Beauty's sponsored influencer collaborations break down by social platform:
- TikTok: 4.6k posts (80.7%)
- Instagram: 1.1k posts (18.7%)
- YouTube: 30 posts (0.5%)
Kopari Beauty's influencer activity by platform
Share of sponsored content by social network
TikTok influencer marketing is a clear focus for Kopari Beauty.
Here are 3 examples of Kopari Beauty's recent sponsored collaborations (one each for Instagram, TikTok, YouTube).
jemma.solomon x Kopari Beauty
![Instagram post by @jemma.solomon for Kopari Beauty. Caption reads: [...] ✌️ . The best day with @spacenk and....](https://images.od.modash.io/398808b3e875937e7db799072c4059505c665681)
Influencer bio
✨ It’s ok to choose you ✨ 💞 Me, Family life & Home Reno 📧 jessica.stray@ymugroup.com 👇🏼Click below for all my links!
Collaboration metrics
Get a free trial to find more data on influencer audiences, performance, and collaborations.
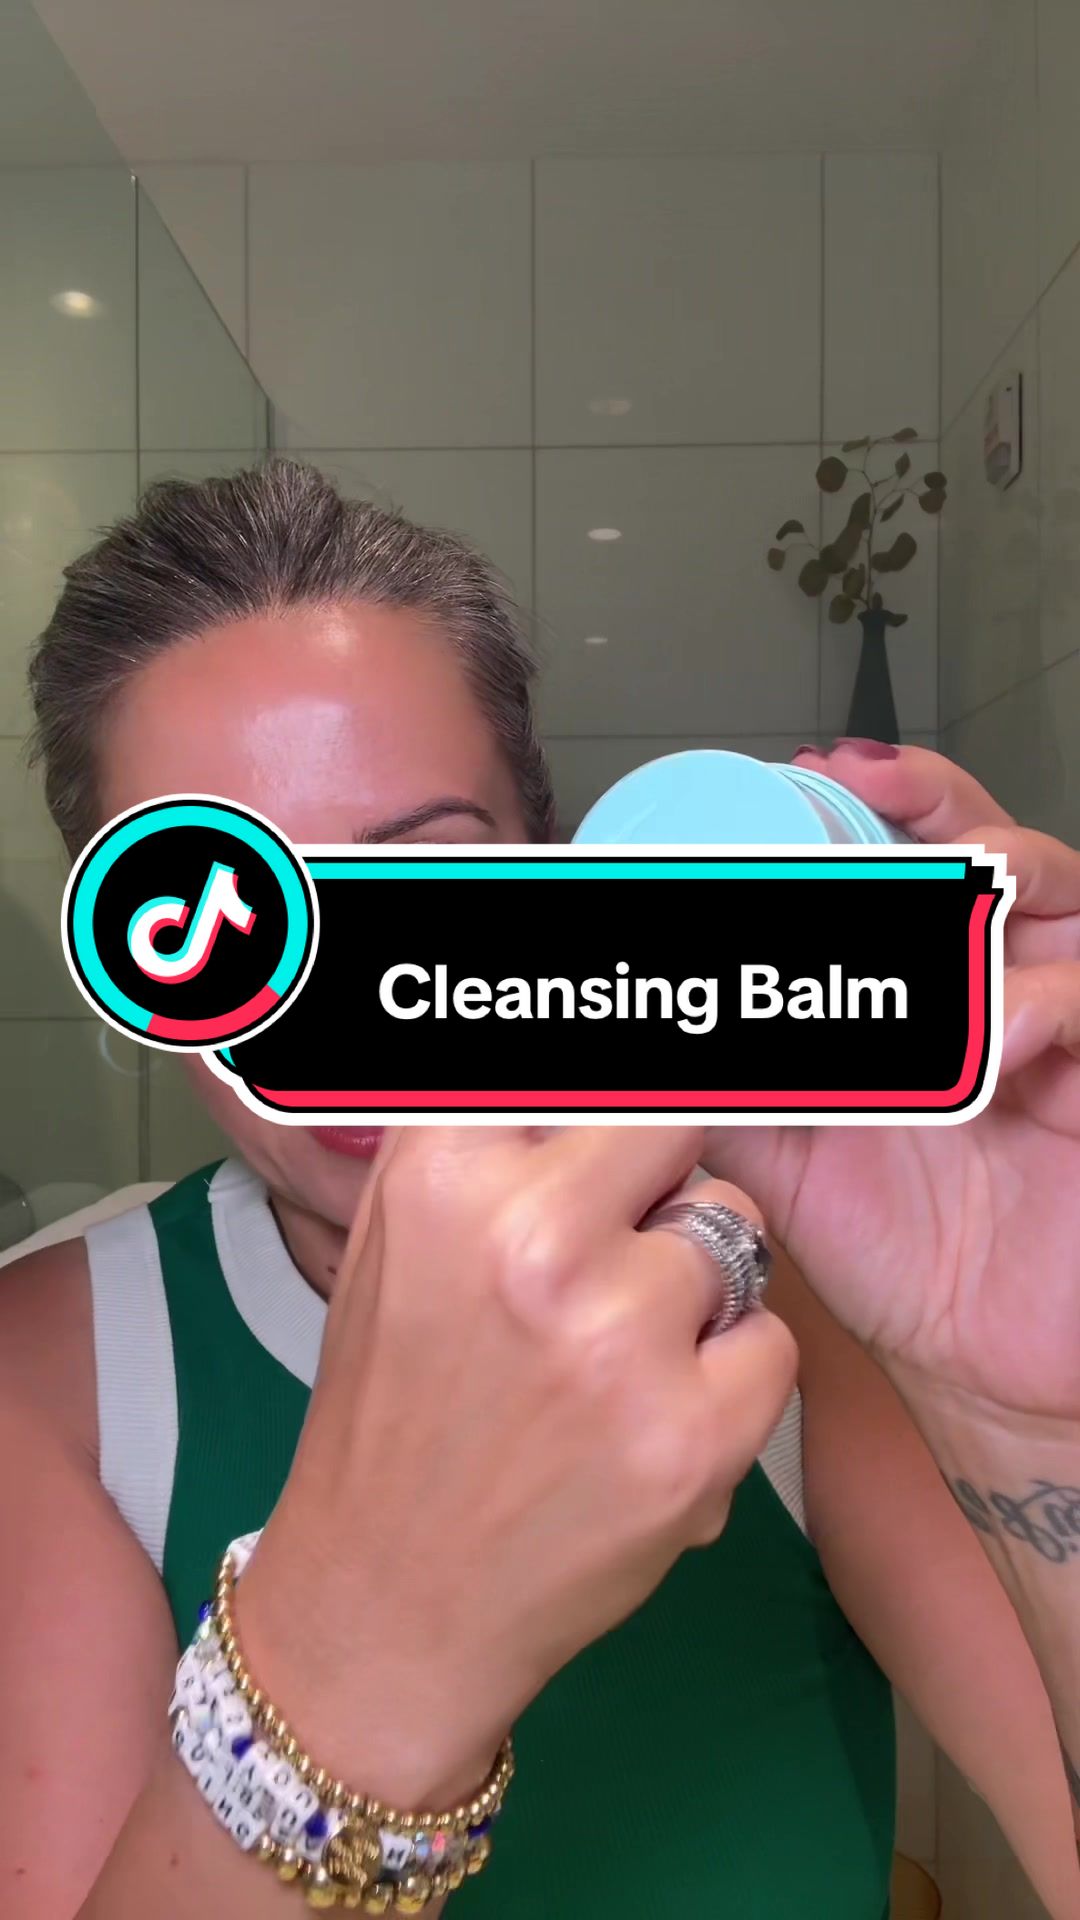
jennaevelynnn x Kopari Beauty
![TikTok post by @jennaevelynnn for Kopari Beauty. Caption reads: [...] like I am on vacation every day with @Kopari....](https://images.od.modash.io/384efab9c8c3f5ec02488190067bc5d16573ce9a)
Influencer bio
📍ohio to south florida 🍦beauty with a sprinkle of lifestyle & fashion 💌jennaevelynnn@shinetalentgroup.com 🔗my links below
Collaboration metrics
Get a free trial to find more data on influencer audiences, performance, and collaborations.
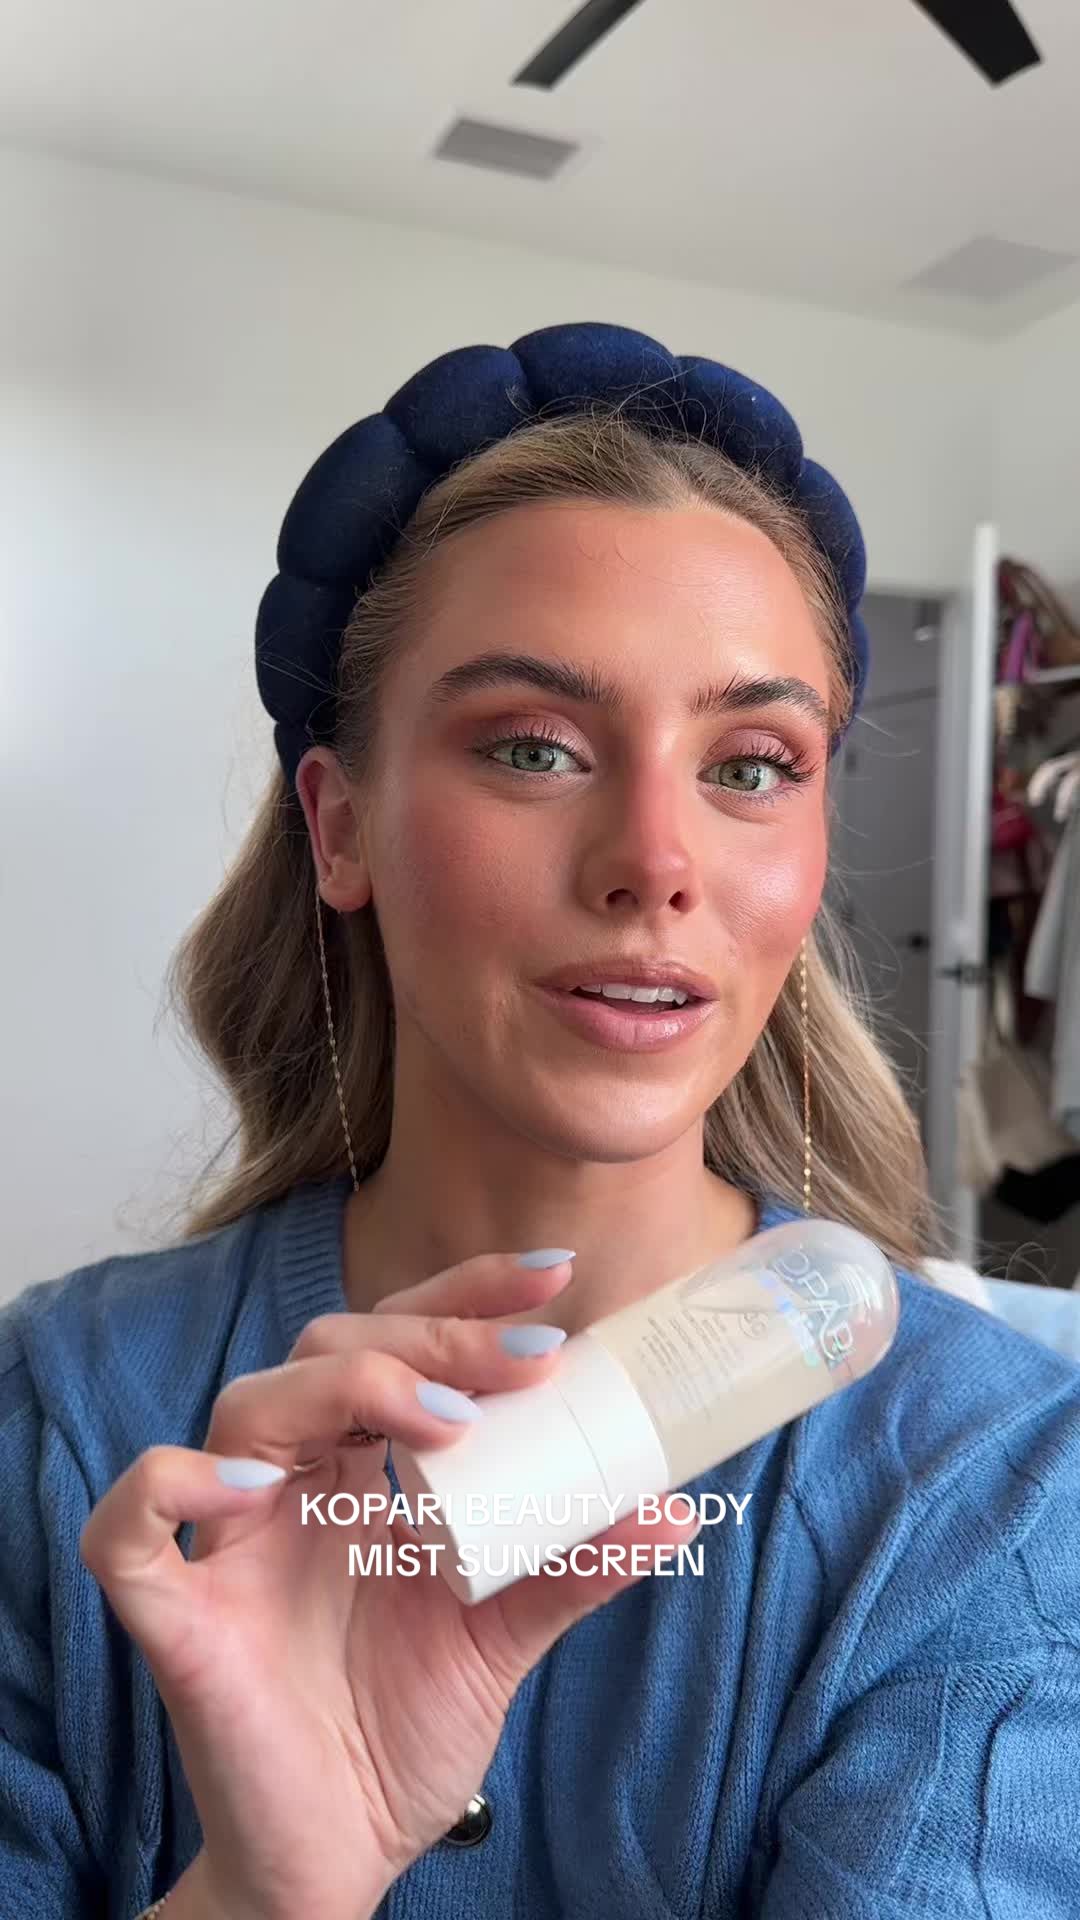
vpofglow x Kopari Beauty
![YouTube post by @vpofglow for Kopari Beauty. Caption reads: [...] it!! 😭🫶🏼 Sunscreens shown: @Koparibeauty....](https://images.od.modash.io/b2d1a4e0b34e019feba6cd7cbe47d56132cc5e85)
Influencer bio
Hi glowfriends! It’s Victoria P. and I’m here to help you glow through easy beauty (skincare, makeup, haircare)! Think: minimal effort, maximum glow ✨ Here you can find all things easy beauty, from skincare and makeup reviews, trendy products, my hormonal chin acne, and sometimes even a bit of life 🫶🏼 ✨ Stay for the glow! IG: instagram.com/vpofglow/ TikTok: tiktok.com/@vpofglow ✨ Shop my fave products: linktr.ee/vpofglow ✨ Business Inquiries: vpofglow@gmail.com
Collaboration metrics
Get a free trial to find more data on influencer audiences, performance, and collaborations.
If you break this down further by content type on TikTok, this is what it looks like:
- Videos: 96.7%
- Carousels: 3.3%
💡 Related resource: How To Find TikTok Influencers.
Influencer audience size breakdown (by views)
For their top social platform (TikTok), here is a breakdown of the type of influencers Kopari Beauty are collaborating with, by audience size.
Note: this breakdown is based on each influencer's average views (not follower/subscriber count), because views typically correlate more closely with influencer pricing and impact.
Kopari Beauty's influencers average views (TikTok)
Based on each influencer's average views per post
With 71.4% of partnerships featuring creators averaging <1K views, Kopari Beauty's strategy suggests niche targeting and authenticity, likely leveraging collaboration models like gifting and affiliates to work with smaller creators.
Here is an example of a sponsored collaboration with a larger-audience creator on TikTok (1.0M avg views/post):
kayla.ryann x Kopari Beauty
![TikTok post by @kayla.ryann for Kopari Beauty. Caption reads: [...] 28 Beauty @Colorescience @rhode skin @Kopari....](https://images.od.modash.io/3affe81f2aef510c058999dcb9ada472a7882420)
Influencer bio
HIII WELCOME 💆🏼♀️✨🍓🫧🌸 kaylaryan@thesociablesociety.com
Collaboration metrics
Get a free trial to find more data on influencer audiences, performance, and collaborations.
And here is another example with a smaller creator on TikTok (9.0k avg views/post):
kellyrosesarno x Kopari Beauty
Influencer bio
📍 Boston / NYC 350+ Mascara Reviews. Truth over hype.
Collaboration metrics
Get a free trial to find more data on influencer audiences, performance, and collaborations.
Kopari Beauty's repeat partnerships
Out of 2.9k unique influencers in our dataset, 217 of them (8%) posted content for Kopari Beauty in 3 or more separate calendar months. The most consistent partner is @paolaurdanetad, who has collaborated across 9 months with 21 total posts.
Here are 3 examples of Kopari Beauty's repeat influencer partnerships, with links to the sponsored content.
paolaurdanetad x Kopari Beauty
![TikTok post by @paolaurdanetad for Kopari Beauty. Caption reads: [...] #bloqueadorsolar #koparibeauty....](https://images.od.modash.io/eb6b4daba78c8cf6d3b3e6da5aa993d22b66b5b8)
![TikTok post by @paolaurdanetad for Kopari Beauty. Caption reads: [...] #bloqueadorsolar #spf50 #koparibeauty....](https://images.od.modash.io/ed5437af9977a8cba0b2c863cad98d767472649a)
![TikTok post by @paolaurdanetad for Kopari Beauty. Caption reads: [...] #spf50 #protectorsolar #koparibeauty....](https://images.od.modash.io/a1a81877daf848b31d7f740e73a754ea2275b420)
evamm55 x Kopari Beauty
![Instagram post by @evamm55 for Kopari Beauty. Caption reads: [...] skin!! You can shop all Kopari beauty....](https://images.od.modash.io/a52509bd816ce914103240e910723293c0b2193c)
sloanevosen x Kopari Beauty
![TikTok post by @sloanevosen for Kopari Beauty. Caption reads: [...] #glowysunscreen @Kopari Beauty.](https://images.od.modash.io/4bbad0ef68051af39d8ea276862fdb588b94d58b)
![TikTok post by @sloanevosen for Kopari Beauty. Caption reads: [...] #tiktokshopjumpstartsale #koparibeauty....](https://images.od.modash.io/38020b998de5e766f2e4b84e4c711a904cba0744)
💡 Related resource: Long-Term Influencer Partnerships: Pros, Cons & How The Pros Manage Them.
Geographical breakdown
In our dataset, United States is where Kopari Beauty had the most influencer activity. 70.3% of their live influencer content in the last 12 months was posted by American influencers.
Based on the percentage of influencer content per market, other important markets include:
- United Kingdom (8.6%)
- Canada (3.6%)
- Brazil (3.1%)
Kopari Beauty's influencer activity by market
Here is another example of Kopari Beauty collaborating with an influencer in United States.
all.things.jas x Kopari Beauty
![TikTok post by @all.things.jas for Kopari Beauty. Caption reads: [...] needs an update! 🤏🏻 loving my @Kopari....](https://images.od.modash.io/1e43ff718ad338e86ec011aea453b513abc0c25b)
Kopari Beauty's influencer activity vs. related brands
Kopari Beauty plays in sensorial body care with beachy, fragrance-forward products that perform well in short-form content. Sol de Janeiro and Truly Beauty compete for the same body-care and “treat yourself” audience with similarly viral product moments.
Total influencer content
Kopari Beauty vs. related brands influencer activity
Total sponsored posts tracked (last 12 months)
Sol de Janeiro leads with 11.7k sponsored posts, notably outpacing Truly Beauty (10.1k posts) and Kopari Beauty (5.7k posts). Across all three brands, the average volume is 9.2k posts, indicating mature, scaled influencer programs.
By social platform
Kopari Beauty vs. related brands influencer activity (by social platform)
Sponsored posts by platform
Among these brands, Sol de Janeiro leads on Instagram and YouTube and Truly Beauty leads on TikTok. The gap is most notable on Instagram, with Sol de Janeiro at 4.9k, Kopari Beauty at 1.1k, Truly Beauty at 208 posts. Kopari Beauty's activity is particularly concentrated on TikTok. On Instagram, Sol de Janeiro has multiple times more posts than Kopari Beauty and Truly Beauty, while on TikTok, Truly Beauty and Sol de Janeiro have multiple times more posts than Kopari Beauty.
By geographical market
Kopari Beauty vs. related brands influencer activity (by country)
Estimated sponsored posts in Kopari Beauty's top markets
Truly Beauty has the highest estimated sponsored-post volume in United States (6.8k posts, 66.9%), Mexico (607 posts, 6%), suggesting a North America focus, while Sol de Janeiro has the highest estimated sponsored-post volume in India (938 posts, 8%), United Kingdom (867 posts, 7.4%), while Kopari Beauty leads in Canada with 207 posts (3.6%). Looking at United States specifically, the split is Truly Beauty at 6.8k posts (66.9%), Sol de Janeiro at 4.7k posts (40.3%), Kopari Beauty at 4k posts (70.3%).
Read more influencer strategy breakdowns
Looking for more like this? Here are 5 similar influencer marketing strategy breakdowns for other brands:
- Sol de Janeiro's Influencer Marketing Strategy
- Truly Beauty's Influencer Marketing Strategy
- Levoit's Influencer Marketing Strategy
- IAMGIA's Influencer Marketing Strategy
- drinknello's Influencer Marketing Strategy
Or, if you want to access data like this for your own software or processes, take a look at Modash's API products:
Frequently asked questions
Scaling your influencer program?
When you outgrow your mishmash of spreadsheets & free tools, try Modash. Find & email influencers, track campaigns, ship products & more - all in one place.