The Frankie Shop Influencer Marketing Strategy
(2026 Data & Insights)
We analyzed 2.0k pieces of influencer content sponsored by The Frankie Shop over the last 12 months.
This report breaks down where & how The Frankie Shop invests in influencer marketing, which social platforms they prioritize, top geographical markets, and more.
The data in this report comes from Modash's Brand Collaborations API.
P.S. for a simple list of influencers who have collaborated with The Frankie Shop, see here: The Frankie Shop influencers.
Influencer activity throughout the year
The Frankie Shop's influencer campaigns are active year-round with notable month-to-month fluctuation. The chart below shows month-by-month data for total sponsored posts tracked.
The Frankie Shop's influencer activity by month
Number of sponsored posts
The Frankie Shop's influencer posting pattern appears irregular, with notable fluctuations month to month. October saw the highest output at 234 posts (40% above the 167 monthly average), while June was the quietest at 60 posts.
Social platforms breakdown
In our dataset (which only includes Instagram, YouTube, and TikTok), this is how the volume of The Frankie Shop's sponsored influencer collaborations break down by social platform:
- Instagram: 1.5k posts (74.1%)
- TikTok: 464 posts (23.1%)
- YouTube: 57 posts (2.8%)
The Frankie Shop's influencer activity by platform
Share of sponsored content by social network
Instagram influencer marketing is a clear focus for The Frankie Shop.
Here are 3 examples of The Frankie Shop's recent sponsored collaborations (one each for Instagram, TikTok, YouTube).
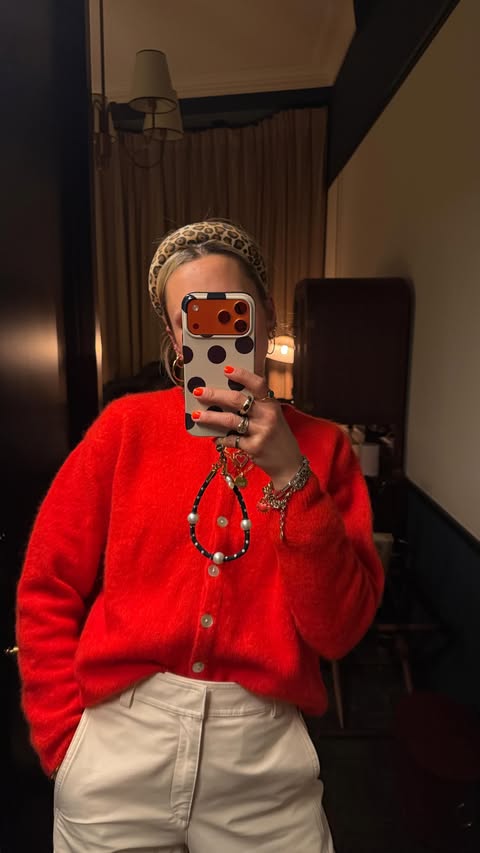
vicmontanari x The Frankie Shop
Influencer bio
a good mix of my life 🍀🐞🍝 vicmontanari.digital@gmail.com
Collaboration metrics
Get a free trial to find more data on influencer audiences, performance, and collaborations.
meg.ofitness x The Frankie Shop
Influencer bio
not a chef, just hungry ✉️ megoneil@outreachtalentgroup.com
Collaboration metrics
Get a free trial to find more data on influencer audiences, performance, and collaborations.
KarenBritChick x The Frankie Shop
Influencer bio
I'm Karen from Where Did U Get That, also known as Karenbritchick. I am back on YouTube and posting videos every week on high/low fashion, style, shopping and the odd beauty piece, basically what we're all interested in. Instagram: https://www.instagram.com/KARENBRITCHICK/ Twitter: https://twitter.com/KarenBritChick Pinterest: https://www.pinterest.com/karenbritchick/ Blog: http://wheredidugetthat.com
Collaboration metrics
Get a free trial to find more data on influencer audiences, performance, and collaborations.
If you break this down further by content type on Instagram, this is what it looks like:
- Posts: 59.9%
- Reels: 40.1%
💡 Related resource: How To Find Instagram Influencers.
Influencer audience size breakdown (by views)
For their top social platform (Instagram), here is a breakdown of the type of influencers The Frankie Shop are collaborating with, by audience size.
Note: this breakdown is based on each influencer's average views (not follower/subscriber count), because views typically correlate more closely with influencer pricing and impact.
The Frankie Shop's influencers average views (Instagram)
Based on each influencer's average views per post
With 37.5% of partnerships featuring creators averaging 10K-50K views, The Frankie Shop's strategy suggests cost-efficiency and engagement-focused partnerships.
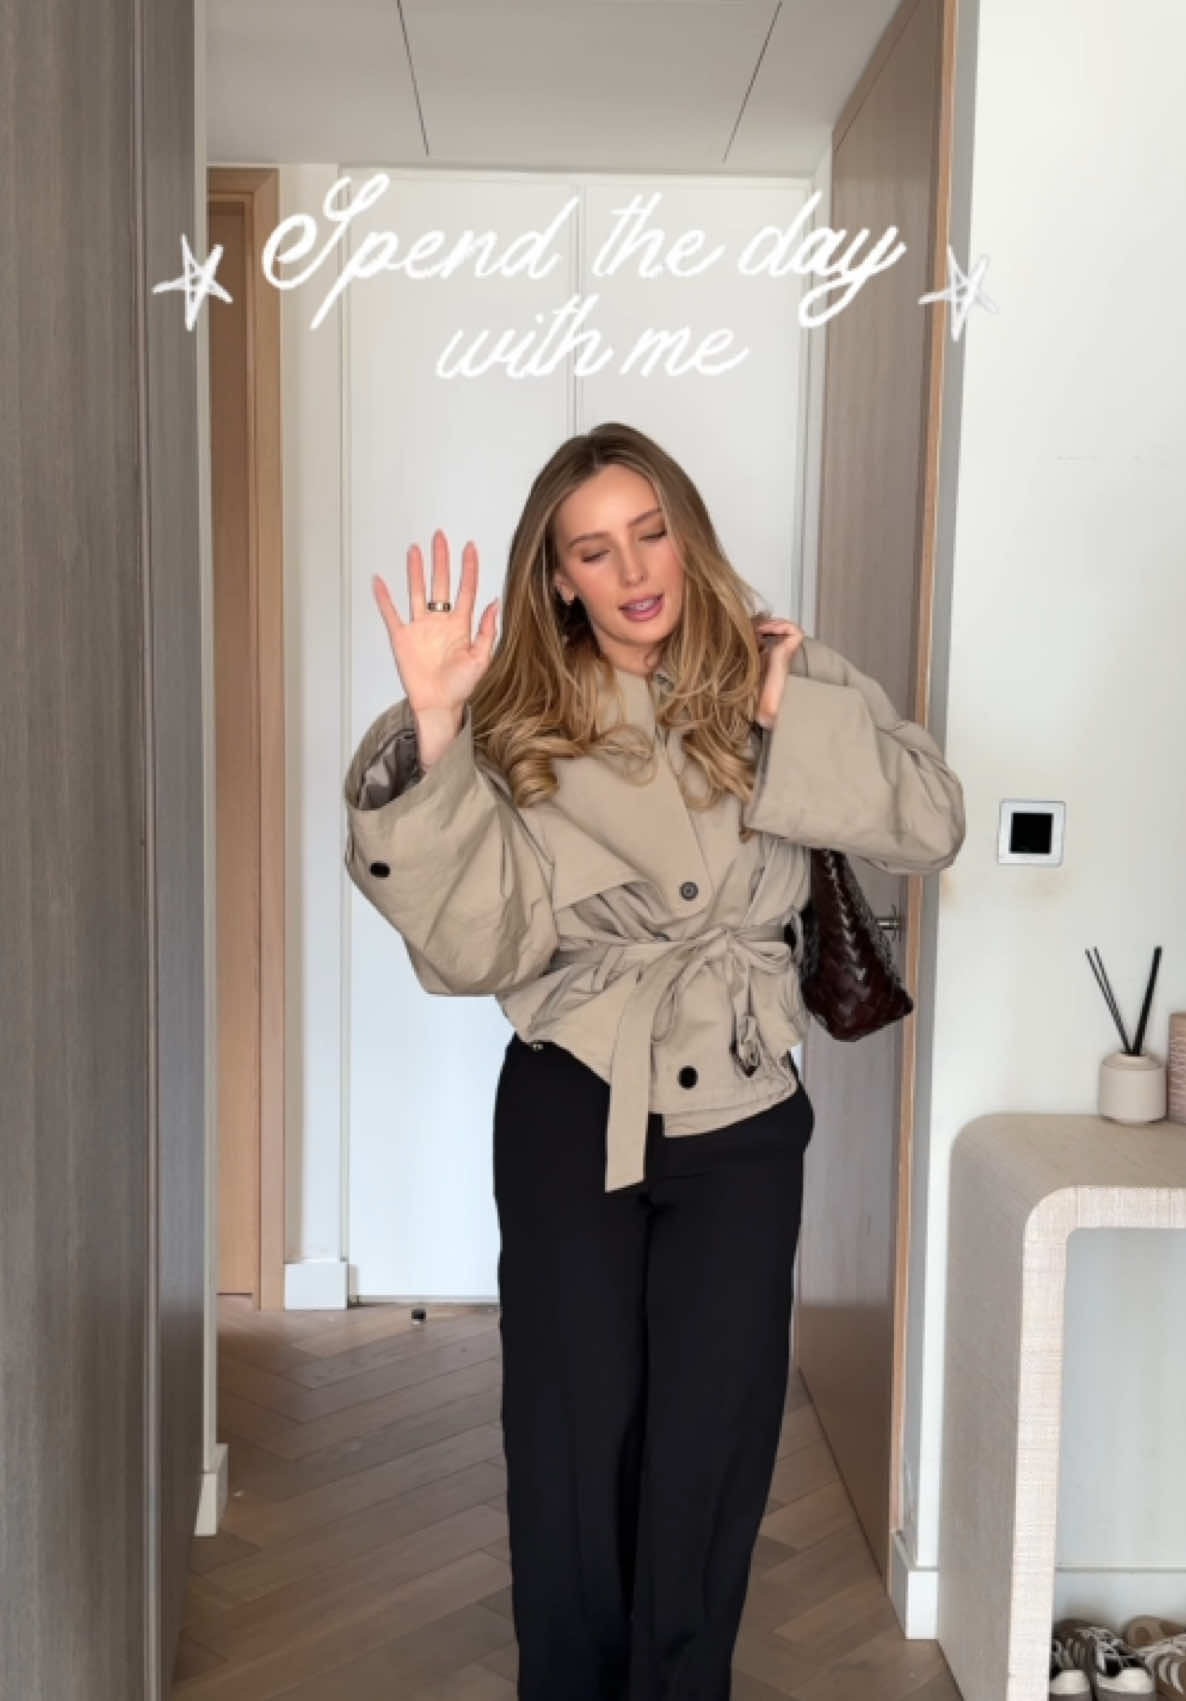
Here is an example of a sponsored collaboration with a larger-audience creator on Instagram (966.4k avg views/post):
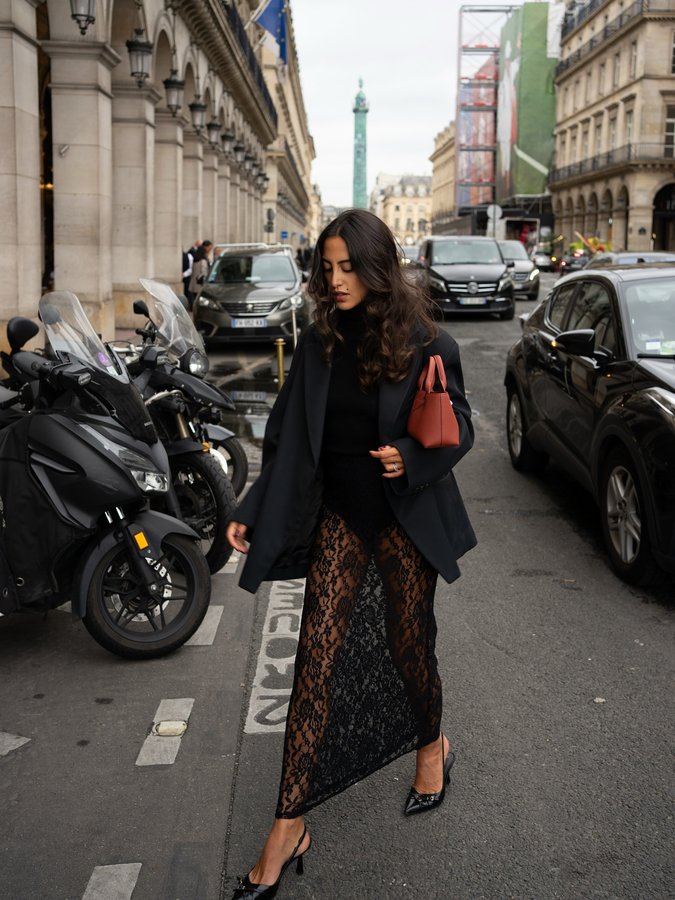
mariamartinn x The Frankie Shop
![Instagram post by @mariamartinn for The Frankie Shop. Caption reads: [...] Body Black' (publi/cesion) Shorts....](https://images.od.modash.io/e37f115cabca3f06025e85d57cac0c6b8a2d946f)
Influencer bio
tiktok: @meri99mps @verticalgroup
Collaboration metrics
Get a free trial to find more data on influencer audiences, performance, and collaborations.
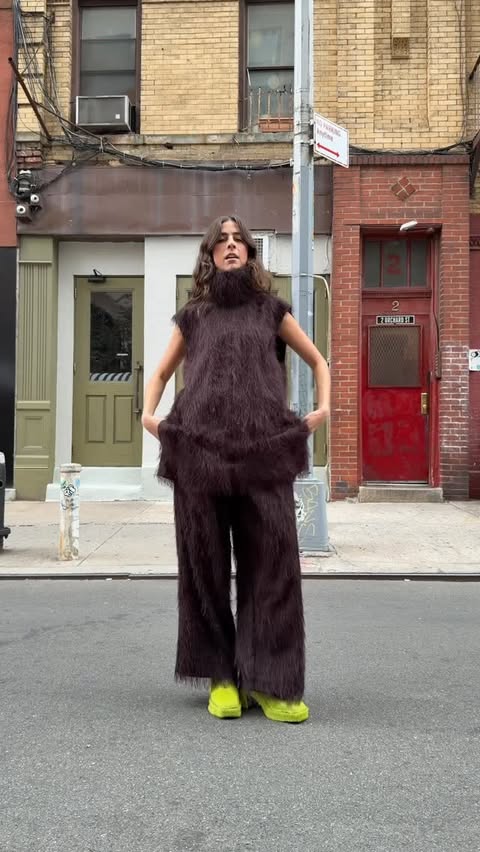
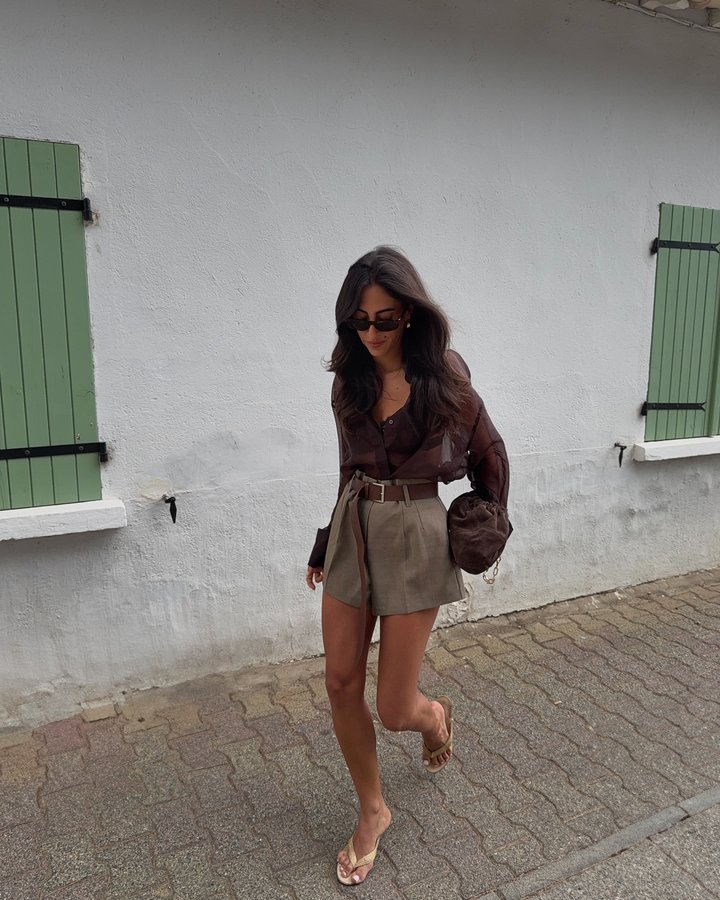
And here is another example with a smaller creator on Instagram (9.3k avg views/post):
demioyenekan x The Frankie Shop
Influencer bio
demioyenekan@yahoo.com represented by: @bold_management
Collaboration metrics
Get a free trial to find more data on influencer audiences, performance, and collaborations.
The Frankie Shop's repeat partnerships
Out of 1.2k unique influencers in our dataset, 20 of them (2%) posted content for The Frankie Shop in 3 or more separate calendar months. The most consistent partner is @niknet, who has collaborated across 10 months with 18 total posts.
Here are 3 examples of The Frankie Shop's repeat influencer partnerships, with links to the sponsored content.
taina.csg x The Frankie Shop
![Instagram post by @taina.csg for The Frankie Shop. Caption reads: [...] and loving it @thefrankieshop *des produits....](https://images.od.modash.io/f4eaeb97d60e52d6ec8659285f5dc9d493b3074f)
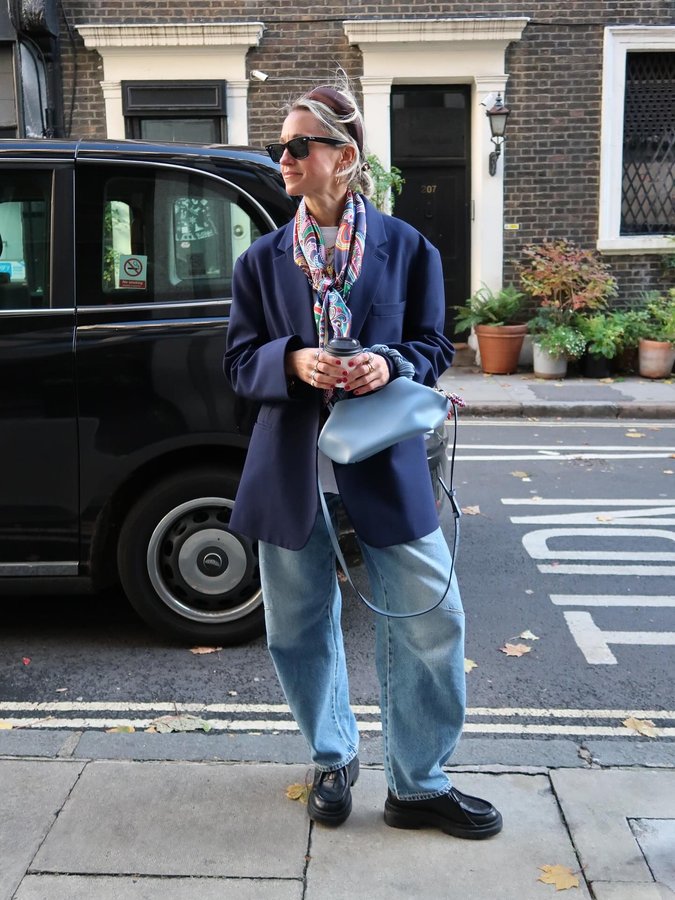
goodmannersstyle x The Frankie Shop
![Instagram post by @goodmannersstyle for The Frankie Shop. Caption reads: [...] for spring 🫶🏼 Blazer @thefrankieshop Long....](https://images.od.modash.io/54a9081f964858d7fea5957142193ecb64b3566c)
maroobii_ x The Frankie Shop
![Instagram post by @maroobii_ for The Frankie Shop. Caption reads: [...] of texture and contrast @thefrankieshop look....](https://images.od.modash.io/107f67f49a6a86a25b8e988e3fad7ba30b756a64)
![Instagram post by @maroobii_ for The Frankie Shop. Caption reads: [...] with the hayla jeans @thefrankieshop ♡ •••....](https://images.od.modash.io/8f64f4ef3ce7d36730ad943f6513cfc93e4cf04f)
![Instagram post by @maroobii_ for The Frankie Shop. Caption reads: [...] refined, everyday uniform @thefrankieshop,....](https://images.od.modash.io/acd4fc3d47c3d941d35a3f50f9154556bc53db77)
💡 Related resource: Long-Term Influencer Partnerships: Pros, Cons & How The Pros Manage Them.
Geographical breakdown
In our dataset, United States is where The Frankie Shop had the most influencer activity. 30% of their live influencer content in the last 12 months was posted by American influencers.
Based on the percentage of influencer content per market, other important markets include:
- France (12.6%)
- United Kingdom (9.8%)
- Italy (7.1%)
The Frankie Shop's influencer activity by market
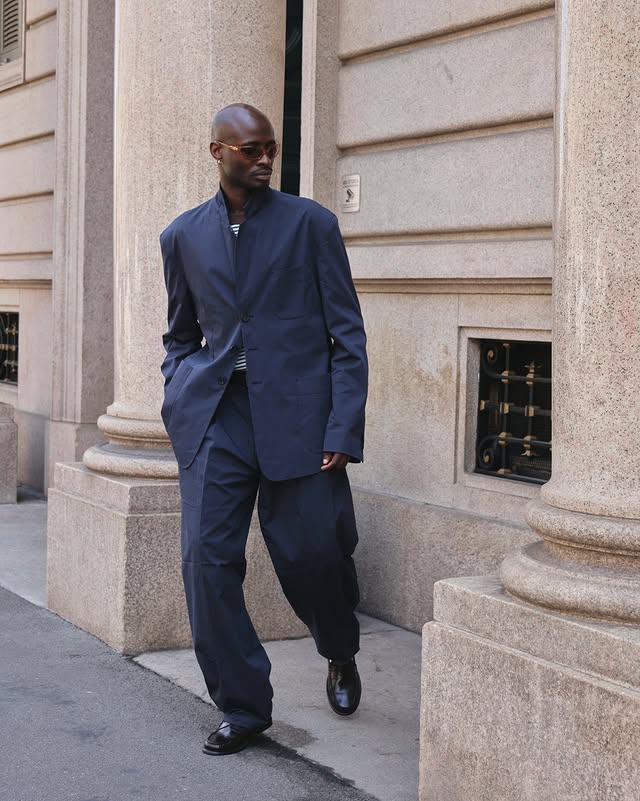
Here is another example of The Frankie Shop collaborating with an influencer in United States.
kanchanalle x The Frankie Shop
The Frankie Shop's influencer activity vs. related brands
The Frankie Shop, Everlane, and STAUD all play in contemporary fashion with a strong style POV and premium-but-attainable pricing, competing for fashion-forward shoppers influenced by editorial creators and outfit styling content.
Total influencer content
The Frankie Shop vs. related brands influencer activity
Total sponsored posts tracked (last 12 months)
The Frankie Shop leads with 2k sponsored posts, significantly outpacing Everlane (1.4k posts) and STAUD (967 posts). Across all three brands, the average volume is 1.5k posts, suggesting established influencer marketing investments.
By social platform
The Frankie Shop vs. related brands influencer activity (by social platform)
Sponsored posts by platform
The Frankie Shop leads on Instagram and YouTube, while Everlane leads on TikTok. The gap is most notable on Instagram, with The Frankie Shop at 1.5k, Everlane at 862, STAUD at 708 posts. The Frankie Shop's activity is particularly concentrated on Instagram. The Frankie Shop has far more YouTube posts than Everlane and STAUD.
By geographical market
The Frankie Shop vs. related brands influencer activity (by country)
Estimated sponsored posts in The Frankie Shop's top markets
Everlane has the highest estimated sponsored-post volume in United States (967 posts, 69%), Canada (60 posts, 4.3%), suggesting a North America focus, while The Frankie Shop has the highest estimated sponsored-post volume in France (253 posts, 12.6%), United Kingdom (197 posts, 9.8%), suggesting a Europe focus, while STAUD leads in Brazil with 45 posts (4.7%). Looking at United States specifically, the split is Everlane at 967 posts (69%), STAUD at 630 posts (65.2%), The Frankie Shop at 603 posts (30%). The Frankie Shop's strength in France and United Kingdom may indicate a home-market focus, while Everlane shows broader regional investment.
Read more influencer strategy breakdowns
Looking for more like this? Here are 5 similar influencer marketing strategy breakdowns for other brands:
- Everlane's Influencer Marketing Strategy
- STAUD's Influencer Marketing Strategy
- Saltair's Influencer Marketing Strategy
- Chillab's Influencer Marketing Strategy
- Taste Salud's Influencer Marketing Strategy
Or, if you want to access data like this for your own software or processes, take a look at Modash's API products:
Frequently asked questions
Scaling your influencer program?
When you outgrow your mishmash of spreadsheets & free tools, try Modash. Find & email influencers, track campaigns, ship products & more - all in one place.