MCoBeauty Influencer Marketing Strategy
(2026 Data & Insights)
We analyzed 11.5k pieces of influencer content sponsored by MCoBeauty over the last 12 months.
This report breaks down where & how MCoBeauty invests in influencer marketing, which social platforms they prioritize, top geographical markets, and more.
The data in this report comes from Modash's Brand Collaborations API.
P.S. for a simple list of influencers who have collaborated with MCoBeauty, see here: MCoBeauty influencers.
Influencer activity throughout the year
MCoBeauty's influencer campaigns are active year-round with notable month-to-month fluctuation. The chart below shows month-by-month data for total sponsored posts tracked.
MCoBeauty's influencer activity by month
Number of sponsored posts
MCoBeauty's sponsored post volume appears to trend upward over the 12-month period, rising from 673 posts in January to 889 in December. The peak month, September, reached 1.8k posts, 92% higher than the monthly average of 954.
Social platforms breakdown
In our dataset (which only includes Instagram, YouTube, and TikTok), this is how the volume of MCoBeauty's sponsored influencer collaborations break down by social platform:
- TikTok: 9.5k posts (82.9%)
- Instagram: 1.9k posts (16.8%)
- YouTube: 28 posts (0.2%)
MCoBeauty's influencer activity by platform
Share of sponsored content by social network
TikTok influencer marketing is a clear focus for MCoBeauty.
Here are 3 examples of MCoBeauty's recent sponsored collaborations (one each for Instagram, TikTok, YouTube).
ninaghoulina x MCoBeauty
![Instagram post by @ninaghoulina for MCoBeauty. Caption reads: [...] about the confidence you carry. With....](https://images.od.modash.io/c99bda2ad88b1b70a4530a70cec49e31d62ef106)
Influencer bio
Clarksville/Nashville TN 📍 @ninaghoulina 6.2M on TikTok Nina@nightingalemgmt.co
Collaboration metrics
Get a free trial to find more data on influencer audiences, performance, and collaborations.
lucyconlanxx x MCoBeauty
![TikTok post by @lucyconlanxx for MCoBeauty. Caption reads: [...] to @Superdrug ❤️🔥❤️🔥 Finding the....](https://images.od.modash.io/25b08a9080f3e37565a4612bda376f01f737fa86)
Influencer bio
pro makeup artist & beauty founder 💌 makeup, real life & trying new food spots owner of @CONLAN ✉️ Jemma@reformationmanagement.co.uk
Collaboration metrics
Get a free trial to find more data on influencer audiences, performance, and collaborations.
hopescope x MCoBeauty
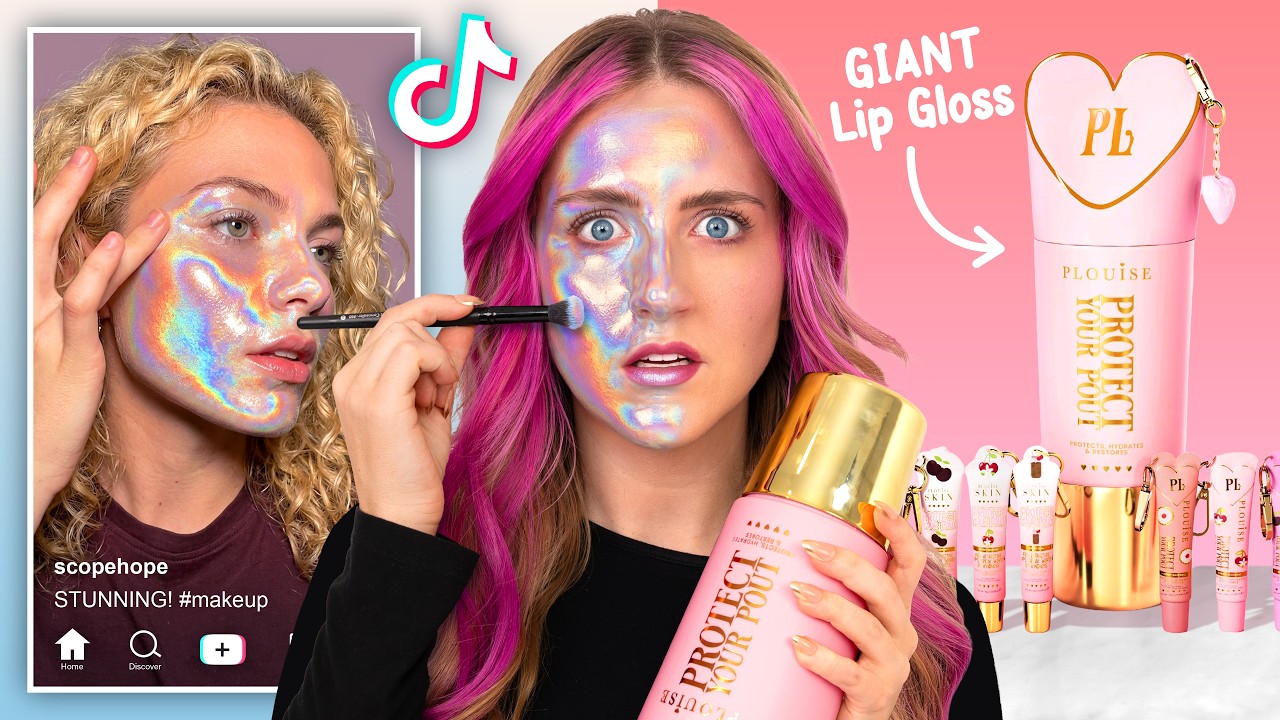
Influencer bio
Treasure Hunter, Professional Shopper, SUBSCRIBE! Welcome to my channel! Here we buy celebrity clothing, cheap returns mystery boxes, lost luggage, check out trending tiktok products, ruthlessly review popular brands, and tons of other exciting things! BUSINESS INQUIRIES ONLY: Email tyler@hopescope.com or DM Tyler on LinkedIn https://www.linkedin.com/in/tyler-allen-hopescope/
Collaboration metrics
Get a free trial to find more data on influencer audiences, performance, and collaborations.
If you break this down further by content type on TikTok, this is what it looks like:
- Videos: 94.3%
- Carousels: 5.7%
💡 Related resource: How To Find TikTok Influencers.
Influencer audience size breakdown (by views)
For their top social platform (TikTok), here is a breakdown of the type of influencers MCoBeauty are collaborating with, by audience size.
Note: this breakdown is based on each influencer's average views (not follower/subscriber count), because views typically correlate more closely with influencer pricing and impact.
MCoBeauty's influencers average views (TikTok)
Based on each influencer's average views per post
With 49.2% of partnerships featuring creators averaging <1K views, MCoBeauty's strategy suggests niche targeting and authenticity, likely leveraging collaboration models like gifting and affiliates to work with smaller creators.
Here is an example of a sponsored collaboration with a larger-audience creator on TikTok (4.8M avg views/post):
lenkalul x MCoBeauty
![TikTok post by @lenkalul for MCoBeauty. Caption reads: [...] cherry cola lip trend 👄🍒♥️ using....](https://images.od.modash.io/044a6e884035c811394b772221634a11989b3369)
Influencer bio
IG: @lenkalul business: info@lenkalul.com 📍UK 🇬🇧 management @The Blogger Agent
Collaboration metrics
Get a free trial to find more data on influencer audiences, performance, and collaborations.
And here is another example with a smaller creator on TikTok (10.0k avg views/post):
prettygirlglaze x MCoBeauty
![TikTok post by @prettygirlglaze for MCoBeauty. Caption reads: [...] out !! Also great quality makeup!!....](https://images.od.modash.io/69162474c2ac3598c84f4ec86a7746803356495b)
Influencer bio
GLP1 journey ❤️
Collaboration metrics
Get a free trial to find more data on influencer audiences, performance, and collaborations.
MCoBeauty's repeat partnerships
Out of 5.6k unique influencers in our dataset, 500 of them (9%) posted content for MCoBeauty in 3 or more separate calendar months. The most consistent partner is @georgia.barratt, who has collaborated across 10 months with 19 total posts.
Here are 3 examples of MCoBeauty's repeat influencer partnerships, with links to the sponsored content.
georgia.barratt x MCoBeauty
![TikTok post by @georgia.barratt for MCoBeauty. Caption reads: [...] test if I’ve ever seen one… @MCoBeauty UK....](https://images.od.modash.io/57ea125e70b6b8b3728fd2f25addac9f6a7ce010)
![TikTok post by @georgia.barratt for MCoBeauty. Caption reads: [...] it’s my RIDE OR DIE 🫶🏼✨ @MCoBeauty UK ad.](https://images.od.modash.io/dfe64f36b6a2e7984f881ab18e4ae7e231a20a2b)
tashdelrosario x MCoBeauty
![TikTok post by @tashdelrosario for MCoBeauty. Caption reads: @MCoBeauty is currently 50% off in [...].](https://images.od.modash.io/dd7cf4d6b153a37355e3aa6243542e1b5915ba54)
![TikTok post by @tashdelrosario for MCoBeauty. Caption reads: @MCoBeauty really said don’t worry [...].](https://images.od.modash.io/b4990c6c9d046c4f3859404ed4391f60cf0bbbce)
only1aliya x MCoBeauty
![TikTok post by @only1aliya for MCoBeauty. Caption reads: @mcobeauty us is WORKINGGG for the [...].](https://images.od.modash.io/778b31fd601c423e0b807eb15f420792648fb5ee)
![TikTok post by @only1aliya for MCoBeauty. Caption reads: [...] HEREEEEE #grwm #bf #surprise....](https://images.od.modash.io/c2d486c95c33875cbb347281329f0113c8b90fde)
![TikTok post by @only1aliya for MCoBeauty. Caption reads: [...] OK #grwm #fyp #rantoftheday....](https://images.od.modash.io/4442a0af345bd5898ebda4ae6362c4e162538cc4)
💡 Related resource: Long-Term Influencer Partnerships: Pros, Cons & How The Pros Manage Them.
Geographical breakdown
In our dataset, United States is where MCoBeauty had the most influencer activity. 43.5% of their live influencer content in the last 12 months was posted by American influencers.
Based on the percentage of influencer content per market, other important markets include:
- Australia (21.1%)
- United Kingdom (12.1%)
- New Zealand (4.3%)
MCoBeauty's influencer activity by market
Here is another example of MCoBeauty collaborating with an influencer in United States.
daniellehendrickss x MCoBeauty
![TikTok post by @daniellehendrickss for MCoBeauty. Caption reads: [...] know all these products were under $10....](https://images.od.modash.io/1be96b7a549716a41c0efe887580e1d8eeaa83d1)
MCoBeauty's influencer activity vs. related brands
MCoBeauty aligns with Milani Cosmetics and e.l.f. Cosmetics in affordable, trend-reactive makeup that wins through viral creator reviews, dupes, and rapid product discovery on TikTok and Instagram.
Total influencer content
MCoBeauty vs. related brands influencer activity
Total sponsored posts tracked (last 12 months)
e.l.f. Cosmetics leads with 38.4k sponsored posts, significantly outpacing MCoBeauty (11.5k posts) and Milani Cosmetics (6.4k posts). Across all three brands, the average volume is 18.7k posts, indicating mature, scaled influencer programs. e.l.f. Cosmetics has more than three times as many total posts as MCoBeauty and Milani Cosmetics.
By social platform
MCoBeauty vs. related brands influencer activity (by social platform)
Sponsored posts by platform
Among these brands, e.l.f. Cosmetics leads on Instagram and TikTok and Milani Cosmetics leads on YouTube. The gap is most notable on TikTok, with e.l.f. Cosmetics at 29.8k, MCoBeauty at 9.5k, Milani Cosmetics at 4.7k posts. MCoBeauty's activity is particularly concentrated on TikTok. On TikTok, e.l.f. Cosmetics has more than three times as many posts as MCoBeauty and more than six times as many as Milani Cosmetics.
By geographical market
MCoBeauty vs. related brands influencer activity (by country)
Estimated sponsored posts in MCoBeauty's top markets
e.l.f. Cosmetics has the highest estimated sponsored-post volume in United States (20k posts, 52.6%), India (4k posts, 10.5%), United Kingdom (3.7k posts, 9.6%), while MCoBeauty leads in Australia with 2.4k posts (21.1%). Looking at United States specifically, the split is e.l.f. Cosmetics at 20k posts (52.6%), MCoBeauty at 5k posts (43.5%), Milani Cosmetics at 4k posts (62.9%).
Read more influencer strategy breakdowns
Looking for more like this? Here are 5 similar influencer marketing strategy breakdowns for other brands:
- Milani Cosmetics's Influencer Marketing Strategy
- e.l.f. Cosmetics's Influencer Marketing Strategy
- dokidokicosplay's Influencer Marketing Strategy
- WHOOP's Influencer Marketing Strategy
- Sol de Janeiro's Influencer Marketing Strategy
Or, if you want to access data like this for your own software or processes, take a look at Modash's API products:
Frequently asked questions
Scaling your influencer program?
When you outgrow your mishmash of spreadsheets & free tools, try Modash. Find & email influencers, track campaigns, ship products & more - all in one place.