Patrick Ta Influencer Marketing Strategy
(2026 Data & Insights)
We analyzed 22.4k pieces of influencer content sponsored by Patrick Ta over the last 12 months.
This report breaks down where & how Patrick Ta invests in influencer marketing, which social platforms they prioritize, top geographical markets, and more.
The data in this report comes from Modash's Brand Collaborations API.
P.S. for a simple list of influencers who have collaborated with Patrick Ta, see here: Patrick Ta influencers.
Influencer activity throughout the year
Patrick Ta's influencer campaigns are active year-round with notable month-to-month fluctuation. The chart below shows month-by-month data for total sponsored posts tracked.
Patrick Ta's influencer activity by month
Number of sponsored posts
Patrick Ta's sponsored post volume peaks in November with 2.9k posts, 57% higher than the monthly average of 1.9k. June recorded the lowest activity at 669 posts, 64% below average.
Social platforms breakdown
In our dataset (which only includes Instagram, YouTube, and TikTok), this is how the volume of Patrick Ta's sponsored influencer collaborations break down by social platform:
- TikTok: 17.9k posts (79.8%)
- Instagram: 4.5k posts (19.9%)
- YouTube: 68 posts (0.3%)
Patrick Ta's influencer activity by platform
Share of sponsored content by social network
TikTok influencer marketing is a clear focus for Patrick Ta.
Here are 3 examples of Patrick Ta's recent sponsored collaborations (one each for Instagram, TikTok, YouTube).
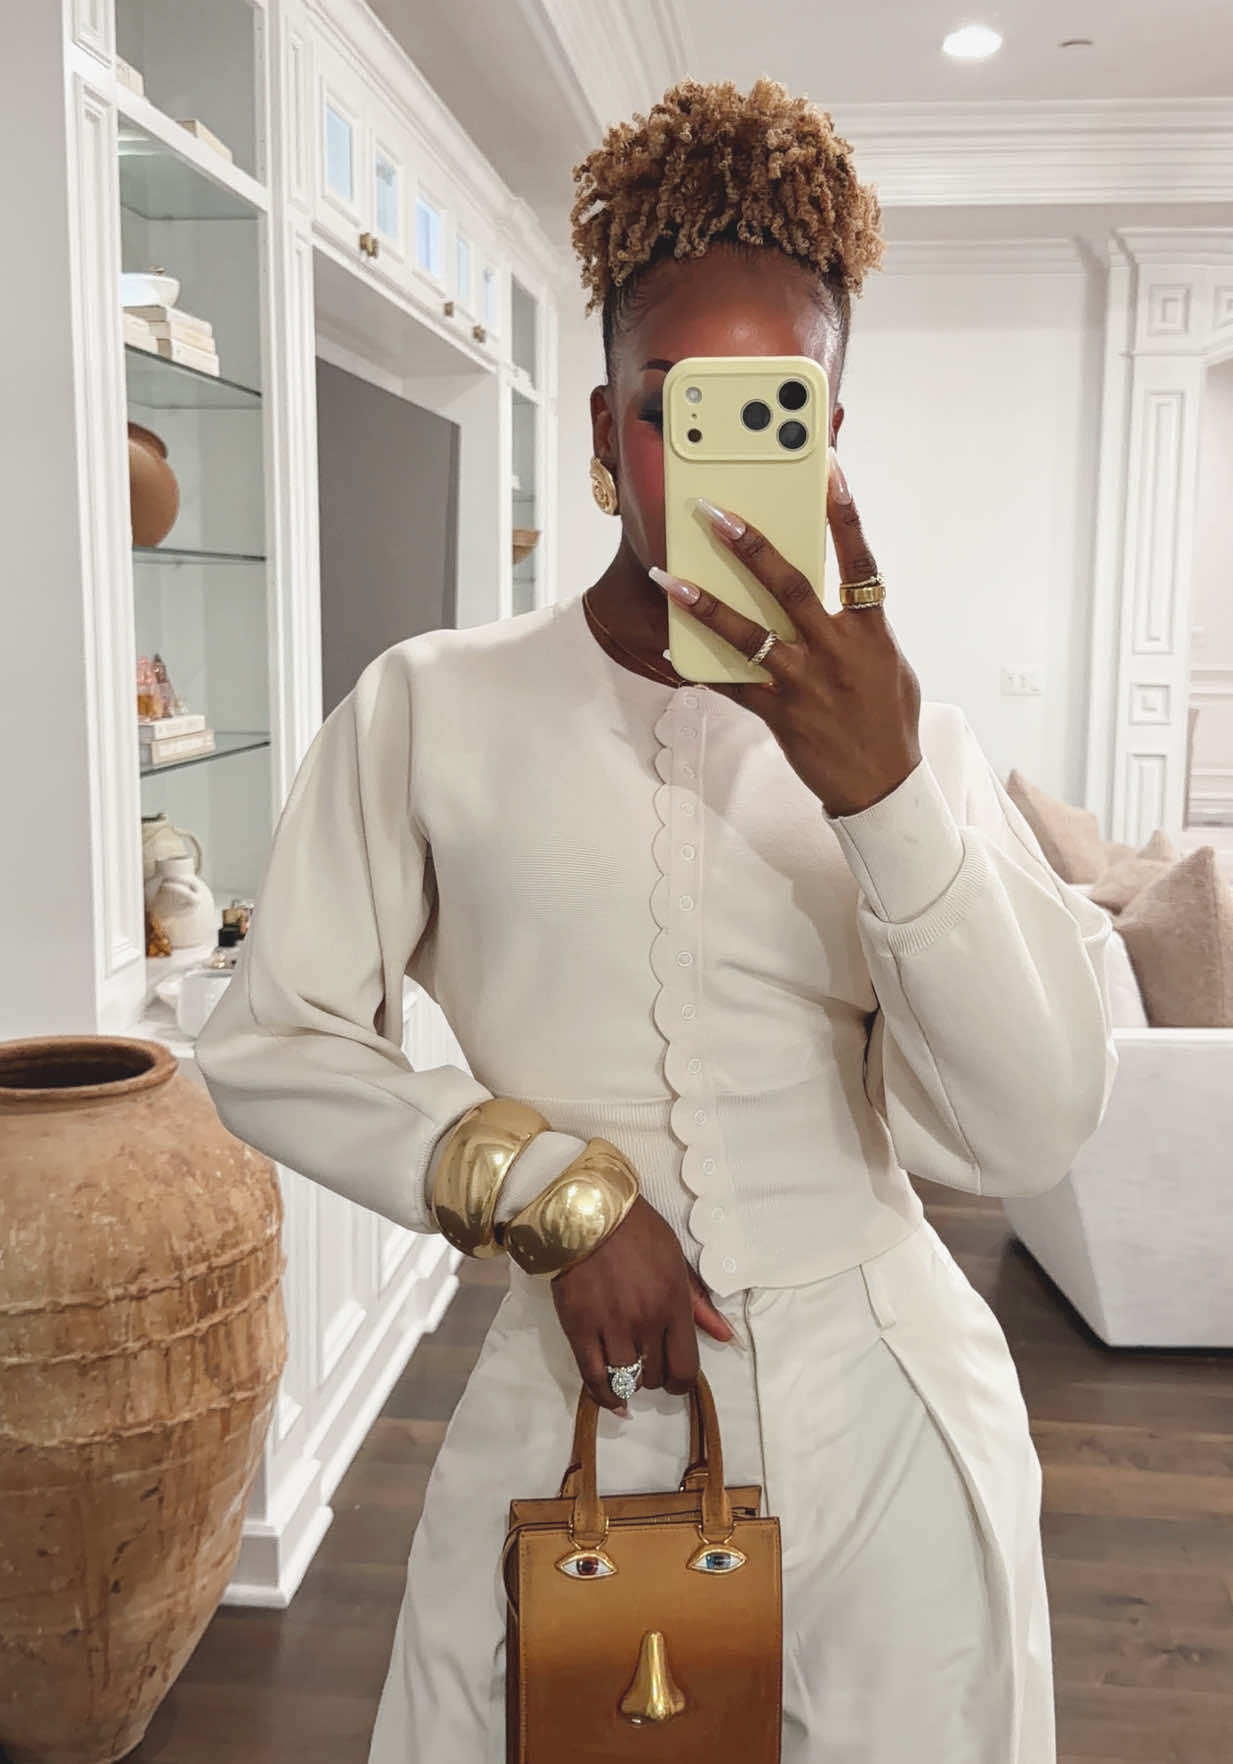
vishakhaholsambre x Patrick Ta
![Instagram post by @vishakhaholsambre for Patrick Ta. Caption reads: [...] in my bio! @sephora @makeupbymario....](https://images.od.modash.io/ddc09b49884f4131f05eeec465e0d30fbb36adc7)
Influencer bio
beauty, fashion, rooted in culture 🦚 🪷 sephora squad ‘25 + alum 📍 new york city 🫶🏽 indian-american 💌 hello@vishakhaholsambre.com @therealdba
Collaboration metrics
Get a free trial to find more data on influencer audiences, performance, and collaborations.
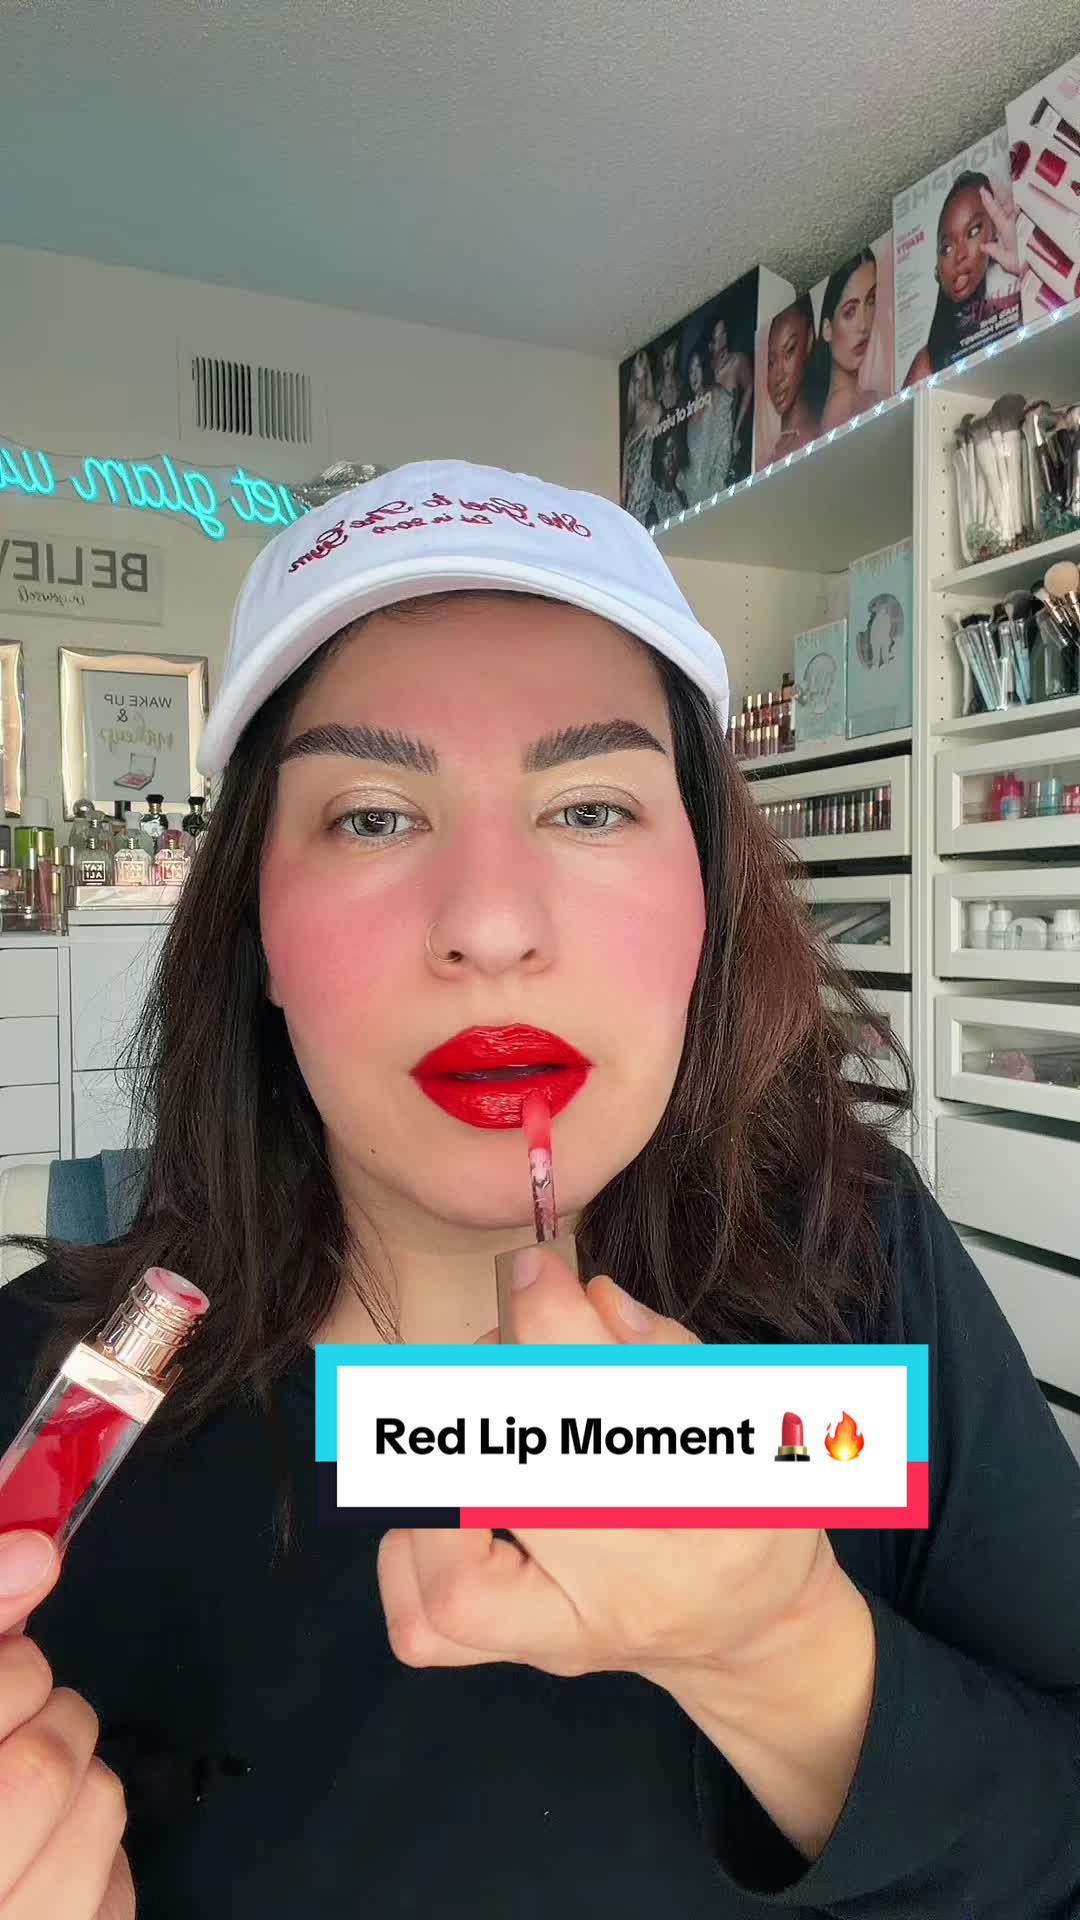
parisberelc x Patrick Ta
![TikTok post by @parisberelc for Patrick Ta. Caption reads: [...] Hair @ONE SIZE BEAUTY @laneige_us @Patrick....](https://images.od.modash.io/8e19f27cb23076529c2a7aca9d30e46a1e4ccbbf)
Influencer bio
"HER" music video out now 🥀 @ellise
Collaboration metrics
Get a free trial to find more data on influencer audiences, performance, and collaborations.
Juuujubeee x Patrick Ta
![YouTube post by @Juuujubeee for Patrick Ta. Caption reads: [...] & Soft Launch✨Available on 1/12 on....](https://images.od.modash.io/a45121d001347674efa8e1b3a2789a0303470362)
Influencer bio
Beauty obsessed
Collaboration metrics
Get a free trial to find more data on influencer audiences, performance, and collaborations.
If you break this down further by content type on TikTok, this is what it looks like:
- Videos: 95.7%
- Carousels: 4.3%
💡 Related resource: How To Find TikTok Influencers.
Influencer audience size breakdown (by views)
For their top social platform (TikTok), here is a breakdown of the type of influencers Patrick Ta are collaborating with, by audience size.
Note: this breakdown is based on each influencer's average views (not follower/subscriber count), because views typically correlate more closely with influencer pricing and impact.
Patrick Ta's influencers average views (TikTok)
Based on each influencer's average views per post
With 34.7% of partnerships featuring creators averaging 1K-5K views, Patrick Ta's strategy suggests niche targeting and authenticity, likely leveraging collaboration models like gifting and affiliates to work with smaller creators. The <1K views segment is also prominent at 26%, indicating investment across adjacent tiers.
Here is an example of a sponsored collaboration with a larger-audience creator on TikTok (1.4M avg views/post):
jackieaina x Patrick Ta
Influencer bio
🇳🇬 ♌️ Co-Founder @FORVR MOOD I am the niche 💁🏾♀️
Collaboration metrics
Get a free trial to find more data on influencer audiences, performance, and collaborations.
And here is another example with a smaller creator on TikTok (10.0k avg views/post):
janayerobinson x Patrick Ta
![TikTok post by @janayerobinson for Patrick Ta. Caption reads: [...] for a night out #bodyoil #bodyglow....](https://images.od.modash.io/bd957f4ad3141277bfd64b1b42eb97db9cb50432)
Influencer bio
FL📍 Giving curly hair & glowy skin tips On KINGS COURT @Bravo @Peacock Janaye@elevenelevencollective.co MY ONLY ACCOUNT ‼️
Collaboration metrics
Get a free trial to find more data on influencer audiences, performance, and collaborations.
Patrick Ta's repeat partnerships
Out of 9.7k unique influencers in our dataset, 852 of them (9%) posted content for Patrick Ta in 3 or more separate calendar months. The most consistent partner is @daniellamagee, who has collaborated across 12 months with 65 total posts.
Here are 3 examples of Patrick Ta's repeat influencer partnerships, with links to the sponsored content.
daniellamagee x Patrick Ta
![TikTok post by @daniellamagee for Patrick Ta. Caption reads: [...] BACK! The limited edition @Patrick Ta Beauty....](https://images.od.modash.io/aa08aec0fc9d4d115f2a1fc3ab149a815a5d25c3)
![TikTok post by @daniellamagee for Patrick Ta. Caption reads: [...] already selling out 💖 @Patrick Ta Beauty....](https://images.od.modash.io/465790f271ca5e4b0775f6ff8e136442f17b6d1a)
![TikTok post by @daniellamagee for Patrick Ta. Caption reads: And ON SALE!!!✨💖👛 @Patrick Ta Beauty [...].](https://images.od.modash.io/cf877724950ebd7a1d618f3b13a7f357ddb096fc)
sarahy_reyesg x Patrick Ta
![TikTok post by @sarahy_reyesg for Patrick Ta. Caption reads: @patrick ta understood the assignment [...].](https://images.od.modash.io/fb9f0d51960b54ef7250efe8db88d0ca5705f214)
![TikTok post by @sarahy_reyesg for Patrick Ta. Caption reads: [...] WISHLIST✨🎄🎀 @Dyson USA @Patrick Ta Beauty....](https://images.od.modash.io/18670130e3f96e23713fefefd1b6e817d242287d)
![TikTok post by @sarahy_reyesg for Patrick Ta. Caption reads: [...] perfect autumn blush 😍🍁🍂 @Patrick Ta....](https://images.od.modash.io/07fa254b1fa7925a269acc3ea0df23e8c72f9164)
get_glam_with_sadaf x Patrick Ta
![TikTok post by @get_glam_with_sadaf for Patrick Ta. Caption reads: @Patrick Ta Beauty 🫶 @patrick ta Major [...].](https://images.od.modash.io/0628bdf4007284f3d8d683aab43aabdad6df9de2)
![TikTok post by @get_glam_with_sadaf for Patrick Ta. Caption reads: [...] @The Estée Lauder Store @Patrick Ta Beauty....](https://images.od.modash.io/c24dc73709d70ebb5b44ad89c23fb38fc7d22940)
💡 Related resource: Long-Term Influencer Partnerships: Pros, Cons & How The Pros Manage Them.
Geographical breakdown
In our dataset, United States is where Patrick Ta had the most influencer activity. 52% of their live influencer content in the last 12 months was posted by American influencers.
Based on the percentage of influencer content per market, other important markets include:
- Mexico (6.6%)
- United Kingdom (6%)
- Brazil (5.9%)
Patrick Ta's influencer activity by market
Here is another example of Patrick Ta collaborating with an influencer in United States.
caseymtzbeauty x Patrick Ta
![Instagram post by @caseymtzbeauty for Patrick Ta. Caption reads: [...] can name a better fall blush than the....](https://images.od.modash.io/660cba8cf2f95ba4a446559ff732b6fd3958b913)
Patrick Ta's influencer activity vs. related brands
Patrick Ta sits alongside MAKEUP BY MARIO and ONE SIZE BEAUTY as artist-founded, technique-driven makeup brands popular with the same beauty-enthusiast audience. They compete through creator tutorials, glam-focused content, and hero-product launches that thrive on social proof.
Total influencer content
Patrick Ta vs. related brands influencer activity
Total sponsored posts tracked (last 12 months)
Patrick Ta leads with 22.4k sponsored posts, notably outpacing MAKEUP BY MARIO (17.3k posts) and ONE SIZE BEAUTY (12.2k posts). Across all three brands, the average volume is 17.3k posts, indicating mature, scaled influencer programs.
By social platform
Patrick Ta vs. related brands influencer activity (by social platform)
Sponsored posts by platform
Patrick Ta leads on Instagram and TikTok, while MAKEUP BY MARIO leads on YouTube. The gap is most notable on TikTok, with Patrick Ta at 17.9k, MAKEUP BY MARIO at 13.6k, ONE SIZE BEAUTY at 12.2k posts. Patrick Ta's activity is particularly concentrated on TikTok. On TikTok and Instagram, Patrick Ta has more posts than MAKEUP BY MARIO and ONE SIZE BEAUTY, while MAKEUP BY MARIO has more posts on YouTube.
By geographical market
Patrick Ta vs. related brands influencer activity (by country)
Estimated sponsored posts in Patrick Ta's top markets
Patrick Ta has the highest estimated sponsored-post volume in United States (12k posts, 52%), Mexico (1.5k posts, 6.6%), United Kingdom (1.3k posts, 6%), suggesting a North America focus, while MAKEUP BY MARIO leads in Brazil with 798 posts (4.6%). Looking at United States specifically, the split is Patrick Ta at 12k posts (52%), MAKEUP BY MARIO at 8.6k posts (49.5%). Patrick Ta's strength in United States and United Kingdom may indicate a home-market focus, while MAKEUP BY MARIO shows broader regional investment.
Read more influencer strategy breakdowns
Looking for more like this? Here are 5 similar influencer marketing strategy breakdowns for other brands:
- MAKEUP BY MARIO's Influencer Marketing Strategy
- ONE SIZE BEAUTY's Influencer Marketing Strategy
- OQHAIR's Influencer Marketing Strategy
- Pink Lily's Influencer Marketing Strategy
- Spark Paws's Influencer Marketing Strategy
Or, if you want to access data like this for your own software or processes, take a look at Modash's API products:
Frequently asked questions
Scaling your influencer program?
When you outgrow your mishmash of spreadsheets & free tools, try Modash. Find & email influencers, track campaigns, ship products & more - all in one place.