Spark Paws Influencer Marketing Strategy
(2026 Data & Insights)
We analyzed 7.3k pieces of influencer content sponsored by Spark Paws over the last 12 months.
This report breaks down where & how Spark Paws invests in influencer marketing, which social platforms they prioritize, top geographical markets, and more.
The data in this report comes from Modash's Brand Collaborations API.
P.S. for a simple list of influencers who have collaborated with Spark Paws, see here: Spark Paws influencers.
Influencer activity throughout the year
Spark Paws's influencer campaigns are active year-round with notable month-to-month fluctuation. The chart below shows month-by-month data for total sponsored posts tracked.
Spark Paws's influencer activity by month
Number of sponsored posts
Spark Paws's influencer output appears relatively consistent throughout the year, averaging about 610 sponsored posts per month. November recorded the highest volume at 960 posts (57% above average), while March was the quietest at 372 posts.
Social platforms breakdown
In our dataset (which only includes Instagram, YouTube, and TikTok), this is how the volume of Spark Paws's sponsored influencer collaborations break down by social platform:
- Instagram: 4.3k posts (58.5%)
- TikTok: 3.0k posts (41.5%)
Spark Paws's influencer activity by platform
Share of sponsored content by social network
Instagram influencer marketing is a clear focus for Spark Paws.
Here are 2 examples of Spark Paws's recent sponsored collaborations (one each for Instagram, TikTok).
bratan.pitmonster x Spark Paws
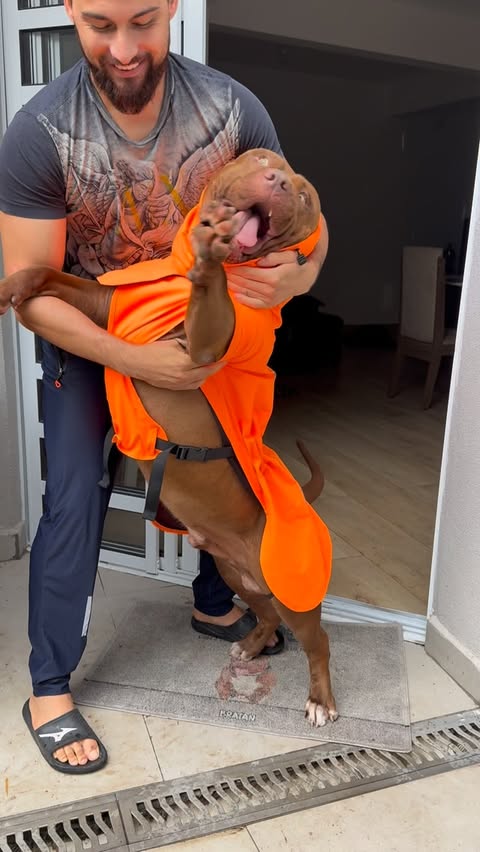
Influencer bio
Aventuras do Gigantossauro Bratan! @buddy.nutrition BRATANBUDDY @bandog_gear 5BRATAN @championpremiumoficial BRATAN15 @lojatapz BRATAN Links ⬇️
Collaboration metrics
Get a free trial to find more data on influencer audiences, performance, and collaborations.
themichellemartinson x Spark Paws
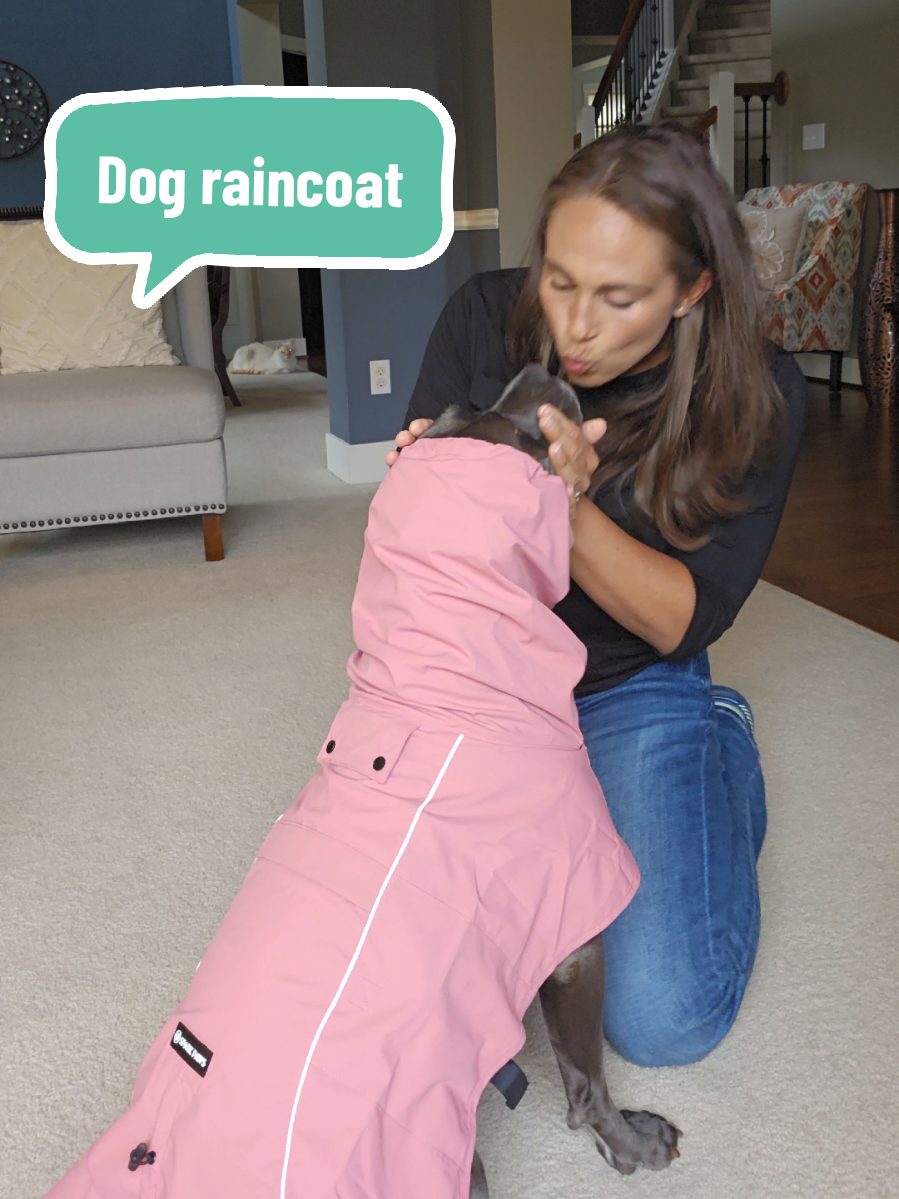
Influencer bio
Sharing life with kitties, a pittie & teens. 🔸 sarcasticcoffeequeen@outlook.com
Collaboration metrics
Get a free trial to find more data on influencer audiences, performance, and collaborations.
If you break this down further by content type on Instagram, this is what it looks like:
- Posts: 57.1%
- Reels: 42.9%
💡 Related resource: How To Find Instagram Influencers.
Influencer audience size breakdown (by views)
For their top social platform (Instagram), here is a breakdown of the type of influencers Spark Paws are collaborating with, by audience size.
Note: this breakdown is based on each influencer's average views (not follower/subscriber count), because views typically correlate more closely with influencer pricing and impact.
Spark Paws's influencers average views (Instagram)
Based on each influencer's average views per post
Spark Paws's creator selection appears relatively diversified across size tiers, with no single segment dominating. This suggests a balanced approach to influencer partnerships, spreading investment across different audience sizes.
Here is an example of a sponsored collaboration with a larger-audience creator on Instagram (55.7k avg views/post):
daria.and.zoe x Spark Paws
Influencer bio
🐾𝙳𝚘𝚐 𝙼𝚘𝚖 𝙻𝚒𝚏𝚎𝚜𝚝𝚢𝚕𝚎 - 𝚁𝚎𝚌𝚒𝚙𝚎𝚜, 𝚁𝚎𝚟𝚒𝚎𝚠𝚜 🗽𝙽𝚈𝙲 → 𝙵𝙻 🌴☀️ 💼𝙾𝚠𝚗𝚎𝚛: @barkandtagco 🛍️𝙰𝚖𝚊𝚣𝚘𝚗 𝙰𝚏𝚏𝚒𝚕𝚒𝚊𝚝𝚎 - 𝙳𝚊𝚒𝚕𝚢 𝙳𝚎𝚊𝚕𝚜 𝚒𝚗 𝚜𝚝𝚘𝚛𝚢🛒 𝚂𝚑𝚘𝚙 𝙾𝚞𝚛 𝙵𝚊𝚟𝚘𝚛𝚒𝚝𝚎𝚜 ↓
Collaboration metrics
Get a free trial to find more data on influencer audiences, performance, and collaborations.
And here is another example with a smaller creator on Instagram (6.3k avg views/post):
mooseyandjade_ x Spark Paws
![Instagram post by @mooseyandjade_ for Spark Paws. Caption reads: [...] in our bio to save 15% on your order!....](https://images.od.modash.io/20aaab14e5a2b28851b25c8eeeeb5f71078dbc18)
Influencer bio
🌸 Just a girl & her (♂) dog 💜 Devon, UK ✨ #MooseysMotivationalMonday
Collaboration metrics
Get a free trial to find more data on influencer audiences, performance, and collaborations.
Spark Paws's repeat partnerships
Out of 1.6k unique influencers in our dataset, 323 of them (21%) posted content for Spark Paws in 3 or more separate calendar months. The most consistent partner is @chocolatelabsimba, who has collaborated across 12 months with 239 total posts.
Here are 3 examples of Spark Paws's repeat influencer partnerships, with links to the sponsored content.
chocolatelabsimba x Spark Paws
![Instagram post by @chocolatelabsimba for Spark Paws. Caption reads: [...] and stylish. 😉 Thank you @sparkpawsofficial....](https://images.od.modash.io/9bdad0575eaaa694aae0cb3024ffcb8b07774cf5)
![Instagram post by @chocolatelabsimba for Spark Paws. Caption reads: [...] How you like my new @sparkpawsofficial....](https://images.od.modash.io/9823aaa66ae045b55b2e7b389e419f95f510fec0)
![Instagram post by @chocolatelabsimba for Spark Paws. Caption reads: [...] and… Spooky Season!! 🍂👻 @sparkpawsofficial....](https://images.od.modash.io/7060c7f38ca681e6e5a0f51c9edfc9d0e7614a11)
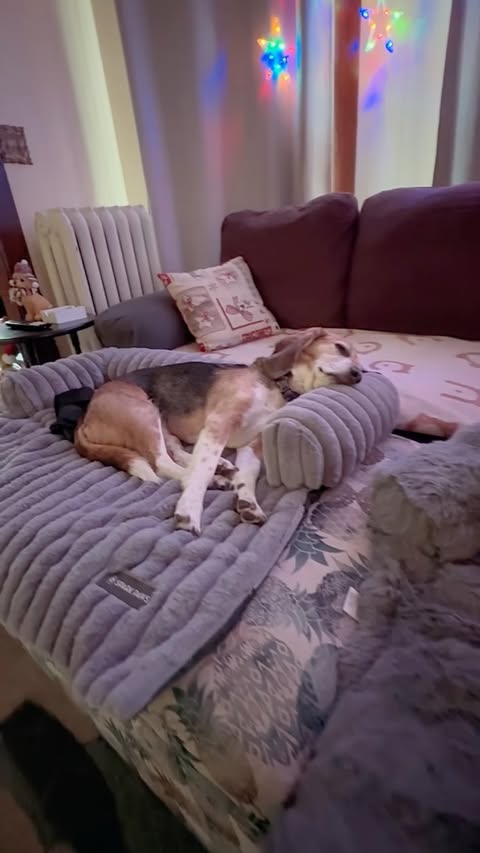
beagdealzumma x Spark Paws
![Instagram post by @beagdealzumma for Spark Paws. Caption reads: [...] super excited when their @sparkpawsofficial....](https://images.od.modash.io/13a17ce478f7700e0108f1025869b0686c9116aa)
hugsydaisy x Spark Paws
![Instagram post by @hugsydaisy for Spark Paws. Caption reads: [...] Bear Sweater in size L from....](https://images.od.modash.io/9967edbda96148a297fd761e4179344a2d8d4dea)
![Instagram post by @hugsydaisy for Spark Paws. Caption reads: [...] Raincoat from @sparkpawsofficial 🏷️HUGSY15....](https://images.od.modash.io/fd2c412d62e398519d995753f2235068a090038e)
![Instagram post by @hugsydaisy for Spark Paws. Caption reads: [...] Sunblock tee from @sparkpawsofficial....](https://images.od.modash.io/ec0eb6c3c395195cf7968f5f12ef42a77adf708a)
💡 Related resource: Long-Term Influencer Partnerships: Pros, Cons & How The Pros Manage Them.
Geographical breakdown
In our dataset, United States is where Spark Paws had the most influencer activity. 55.4% of their live influencer content in the last 12 months was posted by American influencers.
Based on the percentage of influencer content per market, other important markets include:
- United Kingdom (15.2%)
- Canada (6%)
- Brazil (5.6%)
Spark Paws's influencer activity by market
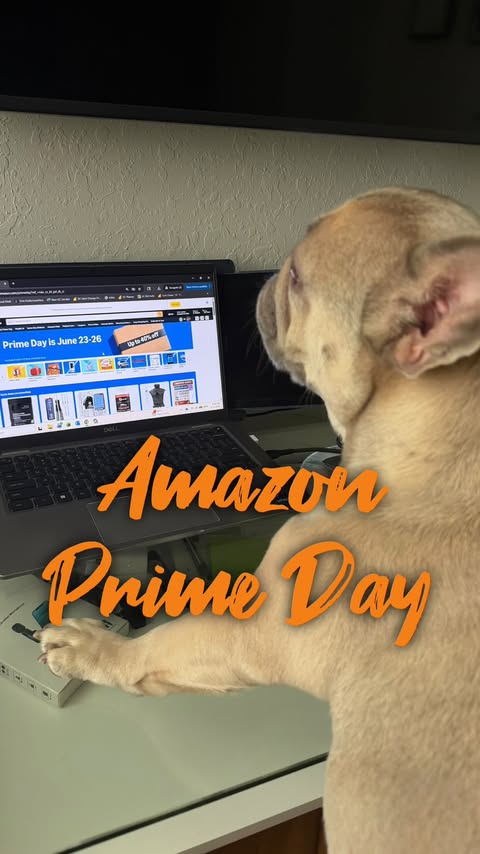
Here is another example of Spark Paws collaborating with an influencer in United States.
topgunnyy x Spark Paws
![TikTok post by @topgunnyy for Spark Paws. Caption reads: [...] is officially in session🎄🎅🏻 Pjs: @SPARK....](https://images.od.modash.io/c4eba7e17d2c455ac8ddd8cda9fe74c5406c7d11)
Spark Paws's influencer activity vs. related brands
Native Pet and Open Farm Pet are both direct-to-consumer pet brands competing for the same dog-owner audience and spend heavily on social and influencer marketing. They’re realistic peers to Spark Paws in the broader premium pet lifestyle/wellness space.
Total influencer content
Spark Paws vs. related brands influencer activity
Total sponsored posts tracked (last 12 months)
Spark Paws leads with 7.3k sponsored posts, significantly outpacing Native Pet (4.8k posts) and Open Farm Pet (4.2k posts). Across all three brands, the average volume is 5.4k posts, indicating mature, scaled influencer programs. Spark Paws has more total posts than Native Pet and Open Farm Pet.
By social platform
Spark Paws vs. related brands influencer activity (by social platform)
Sponsored posts by platform
Spark Paws leads on Instagram, while Native Pet has the most activity on TikTok and YouTube. The gap is most notable on Instagram, with Spark Paws at 4.3k, Open Farm Pet at 2.2k, Native Pet at 508 posts. Native Pet's activity is particularly concentrated on TikTok. On Instagram, Spark Paws has several times more posts than Native Pet, and on YouTube Spark Paws has no posts while Native Pet and Open Farm Pet have a small number.
By geographical market
Spark Paws vs. related brands influencer activity (by country)
Estimated sponsored posts in Spark Paws's top markets
Spark Paws has the highest estimated sponsored-post volume in United States (4.1k posts, 55.4%), United Kingdom (1.1k posts, 15.2%), Canada (440 posts, 6%), suggesting a North America focus. Looking at United States specifically, the split is Spark Paws at 4.1k posts (55.4%), Native Pet at 3.6k posts (73.9%), Open Farm Pet at 3k posts (72%).
Read more influencer strategy breakdowns
Looking for more like this? Here are 5 similar influencer marketing strategy breakdowns for other brands:
- Native Pet's Influencer Marketing Strategy
- Open Farm Pet's Influencer Marketing Strategy
- Kate Somerville's Influencer Marketing Strategy
- zasuwasportswear's Influencer Marketing Strategy
- Give Me Cosmetics's Influencer Marketing Strategy
Or, if you want to access data like this for your own software or processes, take a look at Modash's API products:
Frequently asked questions
Scaling your influencer program?
When you outgrow your mishmash of spreadsheets & free tools, try Modash. Find & email influencers, track campaigns, ship products & more - all in one place.