SOJOS VISION Influencer Marketing Strategy
(2026 Data & Insights)
We analyzed 3.0k pieces of influencer content sponsored by SOJOS VISION over the last 12 months.
This report breaks down where & how SOJOS VISION invests in influencer marketing, which social platforms they prioritize, top geographical markets, and more.
The data in this report comes from Modash's Brand Collaborations API.
P.S. for a simple list of influencers who have collaborated with SOJOS VISION, see here: SOJOS VISION influencers.
Influencer activity throughout the year
SOJOS VISION's influencer campaigns are active year-round with notable month-to-month fluctuation. The chart below shows month-by-month data for total sponsored posts tracked.
SOJOS VISION's influencer activity by month
Number of sponsored posts
SOJOS VISION's sponsored post volume appears to trend upward over the 12-month period, rising from 185 posts in January to 171 in December. The peak month, July, reached 566 posts, 127% higher than the monthly average of 249.
Social platforms breakdown
In our dataset (which only includes Instagram, YouTube, and TikTok), this is how the volume of SOJOS VISION's sponsored influencer collaborations break down by social platform:
- Instagram: 1.5k posts (51.5%)
- TikTok: 1.4k posts (47.4%)
- YouTube: 33 posts (1.1%)
SOJOS VISION's influencer activity by platform
Share of sponsored content by social network
Instagram influencer marketing is a clear focus for SOJOS VISION.
Here are 3 examples of SOJOS VISION's recent sponsored collaborations (one each for Instagram, TikTok, YouTube).
rittakortava x SOJOS VISION
Influencer bio
◾️UGC l Content Creator ◾️FASHION | BEAUTY ✉️ rita.kortava99@gmail.com 📩collabinquiry.rittakortava@gmail.com
Collaboration metrics
Get a free trial to find more data on influencer audiences, performance, and collaborations.
leaxjane x SOJOS VISION
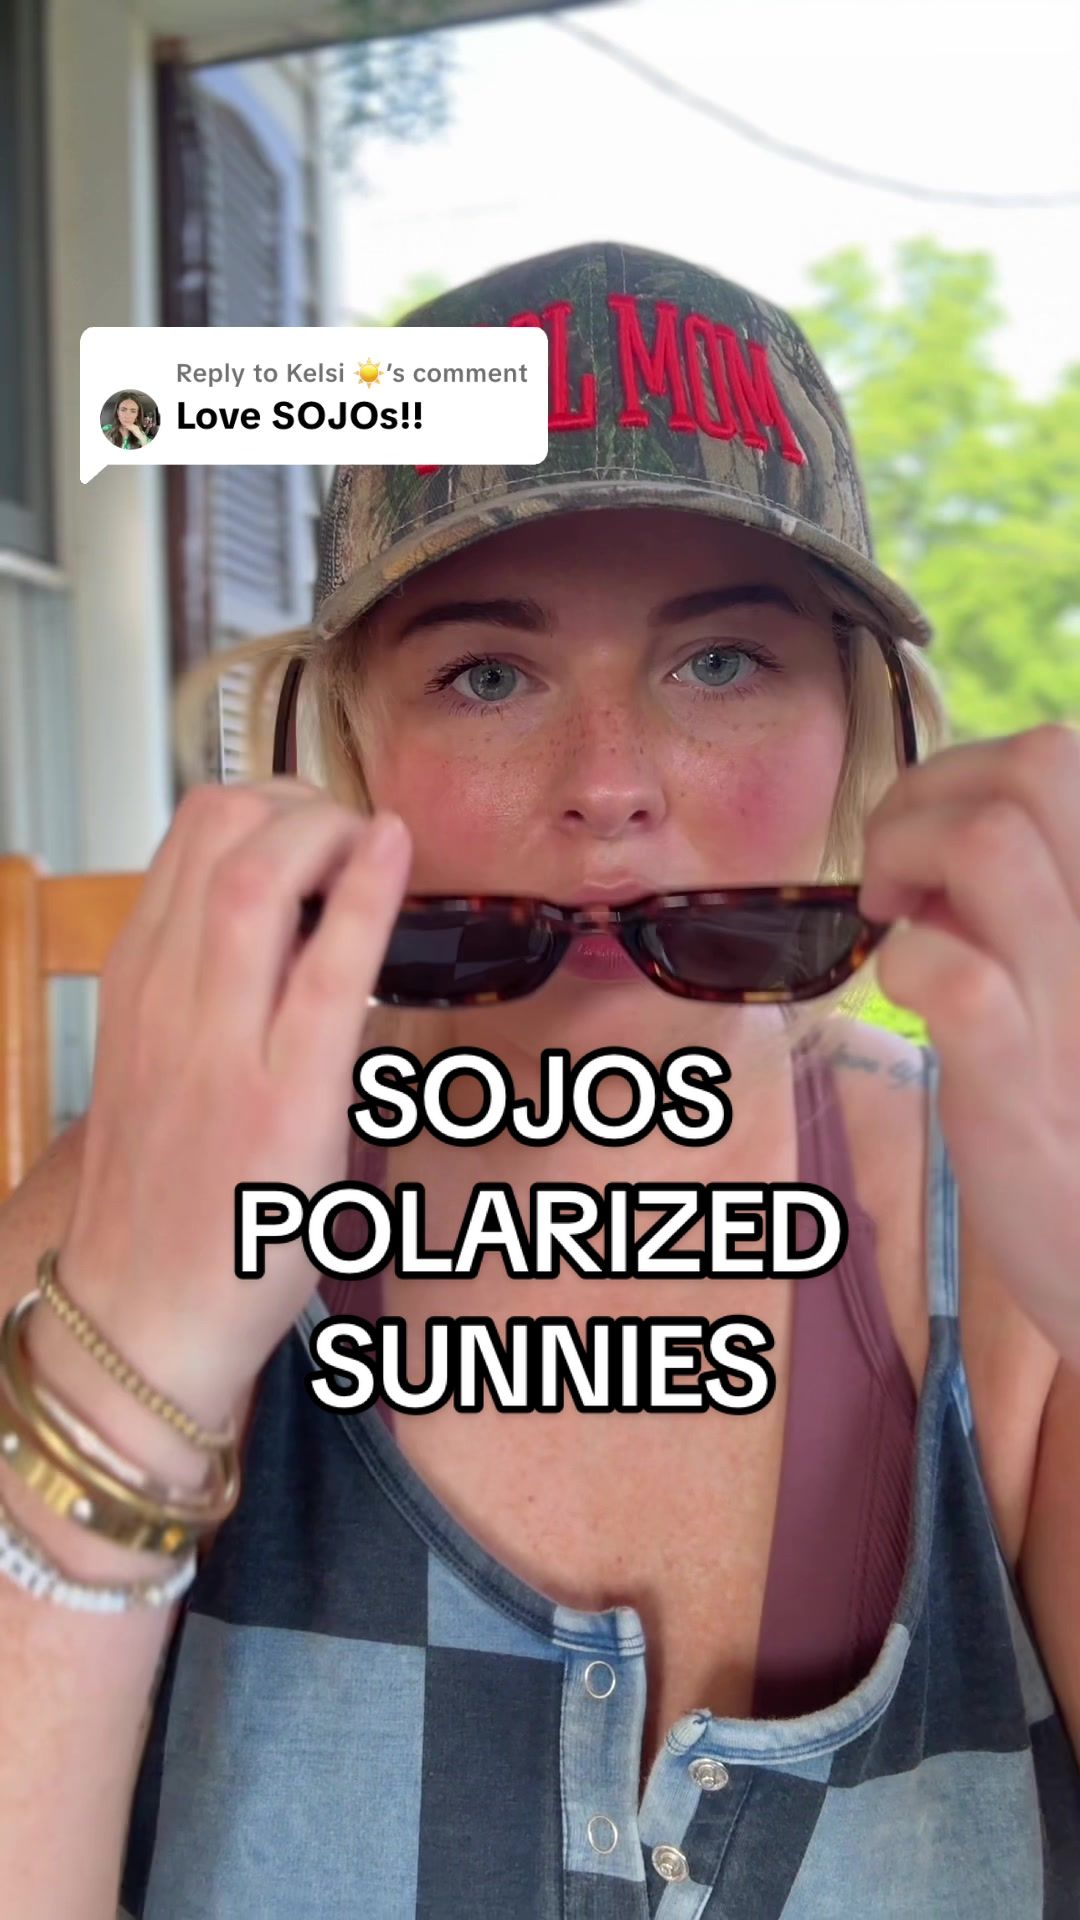
Influencer bio
Mom of Twins Size 6 C-section belly Fashion Boho, alt, athleisure Little bit of beauty 💌 Leaxjane3@gmail.com
Collaboration metrics
Get a free trial to find more data on influencer audiences, performance, and collaborations.
FASHIONSTYLETV x SOJOS VISION
![YouTube post by @FASHIONSTYLETV for SOJOS VISION. Caption reads: [...] TV. OCEANUS Swimwear partnered with Sojos....](https://images.od.modash.io/b421ce69b02b178064512648b5f549e3d5ae4c92)
Influencer bio
FASHION & STYLE 4K (F&S 4K) is an international TV channel about the whole world of fashion and lifestyle in an exceptional UHD 4K quality. Comprehensive and timely coverage of mainstream fashion events. Fashion shows, glamorous parties, private events. Backstage exclusives with designers, models, make-up artists, art and creative directors, influencers. Comfort and class of luxury lifestyle. Magnificent estates, spectacular boat shows, super car events. F&S dance Fitness to keep you fit. Production is done worldwide by our professional videographer crew in 8K or 4K with multichannel surround sound, multicamera shooting, aerial drone videography, with up to 30 mics for superb recording. We are proud of our own postproduction team of high-level professionals, own production facility, state of the art professional equipment. https://www.fashion-style.tv https://www.youtube.com/c/FASHIONSTYLETV https://www.instagram.com/fashionstyletv/ https://www.facebook.com/FashionStyleTVchannel
Collaboration metrics
Get a free trial to find more data on influencer audiences, performance, and collaborations.
If you break this down further by content type on Instagram, this is what it looks like:
- Reels: 61.4%
- Posts: 38.6%
💡 Related resource: How To Find Instagram Influencers.
Influencer audience size breakdown (by views)
For their top social platform (Instagram), here is a breakdown of the type of influencers SOJOS VISION are collaborating with, by audience size.
Note: this breakdown is based on each influencer's average views (not follower/subscriber count), because views typically correlate more closely with influencer pricing and impact.
SOJOS VISION's influencers average views (Instagram)
Based on each influencer's average views per post
SOJOS VISION's creator selection appears relatively diversified across size tiers, with no single segment dominating. This suggests a balanced approach to influencer partnerships, spreading investment across different audience sizes.
Here is an example of a sponsored collaboration with a larger-audience creator on Instagram (316.4k avg views/post):
etunaab x SOJOS VISION
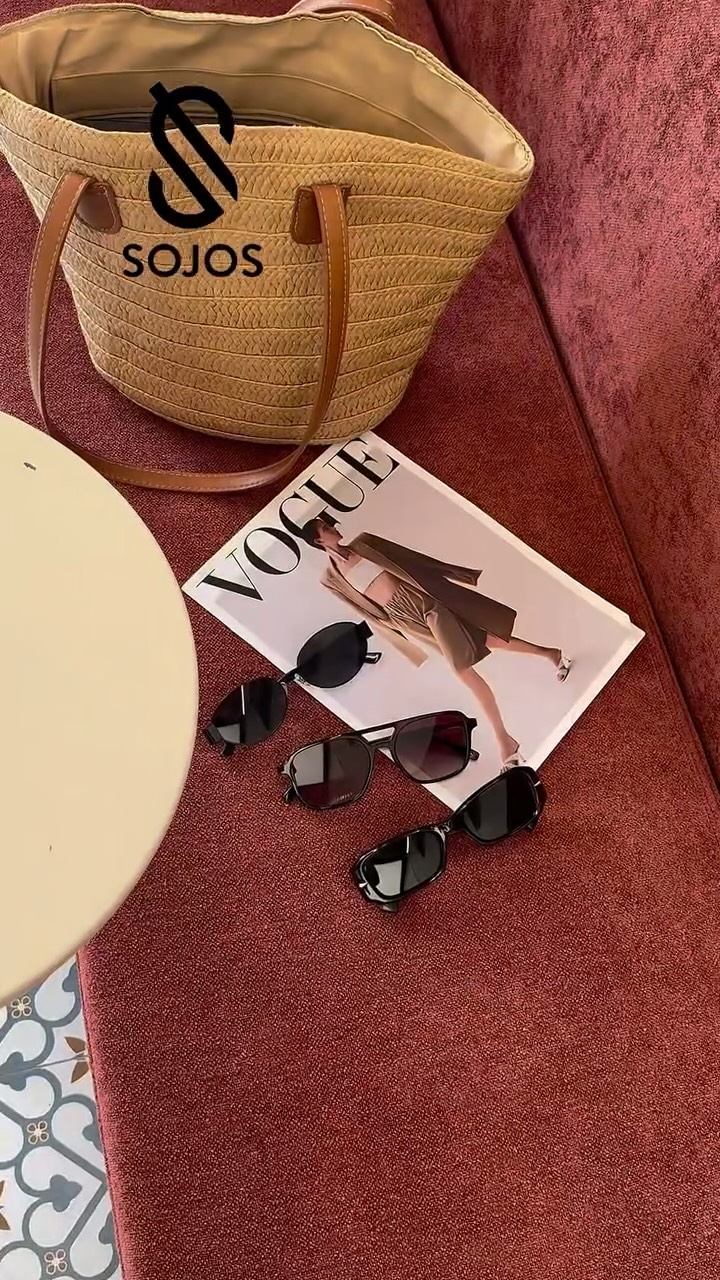
Influencer bio
UGC & Lifestyle, Skincare Creator 📬 Let’s collab: etunaab@gmail.com
Collaboration metrics
Get a free trial to find more data on influencer audiences, performance, and collaborations.
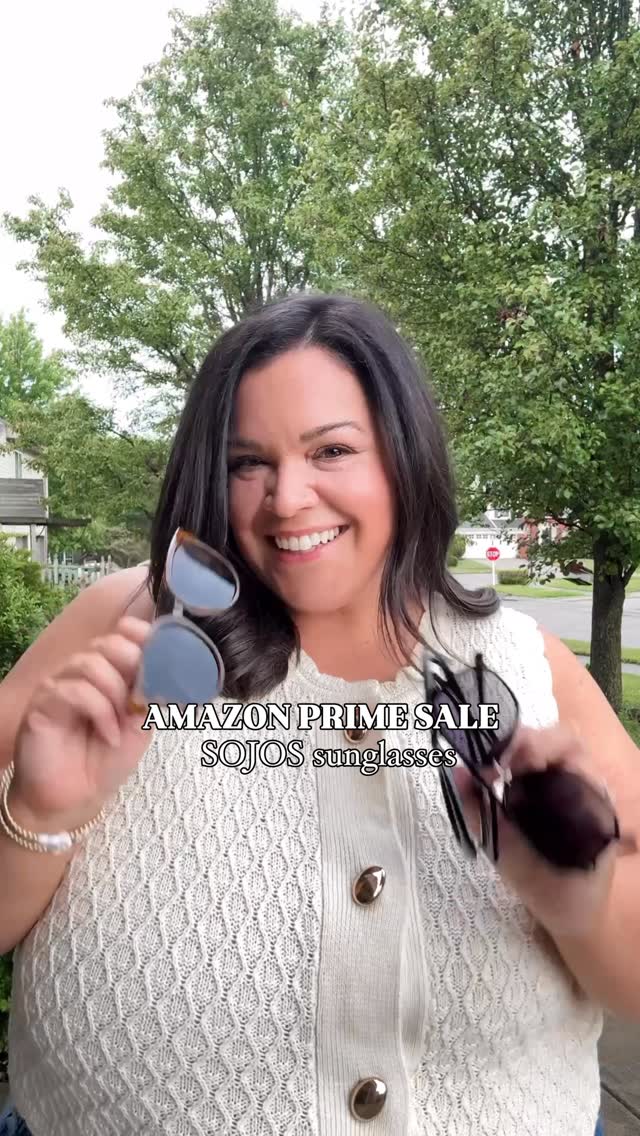
And here is another example with a smaller creator on Instagram (9.8k avg views/post):
natalie.kiddey x SOJOS VISION
Influencer bio
plus size petite fashion for women ready to feel more confident Outfit inspo + mom life + family faves Cincinnati girl shop what I love ⬇️
Collaboration metrics
Get a free trial to find more data on influencer audiences, performance, and collaborations.
SOJOS VISION's repeat partnerships
Out of 1.8k unique influencers in our dataset, 56 of them (3%) posted content for SOJOS VISION in 3 or more separate calendar months. The most consistent partner is @suzy_edward, who has collaborated across 7 months with 15 total posts.
Here are 3 examples of SOJOS VISION's repeat influencer partnerships, with links to the sponsored content.
suzy_edward x SOJOS VISION
![Instagram post by @suzy_edward for SOJOS VISION. Caption reads: [...] Which one is your favorite? @sojosvision....](https://images.od.modash.io/40953dfb77cfe891bc38c3a289c8dcf921f12fbd)
![Instagram post by @suzy_edward for SOJOS VISION. Caption reads: [...] Which one is your favorite? @sojosvision....](https://images.od.modash.io/e410b0f0ad390ecea5e224522fbefc9c4a23e4a1)
![Instagram post by @suzy_edward for SOJOS VISION. Caption reads: [...] 🫶🏻 🕶️ Sunglasses 👇🏻 @sojosvision....](https://images.od.modash.io/774dc689f8902b4e31e27bab4c6b4bffa5a4f1e5)
leah_sojosvision x SOJOS VISION
![Instagram post by @leah_sojosvision for SOJOS VISION. Caption reads: [...] help protect the ocean 💙 @sojosvision....](https://images.od.modash.io/b8ea0790904e6a643b2bb843057ea18aba41b4dd)
![Instagram post by @leah_sojosvision for SOJOS VISION. Caption reads: [...] narrow cat-eye sunnies from @sojosvision....](https://images.od.modash.io/3968a87ab112fb3d686f5e229f3f0802dbf411ed)
![Instagram post by @leah_sojosvision for SOJOS VISION. Caption reads: [...] round cat-eye sunnies from @sojosvision are....](https://images.od.modash.io/4c124df4e6901e6c7a353f8cb5acacf72ab32375)
kellie.navarro x SOJOS VISION
![TikTok post by @kellie.navarro for SOJOS VISION. Caption reads: [...] storefront! 🫶🏼 #sojos #sojosvision....](https://images.od.modash.io/9333c2f0451356f4699b6f007d54ea00778ea4c0)
💡 Related resource: Long-Term Influencer Partnerships: Pros, Cons & How The Pros Manage Them.
Geographical breakdown
In our dataset, United States is where SOJOS VISION had the most influencer activity. 62.8% of their live influencer content in the last 12 months was posted by American influencers.
Based on the percentage of influencer content per market, other important markets include:
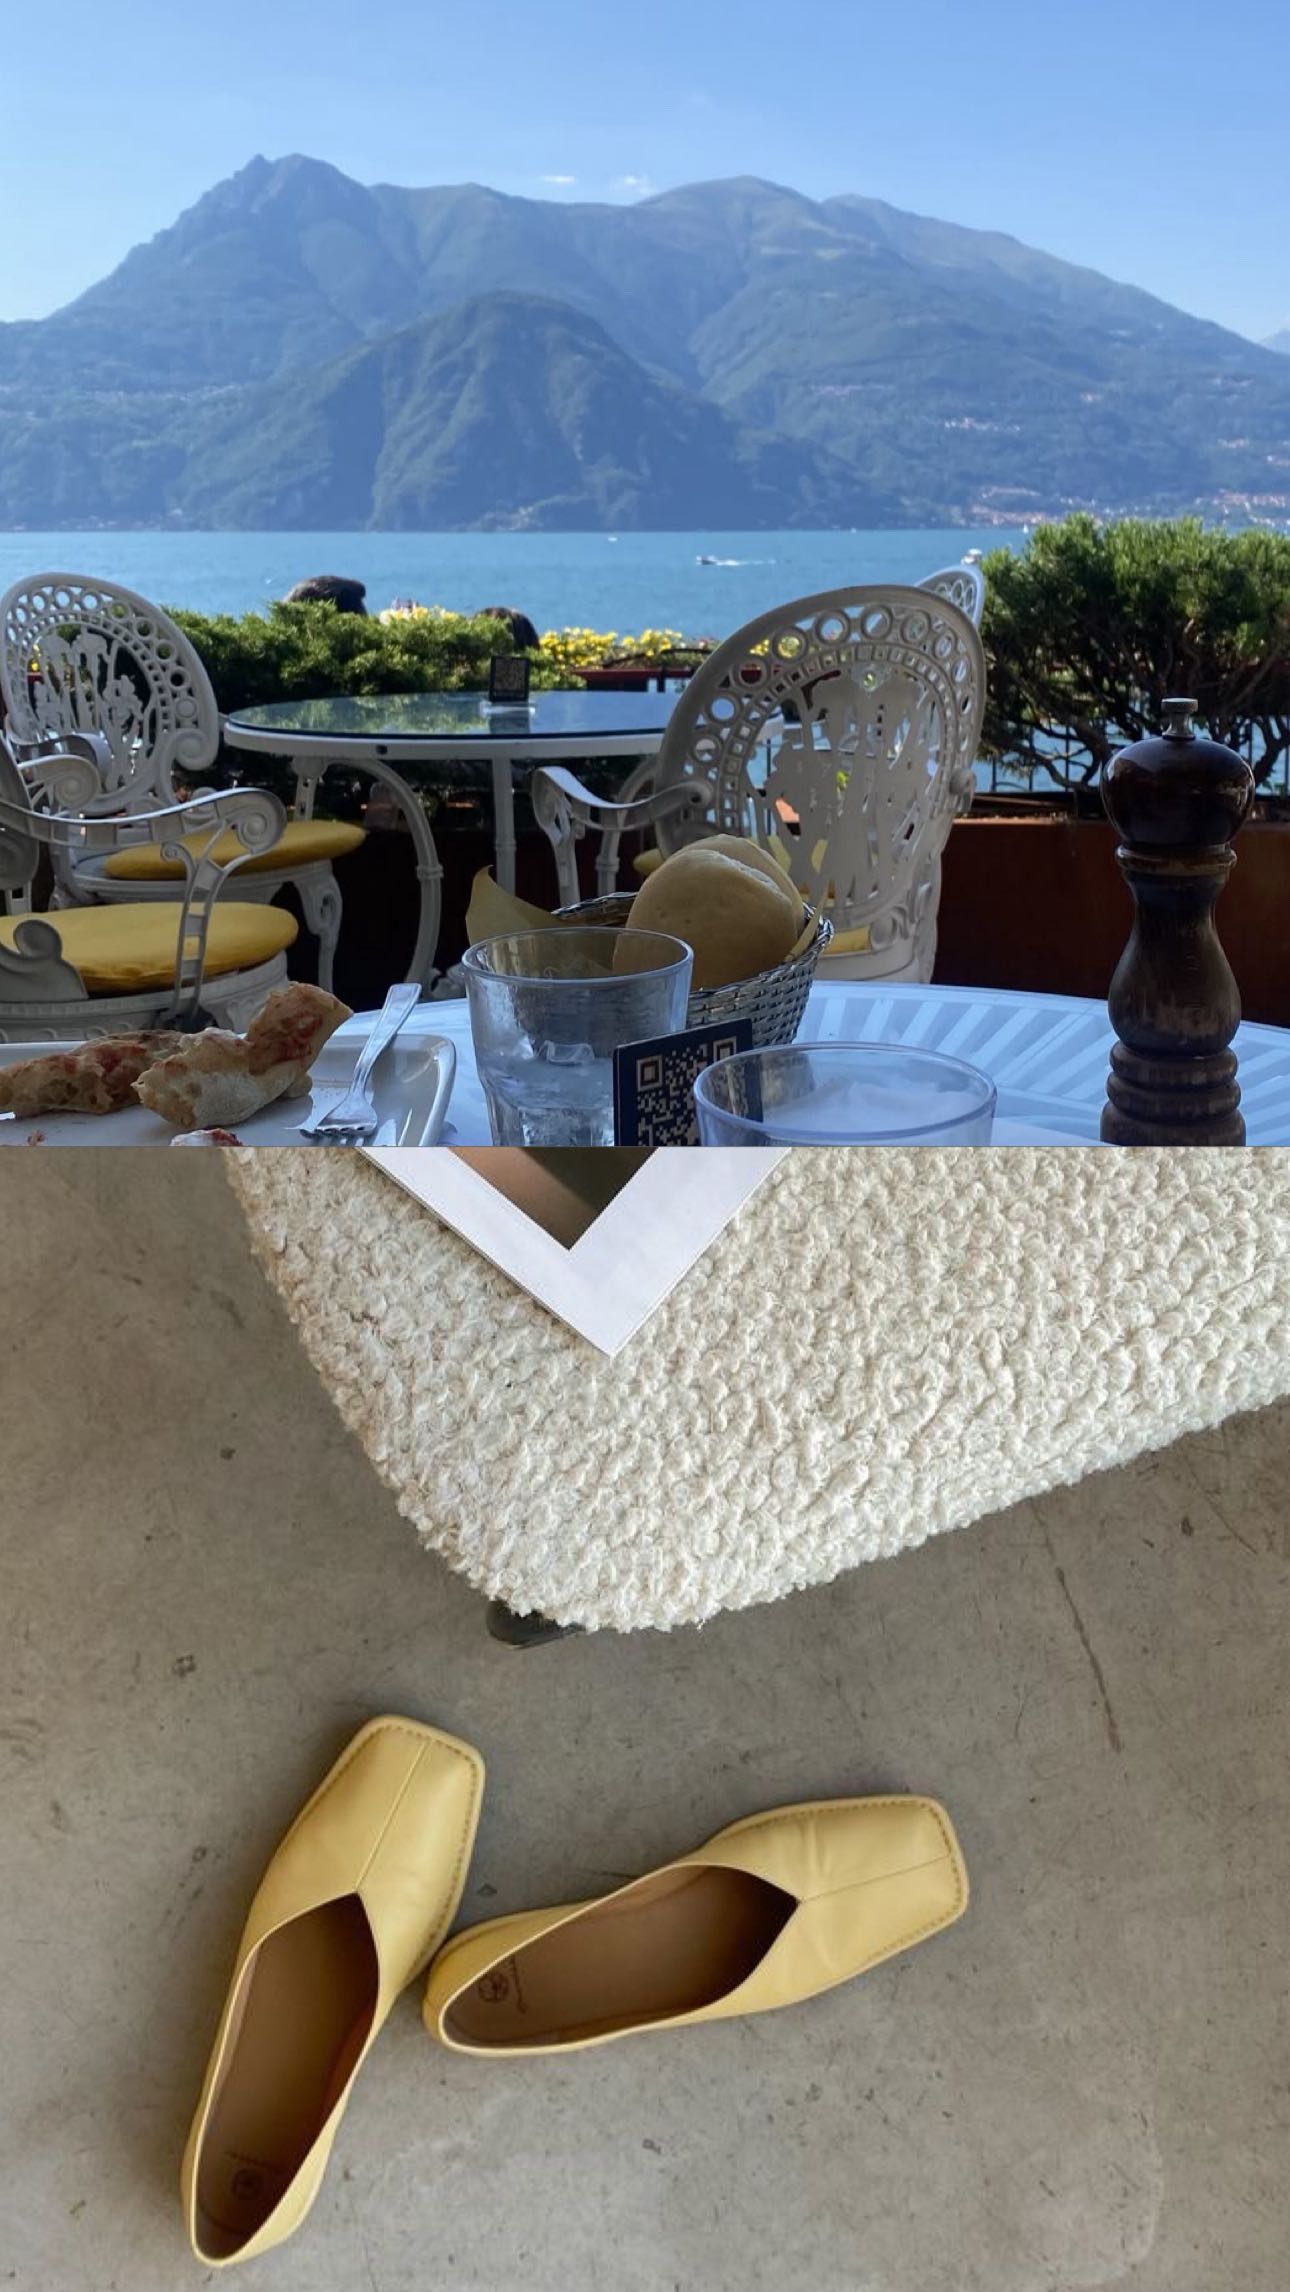
- Italy (5.4%)
- Brazil (3.9%)
- India (3.6%)
SOJOS VISION's influencer activity by market
Here is another example of SOJOS VISION collaborating with an influencer in United States.
usa.mamalife x SOJOS VISION
SOJOS VISION's influencer activity vs. related brands
SOJOS VISION competes in affordable sunglasses, overlapping with QUAY’s fashion-forward eyewear and Goodr’s active-lifestyle sunglasses niche. These brands share creator-driven styling content and seasonal accessory demand.
Total influencer content
SOJOS VISION vs. related brands influencer activity
Total sponsored posts tracked (last 12 months)
SOJOS VISION leads with 3k sponsored posts, marginally ahead of Goodr (2.9k posts) and QUAY (1.9k posts). Across all three brands, the average volume is 2.6k posts, indicating mature, scaled influencer programs.
By social platform
SOJOS VISION vs. related brands influencer activity (by social platform)
Sponsored posts by platform
SOJOS VISION leads on Instagram, while Goodr has the most activity on TikTok and YouTube. The gap is most notable on Instagram, with SOJOS VISION at 1.5k, Goodr at 1.1k, QUAY at 563 posts. On Instagram, SOJOS VISION has multiple times the number of posts as QUAY.
By geographical market
SOJOS VISION vs. related brands influencer activity (by country)
Estimated sponsored posts in SOJOS VISION's top markets
Goodr has the highest estimated sponsored-post volume in United States (2k posts, 71%), United Kingdom (170 posts, 5.9%), Canada (107 posts, 3.7%), suggesting a North America focus, while SOJOS VISION has the highest estimated sponsored-post volume in Italy (161 posts, 5.4%), Brazil (117 posts, 3.9%), while QUAY leads in Australia with 91 posts (4.9%). Looking at United States specifically, the split is Goodr at 2k posts (71%), SOJOS VISION at 1.9k posts (62.8%), QUAY at 1.2k posts (65.2%).
Read more influencer strategy breakdowns
Looking for more like this? Here are 5 similar influencer marketing strategy breakdowns for other brands:
- QUAY's Influencer Marketing Strategy
- Goodr's Influencer Marketing Strategy
- NAKED SUNDAYS's Influencer Marketing Strategy
- CAKES Body's Influencer Marketing Strategy
- TokyoTreat's Influencer Marketing Strategy
Or, if you want to access data like this for your own software or processes, take a look at Modash's API products:
Frequently asked questions
Scaling your influencer program?
When you outgrow your mishmash of spreadsheets & free tools, try Modash. Find & email influencers, track campaigns, ship products & more - all in one place.