Son de Flor Influencer Marketing Strategy
(2026 Data & Insights)
We analyzed 3.3k pieces of influencer content sponsored by Son de Flor over the last 12 months.
This report breaks down where & how Son de Flor invests in influencer marketing, which social platforms they prioritize, top geographical markets, and more.
The data in this report comes from Modash's Brand Collaborations API.
P.S. for a simple list of influencers who have collaborated with Son de Flor, see here: Son de Flor influencers.
Influencer activity throughout the year
Son de Flor's influencer campaigns are active year-round with notable month-to-month fluctuation. The chart below shows month-by-month data for total sponsored posts tracked.
Son de Flor's influencer activity by month
Number of sponsored posts
Son de Flor's influencer output appears relatively consistent throughout the year, averaging about 275 sponsored posts per month. October recorded the highest volume at 412 posts (50% above average), while June was the quietest at 164 posts.
Social platforms breakdown
In our dataset (which only includes Instagram, YouTube, and TikTok), this is how the volume of Son de Flor's sponsored influencer collaborations break down by social platform:
- Instagram: 2.9k posts (86.4%)
- TikTok: 348 posts (10.5%)
- YouTube: 103 posts (3.1%)
Son de Flor's influencer activity by platform
Share of sponsored content by social network
Instagram influencer marketing is a clear focus for Son de Flor.
Here are 3 examples of Son de Flor's recent sponsored collaborations (one each for Instagram, TikTok, YouTube).
lira__karina x Son de Flor
![Instagram post by @lira__karina for Son de Flor. Caption reads: [...] love Deftones too! I’m wearing full....](https://images.od.modash.io/a449f132974cd648b0ed063662f3881c36abf0a9)
Influencer bio
Empowering by dark femininity 📍🇬🇧London 📷Photography @lira_karina_photo 🇺🇦Ukrainian
Collaboration metrics
Get a free trial to find more data on influencer audiences, performance, and collaborations.
delashhhh x Son de Flor
![TikTok post by @delashhhh for Son de Flor. Caption reads: [...] aubergine dress🫶🏼 gifted from @Son de Flor....](https://images.od.modash.io/dd0550d4637f9a66a5babacd16babf55ad3aa148)
Influencer bio
romanticising my life✨ whimsical outfits & fairytale worlds 💌delashhhh@gmail.com
Collaboration metrics
Get a free trial to find more data on influencer audiences, performance, and collaborations.
MotherTheMountain x Son de Flor

Influencer bio
We are sisters, Anastasia & Julia Vanderbyl 🌱 A few years ago, we began a journey to live a life in perfect harmony with nature. A life of caring for animals, growing tropical fruit, planting trees, gardening, cooking, creating, building and learning to live with the land. In this time, nature has taught us more than we could have ever imagined. Our environmental films document the landscape and the lessons we’ve learnt in our work as regenerative farmers here on Bundjalung Country. We live on the land of the Arakwal and Minjungbal People of the Bundjalung Nation. We acknowledge the Traditional Custodians of the Country we live on and recognise their continuing connection to the land and waters. We thank them for protecting this rainforest and its ecosystems since time immemorial.
Collaboration metrics
Get a free trial to find more data on influencer audiences, performance, and collaborations.
If you break this down further by content type on Instagram, this is what it looks like:
- Posts: 51.6%
- Reels: 48.4%
💡 Related resource: How To Find Instagram Influencers.
Influencer audience size breakdown (by views)
For their top social platform (Instagram), here is a breakdown of the type of influencers Son de Flor are collaborating with, by audience size.
Note: this breakdown is based on each influencer's average views (not follower/subscriber count), because views typically correlate more closely with influencer pricing and impact.
Son de Flor's influencers average views (Instagram)
Based on each influencer's average views per post
Son de Flor's creator selection appears relatively diversified across size tiers, with no single segment dominating. This suggests a balanced approach to influencer partnerships, spreading investment across different audience sizes.
Here is an example of a sponsored collaboration with a larger-audience creator on Instagram (470.8k avg views/post):
ellens_welt x Son de Flor
![Instagram post by @ellens_welt for Son de Flor. Caption reads: [...] And how gorgeous are these dresses by....](https://images.od.modash.io/29d05cc0e1f2e8ffdfd111ccb32c185060862805)
Influencer bio
🌹 Zeit ist immer im Fluss ... schenkt Erinnerungen ... einen Teil halten wir fest ... in Worten ... auf Bildern ... 🌹EINIGE🌹Teile ich mit euch ... 🌹
Collaboration metrics
Get a free trial to find more data on influencer audiences, performance, and collaborations.
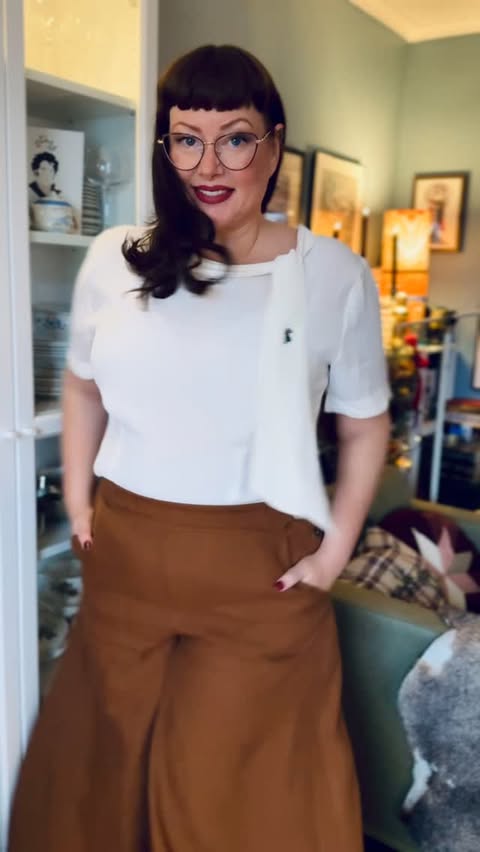
And here is another example with a smaller creator on Instagram (9.8k avg views/post):
maimagi x Son de Flor
![Instagram post by @maimagi for Son de Flor. Caption reads: [...] Skirt kindly gifted by the amazing....](https://images.od.modash.io/51e43c225e93819f85756ff60f8f240aa6d32d2c)
Influencer bio
🌿 Danish creatrix 💚 Sustainable fashion & slow living 🌱 Shop: @creations.by.magi
Collaboration metrics
Get a free trial to find more data on influencer audiences, performance, and collaborations.
Son de Flor's repeat partnerships
Out of 1k unique influencers in our dataset, 177 of them (18%) posted content for Son de Flor in 3 or more separate calendar months. The most consistent partner is @shirinatra, who has collaborated across 12 months with 55 total posts.
Here are 3 examples of Son de Flor's repeat influencer partnerships, with links to the sponsored content.
shirinatra x Son de Flor
![Instagram post by @shirinatra for Son de Flor. Caption reads: [...] Details 🌸 Darcy Dress from @sondeflor....](https://images.od.modash.io/39a920e608d09a8586b4fce66c806c61f3da6777)
![Instagram post by @shirinatra for Son de Flor. Caption reads: [...] styling my Darcy Dress from @sondeflor –....](https://images.od.modash.io/081cf024a60aaf8c5dc3d0cbd8ad4adf217dcf8f)
![Instagram post by @shirinatra for Son de Flor. Caption reads: [...] and the Evelyn Skirt from @sondeflor and the....](https://images.od.modash.io/f21dfe3edc75913a944f56d1a85f46e78374c94e)
badhairgoodshoes x Son de Flor
![Instagram post by @badhairgoodshoes for Son de Flor. Caption reads: @sondeflor is releasing their [...].](https://images.od.modash.io/4953a78d09da4e227ec28f112d336d7cb6a17ca2)
![Instagram post by @badhairgoodshoes for Son de Flor. Caption reads: [...] Enola dress kindly gifted by @sondeflor....](https://images.od.modash.io/756dd765bcd5b5223d2fac014ec1c7c1cc21f5e2)
reivaille x Son de Flor
![Instagram post by @reivaille for Son de Flor. Caption reads: [...] 🫧🧺🌱☀️ — Dress : from @sondeflor! If....](https://images.od.modash.io/8b02a79644f78c12cc65c0d3d1a0e3678c53e308)
![Instagram post by @reivaille for Son de Flor. Caption reads: [...] to you? ☀️ — Dress : from @sondeflor! If....](https://images.od.modash.io/935ced6cda99f6d503b664ffc2a8bfff8776a0b9)
![Instagram post by @reivaille for Son de Flor. Caption reads: [...] 🦆🧤❄️🧵 — Blouse : from @sondeflor! If....](https://images.od.modash.io/11fcf09125761a38396d02b59d1d611ad5d027d7)
💡 Related resource: Long-Term Influencer Partnerships: Pros, Cons & How The Pros Manage Them.
Geographical breakdown
In our dataset, United States is where Son de Flor had the most influencer activity. 40.7% of their live influencer content in the last 12 months was posted by American influencers.
Based on the percentage of influencer content per market, other important markets include:
- United Kingdom (13.9%)
- Brazil (5.3%)
- Italy (4.7%)
Son de Flor's influencer activity by market
Here is another example of Son de Flor collaborating with an influencer in United States.
dilyopa x Son de Flor
Son de Flor's influencer activity vs. related brands
Son de Flor’s romantic, elevated womenswear aesthetic overlaps with Selkie and Damson Madder, all competing for style-niche shoppers driven by storytelling, seasonal edits, and influencer outfit content.
Total influencer content
Son de Flor vs. related brands influencer activity
Total sponsored posts tracked (last 12 months)
Selkie leads with 3.4k sponsored posts, marginally ahead of Son de Flor (3.3k posts) and Damson Madder (2.6k posts). Across all three brands, the average volume is 3.1k posts, indicating mature, scaled influencer programs.
By social platform
Son de Flor vs. related brands influencer activity (by social platform)
Sponsored posts by platform
Son de Flor leads on Instagram and YouTube, while Damson Madder leads on TikTok. The gap is most notable on Instagram, with Son de Flor at 2.9k, Selkie at 2.6k, Damson Madder at 1.4k posts. Son de Flor's activity is particularly concentrated on Instagram. TikTok activity differs substantially, with Damson Madder and Selkie posting several times more than Son de Flor.
By geographical market
Son de Flor vs. related brands influencer activity (by country)
Estimated sponsored posts in Son de Flor's top markets
Selkie leads in United States with 2.2k posts (65.6%), while Damson Madder has the highest estimated sponsored-post volume in United Kingdom (793 posts, 30.9%), France (151 posts, 5.9%), suggesting a Europe focus, while Son de Flor leads in Brazil with 175 posts (5.3%). Looking at United States specifically, the split is Selkie at 2.2k posts (65.6%), Son de Flor at 1.3k posts (40.7%), Damson Madder at 975 posts (38%).
Read more influencer strategy breakdowns
Looking for more like this? Here are 5 similar influencer marketing strategy breakdowns for other brands:
- Selkie's Influencer Marketing Strategy
- Damson Madder's Influencer Marketing Strategy
- Eadem's Influencer Marketing Strategy
- BABYBOO FASHION's Influencer Marketing Strategy
- Minga London's Influencer Marketing Strategy
Or, if you want to access data like this for your own software or processes, take a look at Modash's API products:
Frequently asked questions
Scaling your influencer program?
When you outgrow your mishmash of spreadsheets & free tools, try Modash. Find & email influencers, track campaigns, ship products & more - all in one place.