THE COMMENSE Influencer Marketing Strategy
(2026 Data & Insights)
We analyzed 10.1k pieces of influencer content sponsored by THE COMMENSE over the last 12 months.
This report breaks down where & how THE COMMENSE invests in influencer marketing, which social platforms they prioritize, top geographical markets, and more.
The data in this report comes from Modash's Brand Collaborations API.
P.S. for a simple list of influencers who have collaborated with THE COMMENSE, see here: THE COMMENSE influencers.
Influencer activity throughout the year
THE COMMENSE's influencer campaigns are active year-round with notable month-to-month fluctuation. The chart below shows month-by-month data for total sponsored posts tracked.
THE COMMENSE's influencer activity by month
Number of sponsored posts
THE COMMENSE's influencer output appears relatively consistent throughout the year, averaging about 838 sponsored posts per month. December recorded the highest volume at 1.2k posts (39% above average), while March was the quietest at 545 posts.
Social platforms breakdown
In our dataset (which only includes Instagram, YouTube, and TikTok), this is how the volume of THE COMMENSE's sponsored influencer collaborations break down by social platform:
- Instagram: 8.2k posts (80.9%)
- TikTok: 1.9k posts (18.7%)
- YouTube: 39 posts (0.4%)
THE COMMENSE's influencer activity by platform
Share of sponsored content by social network
Instagram influencer marketing is a clear focus for THE COMMENSE.
Here are 3 examples of THE COMMENSE's recent sponsored collaborations (one each for Instagram, TikTok, YouTube).
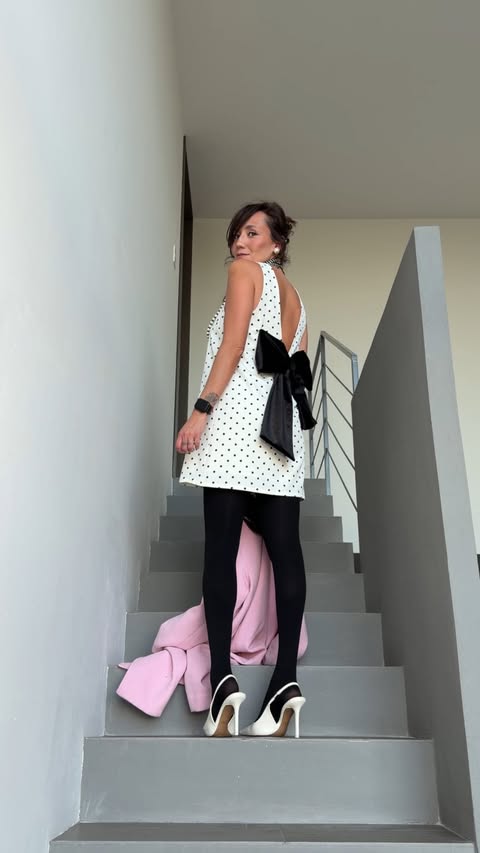
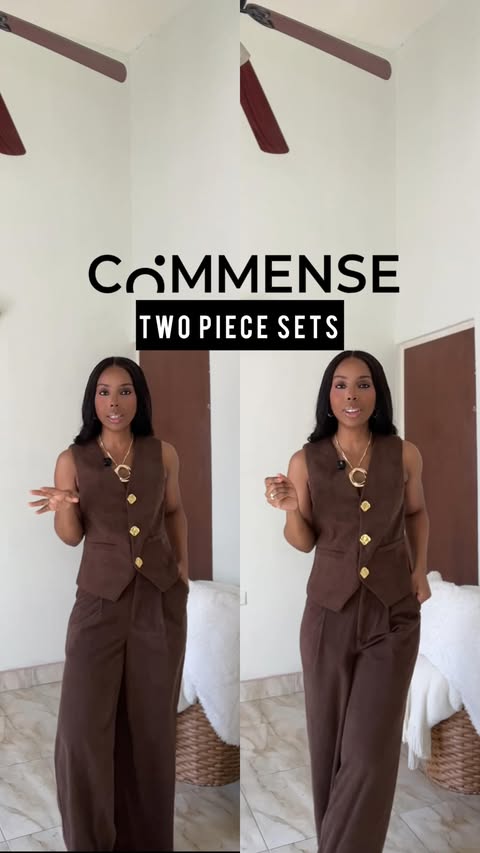
yarininkombini x THE COMMENSE
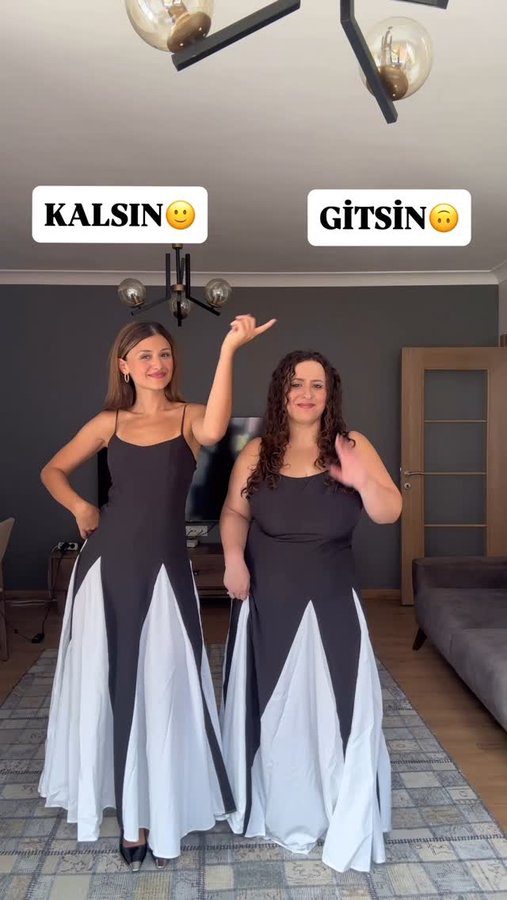
Influencer bio
Helin & Rumeysa Kombin • Styling • Body Positivity 💌 yarininkombini@gmail.com
Collaboration metrics
Get a free trial to find more data on influencer audiences, performance, and collaborations.
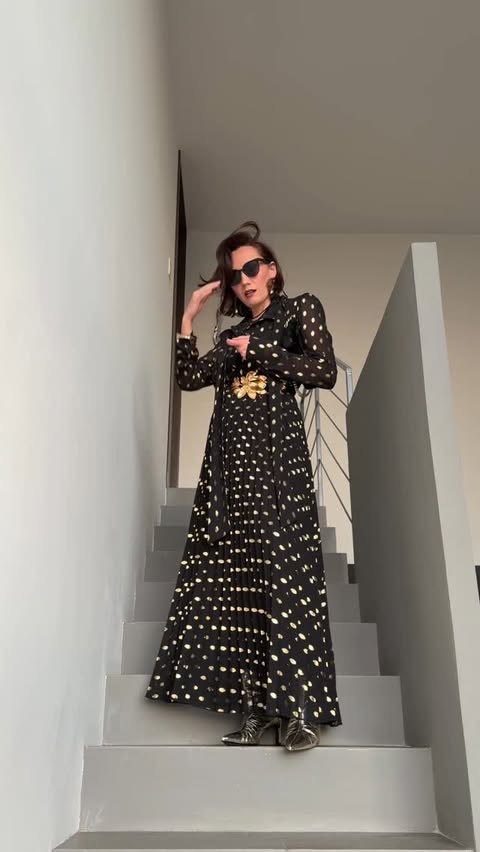
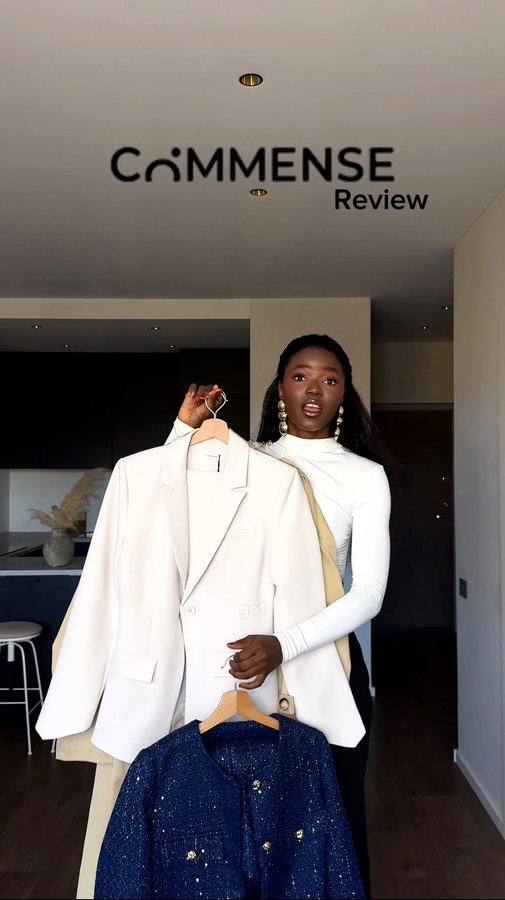
reybanah x THE COMMENSE

Influencer bio
French girl | outfits inspo 🫶🏼 IG :@reybanah Shop my looks ⬇️
Collaboration metrics
Get a free trial to find more data on influencer audiences, performance, and collaborations.
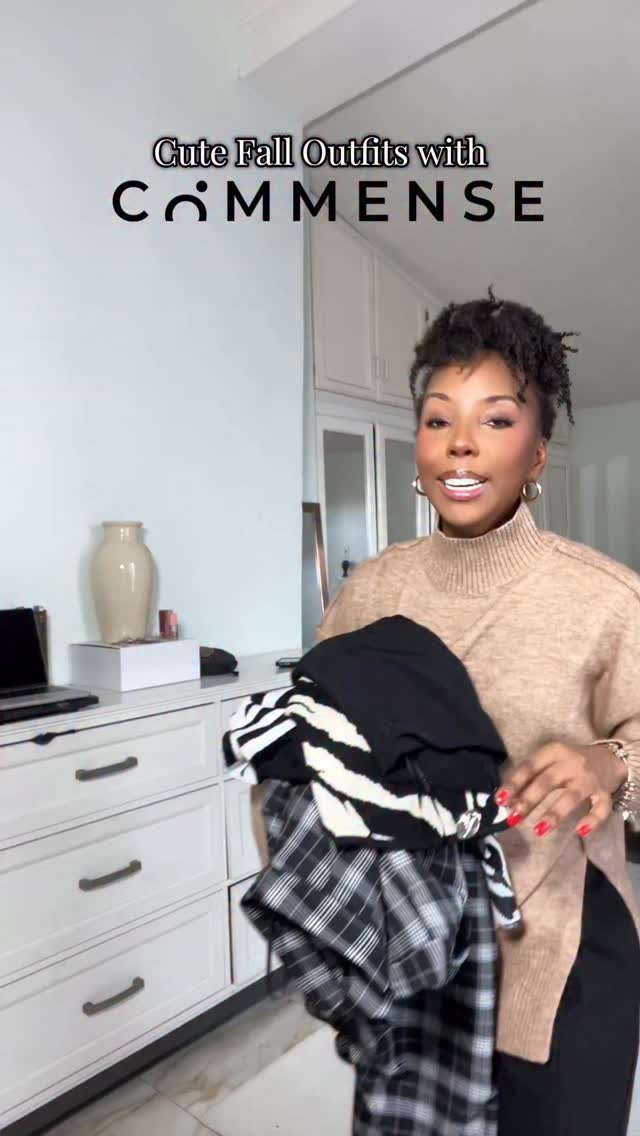
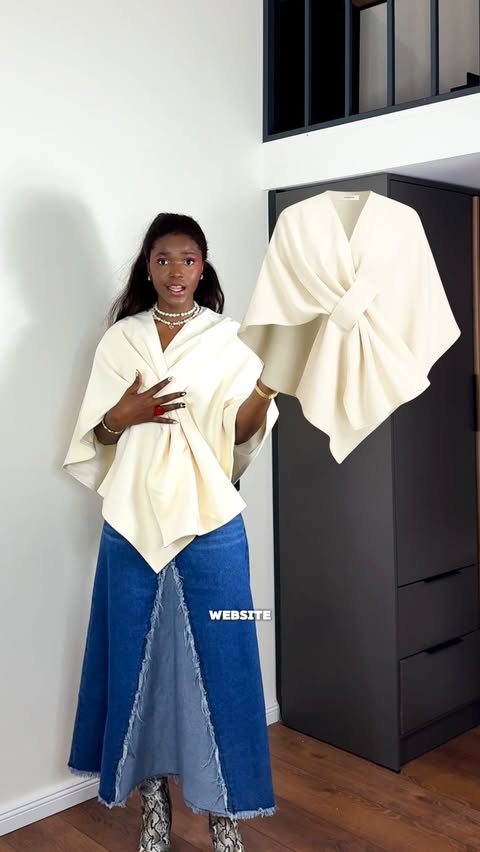
hellipatell x THE COMMENSE
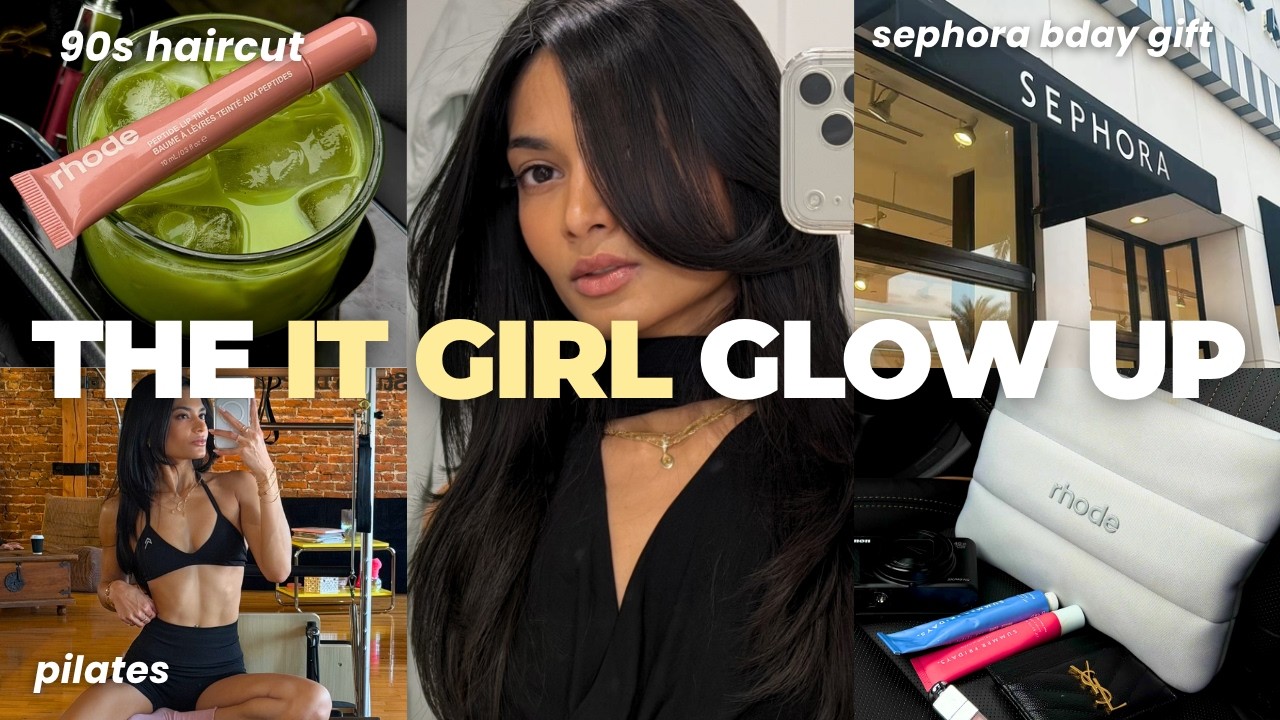
Influencer bio
sharing bits of my life ✨ part time content creator + full time marketing coordinator 🤍
Collaboration metrics
Get a free trial to find more data on influencer audiences, performance, and collaborations.
If you break this down further by content type on Instagram, this is what it looks like:
- Reels: 76.4%
- Posts: 23.6%
💡 Related resource: How To Find Instagram Influencers.
Influencer audience size breakdown (by views)
For their top social platform (Instagram), here is a breakdown of the type of influencers THE COMMENSE are collaborating with, by audience size.
Note: this breakdown is based on each influencer's average views (not follower/subscriber count), because views typically correlate more closely with influencer pricing and impact.
THE COMMENSE's influencers average views (Instagram)
Based on each influencer's average views per post
With 33.3% of partnerships featuring creators averaging 1K-5K views, THE COMMENSE's strategy suggests niche targeting and authenticity, likely leveraging collaboration models like gifting and affiliates to work with smaller creators. The 10K-50K views segment is also prominent at 27.3%, indicating investment across adjacent tiers.
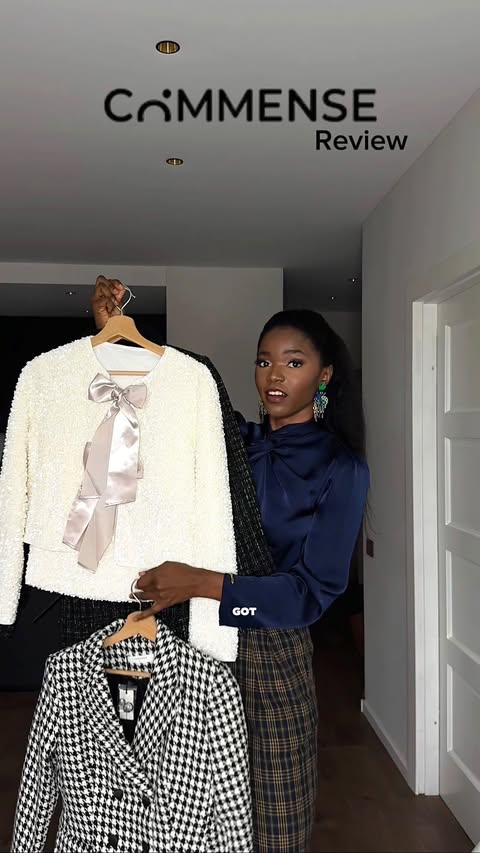
Here is an example of a sponsored collaboration with a larger-audience creator on Instagram (2.4M avg views/post):
ivypang.styled x THE COMMENSE
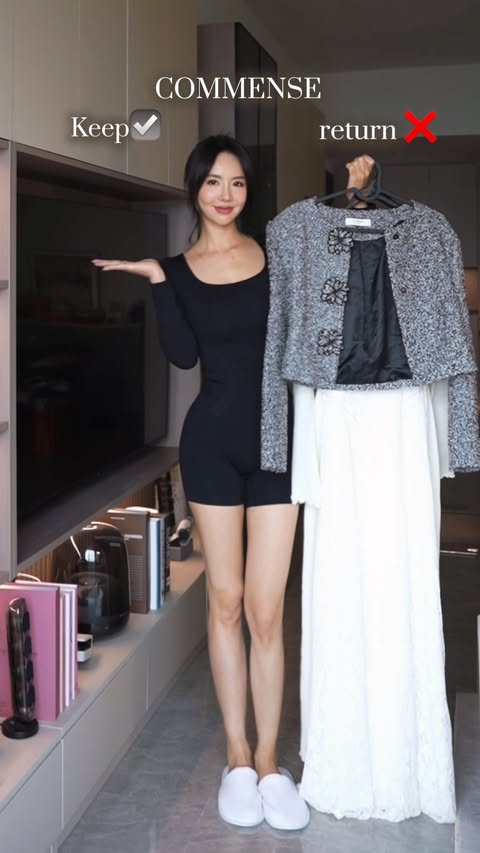
Influencer bio
Macao &Hong Kong ✨Fashion, Travel & Lifestyle content creator🎀 Collaboration/Event/PFW: ivypanglife@gmail.com
Collaboration metrics
Get a free trial to find more data on influencer audiences, performance, and collaborations.
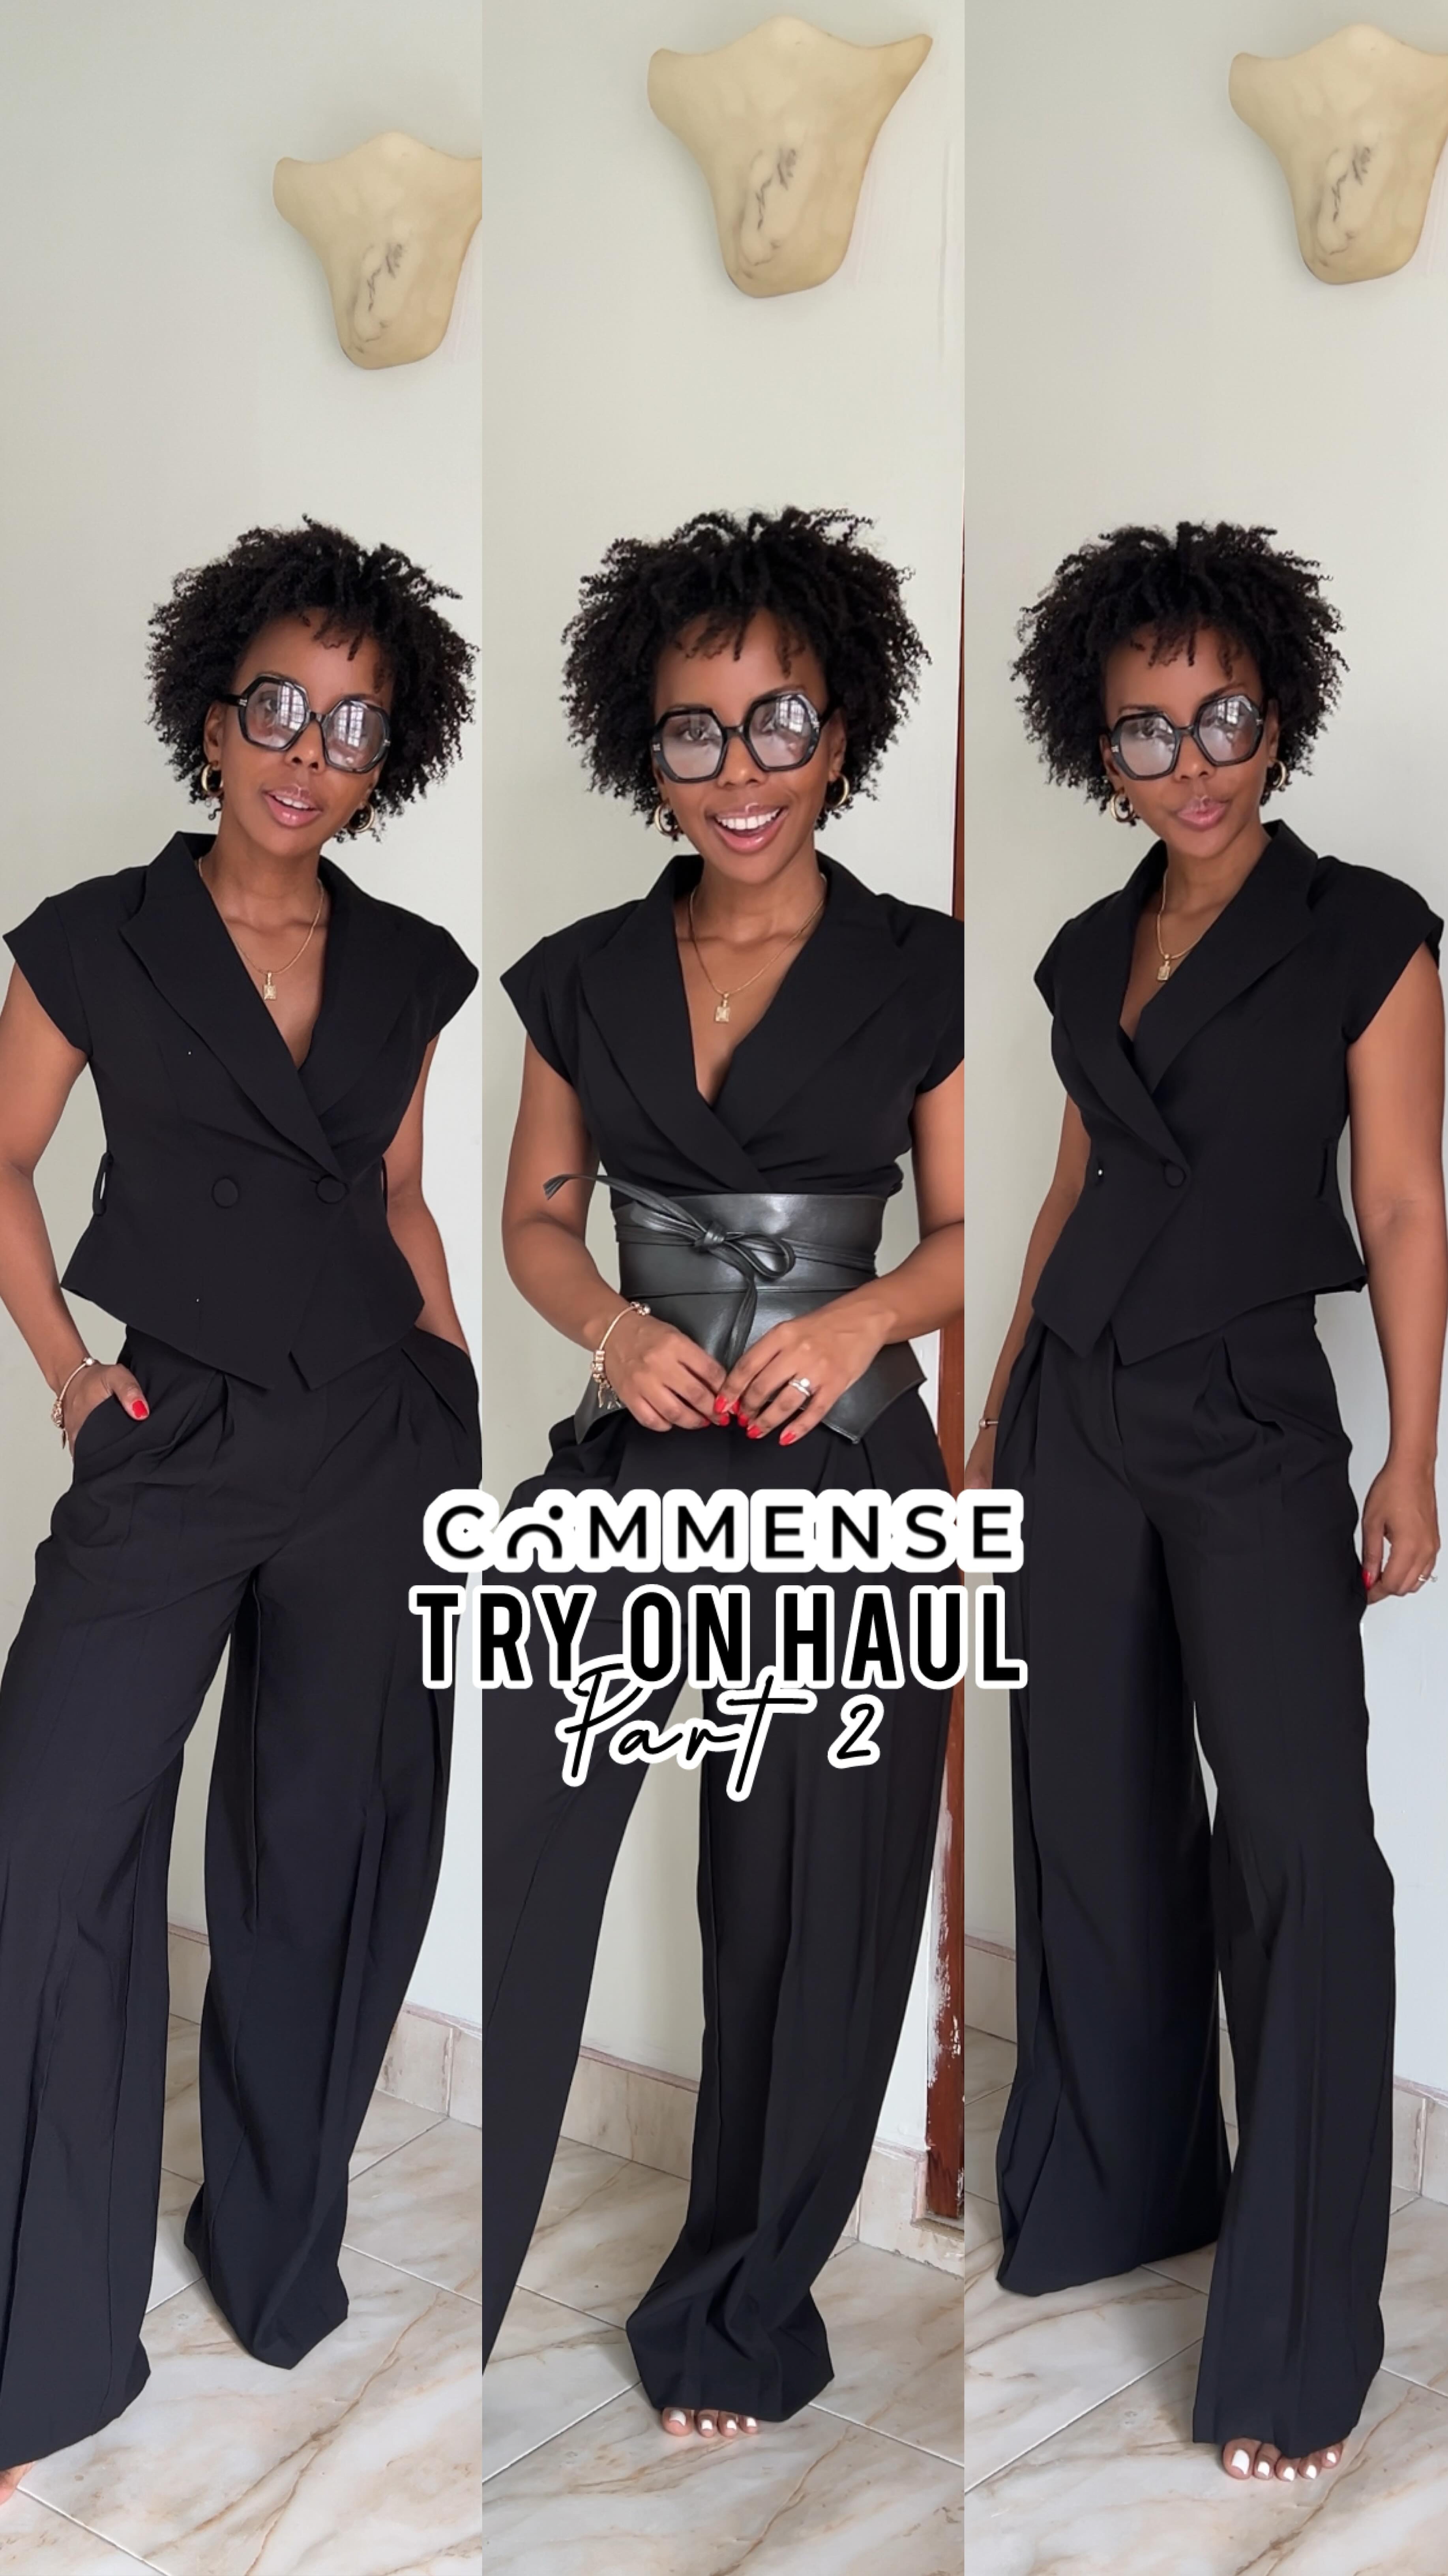
And here is another example with a smaller creator on Instagram (10.0k avg views/post):
abbi.white_ x THE COMMENSE
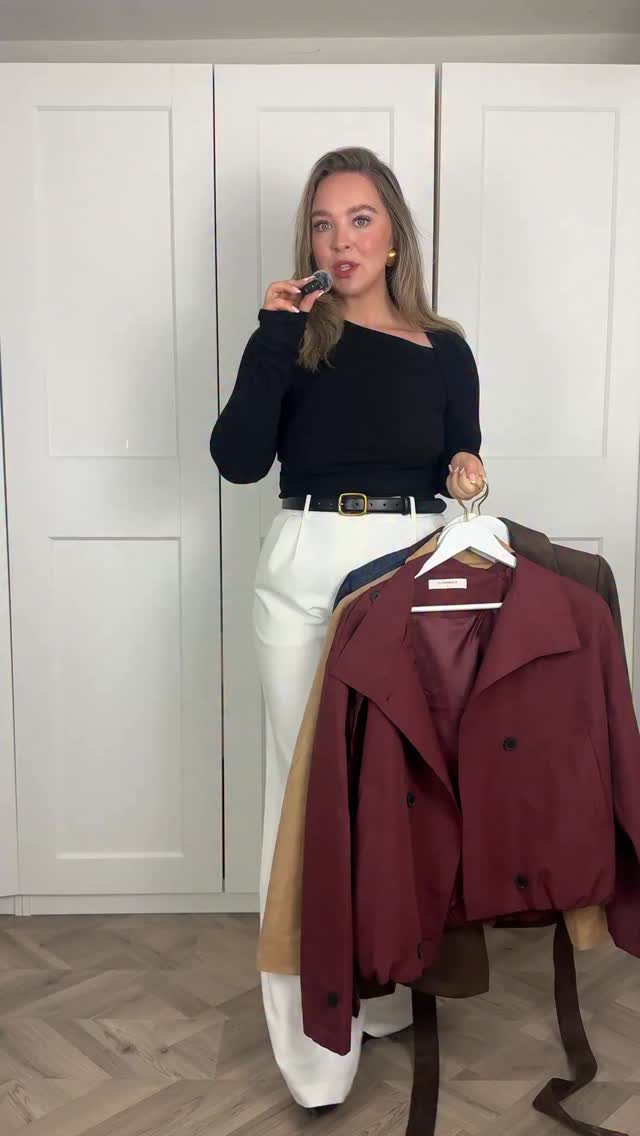
Influencer bio
midsize outfit and style inspiration contact ellisha@es-collective.com Liverpool, UK
Collaboration metrics
Get a free trial to find more data on influencer audiences, performance, and collaborations.
THE COMMENSE's repeat partnerships
Out of 3.7k unique influencers in our dataset, 439 of them (12%) posted content for THE COMMENSE in 3 or more separate calendar months. The most consistent partner is @mai_cqp, who has collaborated across 13 months with 89 total posts.
Here are 3 examples of THE COMMENSE's repeat influencer partnerships, with links to the sponsored content.
mai_cqp x THE COMMENSE

dsjcox x THE COMMENSE
tolanienwereji x THE COMMENSE
💡 Related resource: Long-Term Influencer Partnerships: Pros, Cons & How The Pros Manage Them.
Geographical breakdown
In our dataset, United States is where THE COMMENSE had the most influencer activity. 39.8% of their live influencer content in the last 12 months was posted by American influencers.
Based on the percentage of influencer content per market, other important markets include:
- United Kingdom (7.4%)
- Canada (5.3%)
- India (4.6%)
THE COMMENSE's influencer activity by market
Here is another example of THE COMMENSE collaborating with an influencer in United States.
imhrisa x THE COMMENSE
THE COMMENSE's influencer activity vs. related brands
Rihoas and ChicMe compete closely with THE COMMENSE as affordable, trend-driven women’s fashion e-commerce brands with a similar fast-fashion/online-boutique positioning. Both target a comparable audience looking for stylish outfits at accessible price points.
Total influencer content
THE COMMENSE vs. related brands influencer activity
Total sponsored posts tracked (last 12 months)
ChicMe leads with 10.3k sponsored posts, marginally ahead of THE COMMENSE (10.1k posts) and Rihoas (8.5k posts). Across all three brands, the average volume is 9.7k posts, indicating mature, scaled influencer programs. The relatively balanced activity suggests comparable influencer marketing investment across the category.
By social platform
THE COMMENSE vs. related brands influencer activity (by social platform)
Sponsored posts by platform
THE COMMENSE leads on Instagram, while ChicMe has the most activity on TikTok and Rihoas has the most activity on YouTube. The gap is most notable on TikTok, with ChicMe at 10.3k, THE COMMENSE at 1.9k, Rihoas at 1.7k posts. THE COMMENSE's activity is particularly concentrated on Instagram. ChicMe’s posts are all on TikTok, while THE COMMENSE and Rihoas post mainly on Instagram with smaller activity on TikTok and YouTube.
By geographical market
THE COMMENSE vs. related brands influencer activity (by country)
Estimated sponsored posts in THE COMMENSE's top markets
ChicMe has the highest estimated sponsored-post volume in Portugal (5.1k posts, 49.4%), Spain (2.9k posts, 27.7%), suggesting a Europe focus, while THE COMMENSE has the highest estimated sponsored-post volume in United States (4k posts, 39.8%), United Kingdom (748 posts, 7.4%), Canada (536 posts, 5.3%), suggesting a North America focus, while Rihoas leads in India with 537 posts (6.3%). THE COMMENSE's strength in United States and United Kingdom may indicate a home-market focus, while ChicMe shows broader regional investment.
Read more influencer strategy breakdowns
Looking for more like this? Here are 5 similar influencer marketing strategy breakdowns for other brands:
- Rihoas's Influencer Marketing Strategy
- ChicMe's Influencer Marketing Strategy
- Show Me Your Mumu's Influencer Marketing Strategy
- Color Wow Hair's Influencer Marketing Strategy
- Sol de Janeiro's Influencer Marketing Strategy
Or, if you want to access data like this for your own software or processes, take a look at Modash's API products:
Frequently asked questions
Scaling your influencer program?
When you outgrow your mishmash of spreadsheets & free tools, try Modash. Find & email influencers, track campaigns, ship products & more - all in one place.