Treehut Influencer Marketing Strategy
(2026 Data & Insights)
We analyzed 3.1k pieces of influencer content sponsored by Treehut over the last 12 months.
This report breaks down where & how Treehut invests in influencer marketing, which social platforms they prioritize, top geographical markets, and more.
The data in this report comes from Modash's Brand Collaborations API.
P.S. for a simple list of influencers who have collaborated with Treehut, see here: Treehut influencers.
Influencer activity throughout the year
Treehut's influencer campaigns are active year-round with notable month-to-month fluctuation. The chart below shows month-by-month data for total sponsored posts tracked.
Treehut's influencer activity by month
Number of sponsored posts
Treehut's sponsored post volume appears to trend upward over the 12-month period, rising from 261 posts in January to 356 in December. The peak month, December, reached 356 posts, 39% higher than the monthly average of 257.
Social platforms breakdown
In our dataset (which only includes Instagram, YouTube, and TikTok), this is how the volume of Treehut's sponsored influencer collaborations break down by social platform:
- Instagram: 1.8k posts (56.9%)
- TikTok: 1.3k posts (42.8%)
- YouTube: 11 posts (0.4%)
Treehut's influencer activity by platform
Share of sponsored content by social network
Instagram influencer marketing is a clear focus for Treehut.
Here are 3 examples of Treehut's recent sponsored collaborations (one each for Instagram, TikTok, YouTube).
adridiaries_ x Treehut
![Instagram post by @adridiaries_ for Treehut. Caption reads: [...] step feel like a glow up! 🥂🧖🏻♀️....](https://images.od.modash.io/a70963bfb081ada19e081117b86be23437b8f24e)
Influencer bio
your cozy internet bestie 🪽 ♡ 700k on tiktok: adridiaries 💌 adridiaries@dulcedo.com
Collaboration metrics
Get a free trial to find more data on influencer audiences, performance, and collaborations.
samaraispinkk x Treehut
Influencer bio
I am pink diva mermaid queen and Samara 💌- Samara@tiddle.io Snap is lit
Collaboration metrics
Get a free trial to find more data on influencer audiences, performance, and collaborations.
MyAffordableWatchCollection x Treehut
![YouTube post by @MyAffordableWatchCollection for Treehut. Caption reads: [...] Watch Club: Get 5% off using code:MAWC5....](https://images.od.modash.io/9007a3e6ba4358ed27e26baaeff260a451ab7c90)
Influencer bio
On this channel I share and review microbrands and budget friendly watches and give you some tips and tricks for taking care of your watches by yourselves. My name is Aviv, Welcome to My Affordable Watch Collection! I hope you'll enjoy my videos and find them helpful! If you do, I would really appreciate your THUMBS UP and you hitting SUBSCRIBE! And if you click on the little BELL you'll get notified every time I post a new video, so make sure you click it! Also, Follow me on INSTAGRAM : https://www.instagram.com/myaffordablewatchcollection/ And get to know me and my collection better, see which watch I'm wearing every day! Email me for any inquiry: myaffordablewatchcollection@gmail.com
Collaboration metrics
Get a free trial to find more data on influencer audiences, performance, and collaborations.
If you break this down further by content type on Instagram, this is what it looks like:
- Reels: 78.3%
- Posts: 21.7%
💡 Related resource: How To Find Instagram Influencers.
Influencer audience size breakdown (by views)
For their top social platform (Instagram), here is a breakdown of the type of influencers Treehut are collaborating with, by audience size.
Note: this breakdown is based on each influencer's average views (not follower/subscriber count), because views typically correlate more closely with influencer pricing and impact.
Treehut's influencers average views (Instagram)
Based on each influencer's average views per post
Treehut's creator selection appears relatively diversified across size tiers, with no single segment dominating. This suggests a balanced approach to influencer partnerships, spreading investment across different audience sizes.
Here is an example of a sponsored collaboration with a larger-audience creator on Instagram (1.4M avg views/post):
youglowgrrl x Treehut
![Instagram post by @youglowgrrl for Treehut. Caption reads: [...] Scrub @thebodyshop Exfoliating Gloves....](https://images.od.modash.io/8447045b6ab3fee5d2e0d1ea50f63a64351e97fd)
Influencer bio
The ‘sounds’ girlie & your friendly neighbourhood beauty bestie 🤪 ☁️ 28 | London, UK 🇬🇧 ✉️ annie@lvesocial.com Discount codes ⬇️
Collaboration metrics
Get a free trial to find more data on influencer audiences, performance, and collaborations.
And here is another example with a smaller creator on Instagram (9.5k avg views/post):
xaneverlett x Treehut
Influencer bio
여기 온 여러분 = ♥️+🍀 만땅 받아요 ~.~ 🏷️ xaneverlett@gmail.com
Collaboration metrics
Get a free trial to find more data on influencer audiences, performance, and collaborations.
Treehut's repeat partnerships
Out of 1.9k unique influencers in our dataset, 114 of them (6%) posted content for Treehut in 3 or more separate calendar months. The most consistent partner is @xotatianarose, who has collaborated across 11 months with 26 total posts.
Here are 3 examples of Treehut's repeat influencer partnerships, with links to the sponsored content.
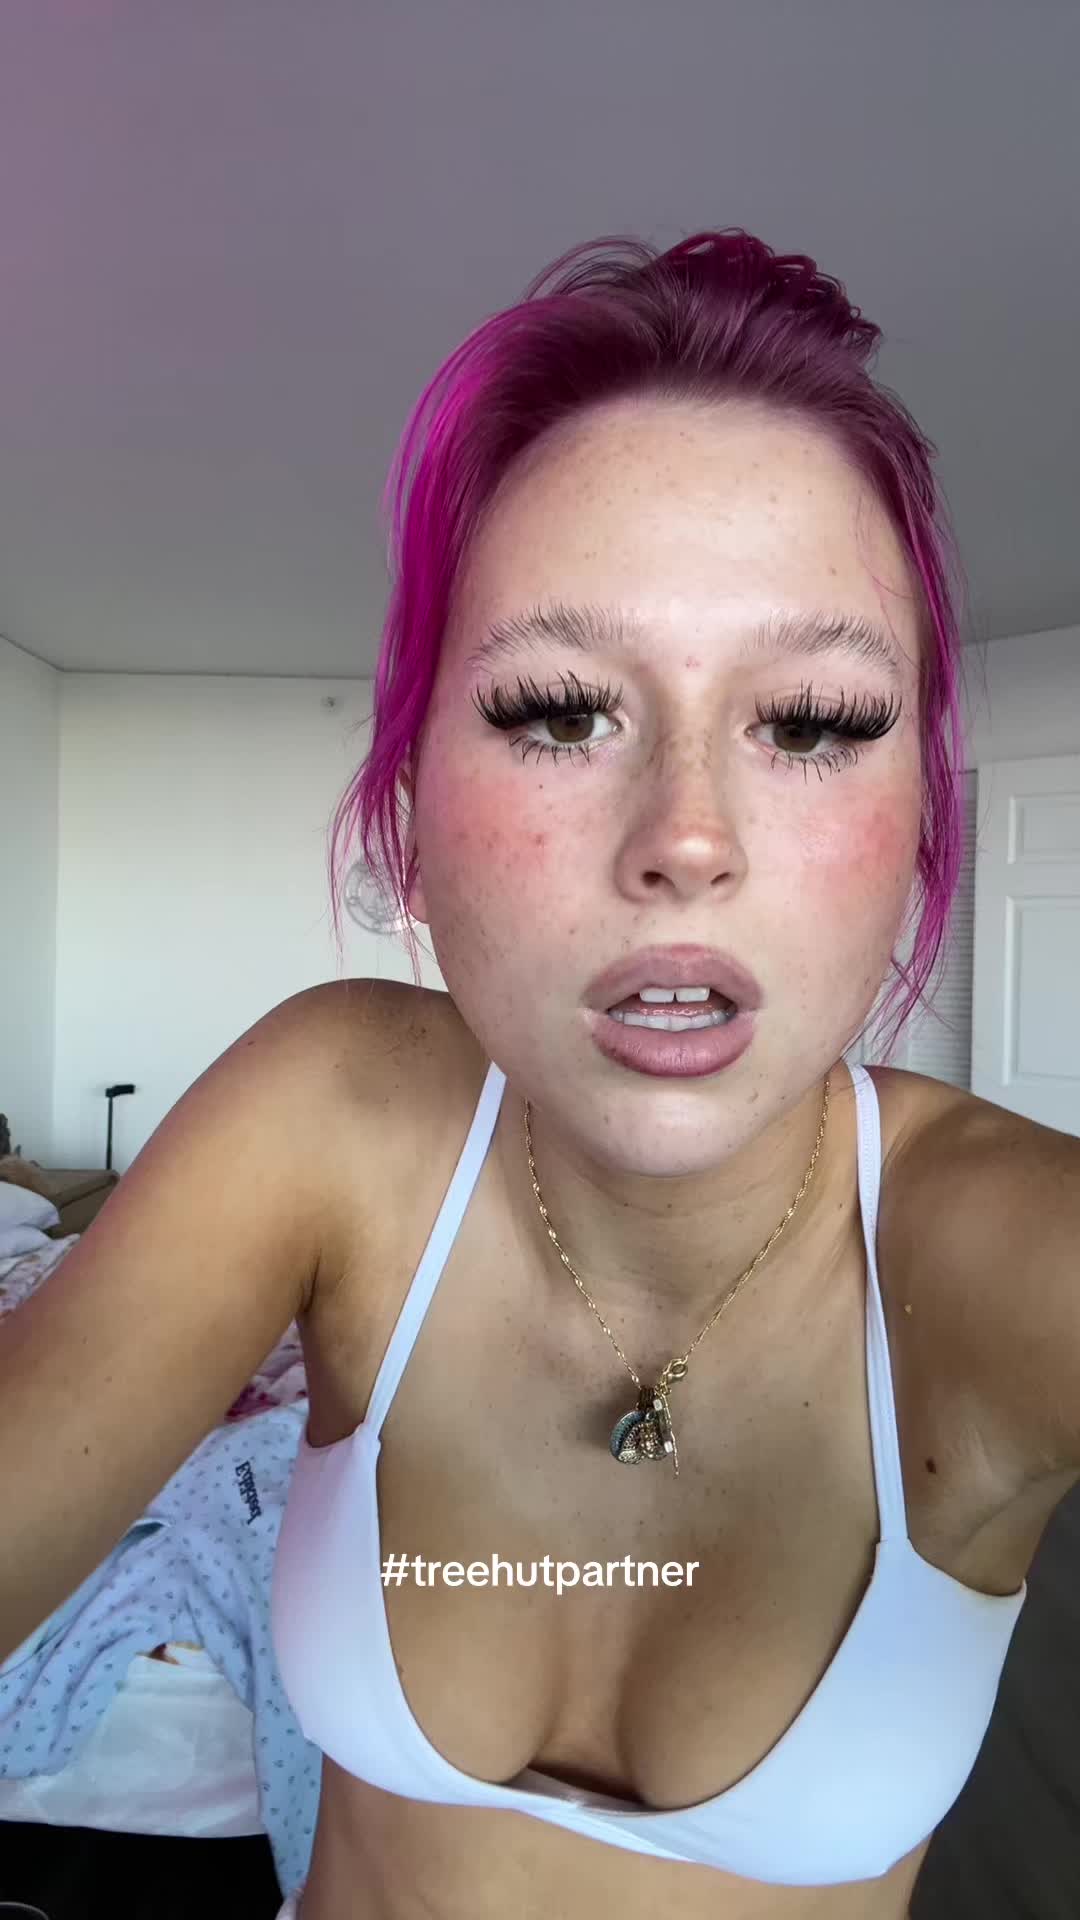
xotatianarose x Treehut
![TikTok post by @xotatianarose for Treehut. Caption reads: #treehutpartner @Tree Hut had a glow up [...].](https://images.od.modash.io/901cc4b9c7c9b40886505ec2e015362db4d6e818)
![TikTok post by @xotatianarose for Treehut. Caption reads: #treehutpartner Cozy up into fall with [...].](https://images.od.modash.io/5731a561c1d9ccc63a90d839e3e8ebca337d7404)
![TikTok post by @xotatianarose for Treehut. Caption reads: [...] the new @Tree Hut serums😍🩷 #treehut....](https://images.od.modash.io/09f0faf6c51edf7eb60231e1b45f4736437eaefb)
xotatianarose x Treehut
![Instagram post by @xotatianarose for Treehut. Caption reads: #treehutpartner @treehut had a glow up [...].](https://images.od.modash.io/e1719820f3954f305542d0164f0af13a646cd8a6)
![Instagram post by @xotatianarose for Treehut. Caption reads: #treehutpartner Cozy up into fall with [...].](https://images.od.modash.io/125fab93f0d92f67032f210a9592a140d9a9c205)
lanie.kristin x Treehut
![Instagram post by @lanie.kristin for Treehut. Caption reads: [...] 2. Follow @lanie.kristin & @treehut ✔️ 3.....](https://images.od.modash.io/8353fbf8fdc99b30e5d1944caed495b5d6d1a1a5)
![Instagram post by @lanie.kristin for Treehut. Caption reads: [...] dream come true 🥹🏈🛁🌈💕 @treehut i’m so....](https://images.od.modash.io/d3bc17836a9681c0ad289c9a0acc1d64487a2b4e)
![Instagram post by @lanie.kristin for Treehut. Caption reads: [...] an understatement. i love you @treehut thank....](https://images.od.modash.io/c42d8a21905490d18adefd886fcc3713f417cf6e)
💡 Related resource: Long-Term Influencer Partnerships: Pros, Cons & How The Pros Manage Them.
Geographical breakdown
In our dataset, United States is where Treehut had the most influencer activity. 70.3% of their live influencer content in the last 12 months was posted by American influencers.
Based on the percentage of influencer content per market, other important markets include:
- United Kingdom (4%)
- Canada (3.9%)
- Brazil (3.5%)
Treehut's influencer activity by market
Here is another example of Treehut collaborating with an influencer in United States.
julianna_claire x Treehut

Treehut's influencer activity vs. related brands
Treehut competes in body care and scent-driven self-care rituals, similar to Sol de Janeiro and Kopari Beauty. These brands share overlapping audiences for scrubs, lotions, and shower routines that perform well in influencer “everything shower” content.
Total influencer content
Treehut vs. related brands influencer activity
Total sponsored posts tracked (last 12 months)
Sol de Janeiro leads with 11.7k sponsored posts, significantly outpacing Kopari Beauty (5.8k posts) and Treehut (3.1k posts). Across all three brands, the average volume is 6.9k posts, indicating mature, scaled influencer programs. Sol de Janeiro has far more total posts than Treehut and Kopari Beauty.
By social platform
Treehut vs. related brands influencer activity (by social platform)
Sponsored posts by platform
Among these brands, Sol de Janeiro leads on Instagram, TikTok, and YouTube. The gap is most notable on Instagram, with Sol de Janeiro at 4.9k, Treehut at 1.8k, Kopari Beauty at 1k posts. Kopari Beauty's activity is particularly concentrated on TikTok. On Instagram, Treehut posts far more than Kopari Beauty, and on TikTok, Sol de Janeiro posts far more than Treehut.
By geographical market
Treehut vs. related brands influencer activity (by country)
Estimated sponsored posts in Treehut's top markets
Sol de Janeiro has the highest estimated sponsored-post volume in United States (4.7k posts, 40.3%), India (938 posts, 8%), United Kingdom (867 posts, 7.4%), while Kopari Beauty leads in Brazil with 199 posts (3.4%), while Treehut leads in Canada with 120 posts (3.9%). Looking at United States specifically, the split is Sol de Janeiro at 4.7k posts (40.3%), Kopari Beauty at 4.2k posts (72%), Treehut at 2.2k posts (70.3%).
Read more influencer strategy breakdowns
Looking for more like this? Here are 5 similar influencer marketing strategy breakdowns for other brands:
- Sol de Janeiro's Influencer Marketing Strategy
- Kopari Beauty's Influencer Marketing Strategy
- VBeautyPure's Influencer Marketing Strategy
- OSEA Malibu's Influencer Marketing Strategy
- NEEWER's Influencer Marketing Strategy
Or, if you want to access data like this for your own software or processes, take a look at Modash's API products:
Frequently asked questions
Scaling your influencer program?
When you outgrow your mishmash of spreadsheets & free tools, try Modash. Find & email influencers, track campaigns, ship products & more - all in one place.