Wiskii Active Influencer Marketing Strategy
(2026 Data & Insights)
We analyzed 3.8k pieces of influencer content sponsored by Wiskii Active over the last 12 months.
This report breaks down where & how Wiskii Active invests in influencer marketing, which social platforms they prioritize, top geographical markets, and more.
The data in this report comes from Modash's Brand Collaborations API.
P.S. for a simple list of influencers who have collaborated with Wiskii Active, see here: Wiskii Active influencers.
Influencer activity throughout the year
Wiskii Active's influencer campaigns are active year-round with notable month-to-month fluctuation. The chart below shows month-by-month data for total sponsored posts tracked.
Wiskii Active's influencer activity by month
Number of sponsored posts
Wiskii Active's influencer output appears relatively consistent throughout the year, averaging about 318 sponsored posts per month. July recorded the highest volume at 431 posts (36% above average), while June was the quietest at 141 posts.
Social platforms breakdown
In our dataset (which only includes Instagram, YouTube, and TikTok), this is how the volume of Wiskii Active's sponsored influencer collaborations break down by social platform:
- Instagram: 3.7k posts (95.8%)
- TikTok: 140 posts (3.7%)
- YouTube: 20 posts (0.5%)
Wiskii Active's influencer activity by platform
Share of sponsored content by social network
Instagram influencer marketing is a clear focus for Wiskii Active.
Here are 3 examples of Wiskii Active's recent sponsored collaborations (one each for Instagram, TikTok, YouTube).
abigailspenserhu x Wiskii Active
![Instagram post by @abigailspenserhu for Wiskii Active. Caption reads: @wiskiiactive Looks the best, Feel the best. [...].](https://images.od.modash.io/8503045450b79a10216927d2f7ce2be97d23f45e)
Influencer bio
胡馨婉 Founder @lumefranceofficial Empower Wellness 🍃 “Inward”🎵 YouTube 730M 👁️ NYC/London Max@newworldinvestsgroup.com
Collaboration metrics
Get a free trial to find more data on influencer audiences, performance, and collaborations.
ssanyanovakovic x Wiskii Active

Influencer bio
💗💗 💌sanyanovakovic@thesociablesociety.com
Collaboration metrics
Get a free trial to find more data on influencer audiences, performance, and collaborations.
KathrynMueller x Wiskii Active
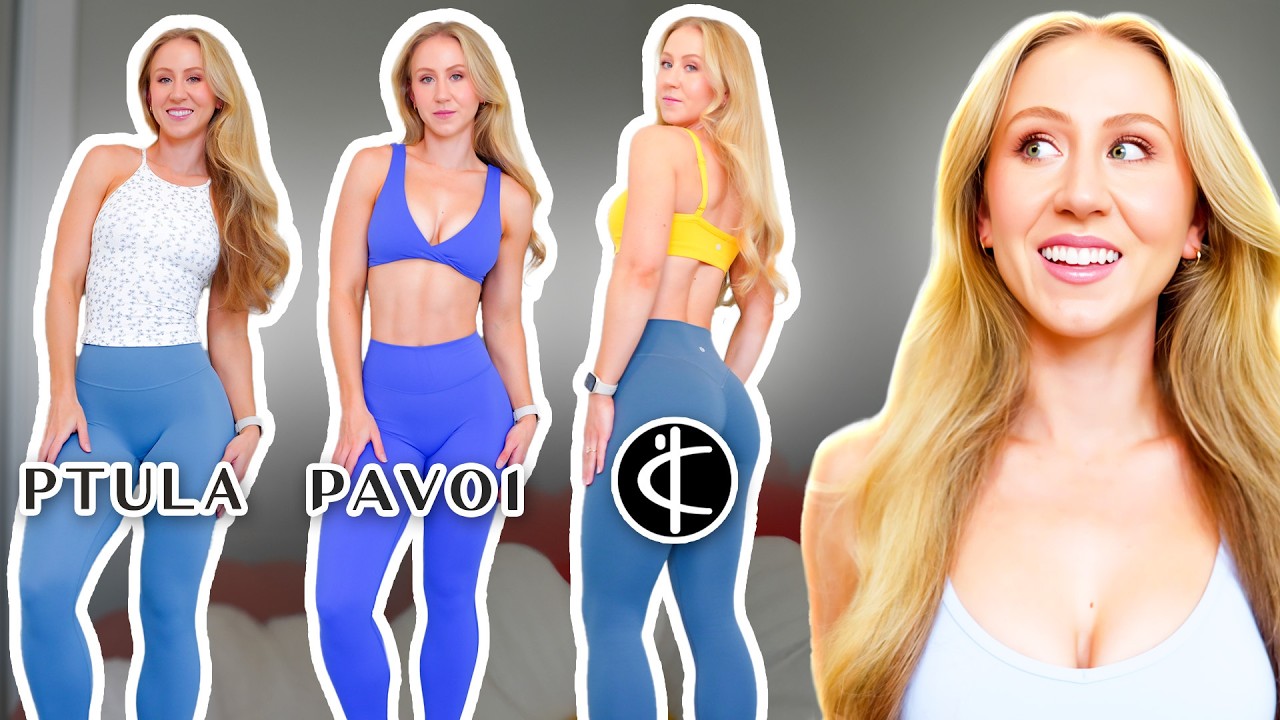
Influencer bio
My name is Kathryn Mueller, and I’m a 28-year-old dentist who loves all things fitness, fashion, and lifestyle! I believe in always giving my 100% honest opinion to you guys at all times, so you can always trust that what I say is what I actually believe! I am a huge saver, so I’m always trying to make videos to save you all as much money as possible while still looking cute! On my channel, you’ll find activewear reviews, fitness-related content, and occasional vlogs and science-related videos!
Collaboration metrics
Get a free trial to find more data on influencer audiences, performance, and collaborations.
If you break this down further by content type on Instagram, this is what it looks like:
- Posts: 54%
- Reels: 46%
💡 Related resource: How To Find Instagram Influencers.
Influencer audience size breakdown (by views)
For their top social platform (Instagram), here is a breakdown of the type of influencers Wiskii Active are collaborating with, by audience size.
Note: this breakdown is based on each influencer's average views (not follower/subscriber count), because views typically correlate more closely with influencer pricing and impact.
Wiskii Active's influencers average views (Instagram)
Based on each influencer's average views per post
Wiskii Active's creator selection appears relatively diversified across size tiers, with no single segment dominating. This suggests a balanced approach to influencer partnerships, spreading investment across different audience sizes.
Here is an example of a sponsored collaboration with a larger-audience creator on Instagram (142.4k avg views/post):
lovely_amusan x Wiskii Active
Influencer bio
Fashion,beauty,travel Model:Represented by @e1universe 🇩🇪 Collab:lovely@mynameislovely.com TikTok 39k Currently London🇬🇧Dubai🇦🇪 Shopmylooks ⬇️
Collaboration metrics
Get a free trial to find more data on influencer audiences, performance, and collaborations.
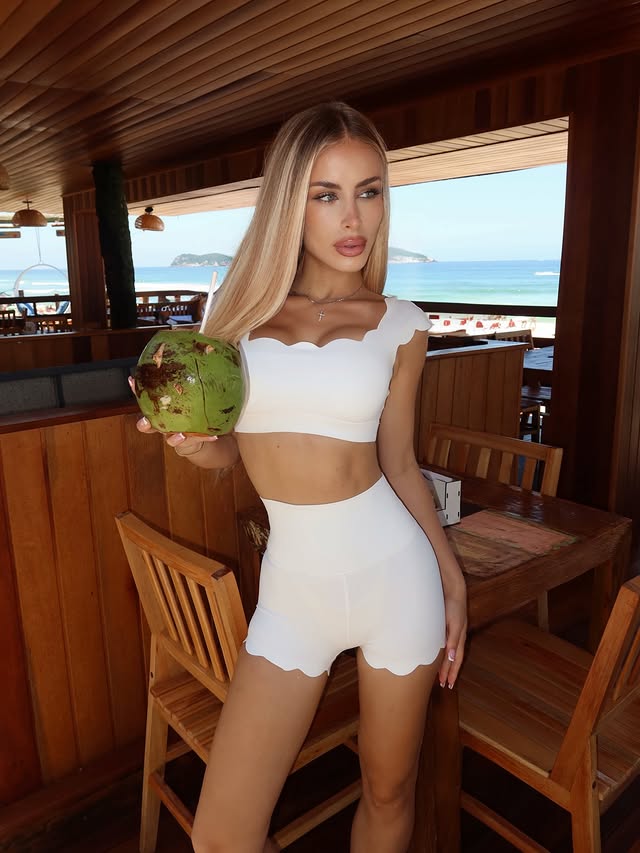
And here is another example with a smaller creator on Instagram (9.9k avg views/post):
paveekwun x Wiskii Active
![Instagram post by @paveekwun for Wiskii Active. Caption reads: [...] privates & collabs in NYC. wearing....](https://images.od.modash.io/81ea5dcdbeb5663532ec59d04daadf4cc8a4d5ca)
Influencer bio
❤️🔥full time barre pilates fitness instructor ✨teaching in nyc•youtube pilates• beauty•lifestyle•vlogs 🦋@437 partner 💌paveekwun18@gmail.com
Collaboration metrics
Get a free trial to find more data on influencer audiences, performance, and collaborations.
Wiskii Active's repeat partnerships
Out of 2.1k unique influencers in our dataset, 46 of them (2%) posted content for Wiskii Active in 3 or more separate calendar months. The most consistent partner is @michaelahomolova_fitness, who has collaborated across 12 months with 43 total posts.
Here are 3 examples of Wiskii Active's repeat influencer partnerships, with links to the sponsored content.
yujin_choi_pilates x Wiskii Active
![Instagram post by @yujin_choi_pilates for Wiskii Active. Caption reads: [...] for the beautiful pink set @wiskiiactive....](https://images.od.modash.io/bf26acf1a26e12a479a382b7d4ce2eade5c6deb1)
![Instagram post by @yujin_choi_pilates for Wiskii Active. Caption reads: [...] really helped! Wearing @wiskiiactive....](https://images.od.modash.io/4834cdd64b90a245dca238dbdb57015547e8e4cc)
![Instagram post by @yujin_choi_pilates for Wiskii Active. Caption reads: [...] anywhere. Wearing @wiskiiactive Always use....](https://images.od.modash.io/f3e59638aaf0dc404216186883c7068745546015)
matchaalina x Wiskii Active

![Instagram post by @matchaalina for Wiskii Active. Caption reads: [...] #fyp #wiskii #relateable #wiskiiactive....](https://images.od.modash.io/5e8c0dc68d90652122e6f7dd8acc298dce1d7850)

nicolesimeonex x Wiskii Active
![Instagram post by @nicolesimeonex for Wiskii Active. Caption reads: outfit : @wiskiiactive photographer: [...].](https://images.od.modash.io/74d91bc40ec059a88bc0cbba6acddf851da3f9a9)
![Instagram post by @nicolesimeonex for Wiskii Active. Caption reads: @wiskiiactive 🤍 use code Serena for % [...].](https://images.od.modash.io/7ff7d3a32661678d631dbf8877abf5a1630f3394)
💡 Related resource: Long-Term Influencer Partnerships: Pros, Cons & How The Pros Manage Them.
Geographical breakdown
In our dataset, United States is where Wiskii Active had the most influencer activity. 29.3% of their live influencer content in the last 12 months was posted by American influencers.
Based on the percentage of influencer content per market, other important markets include:
- United Kingdom (4.8%)
- Brazil (4.7%)
- Russia (4.7%)
Wiskii Active's influencer activity by market
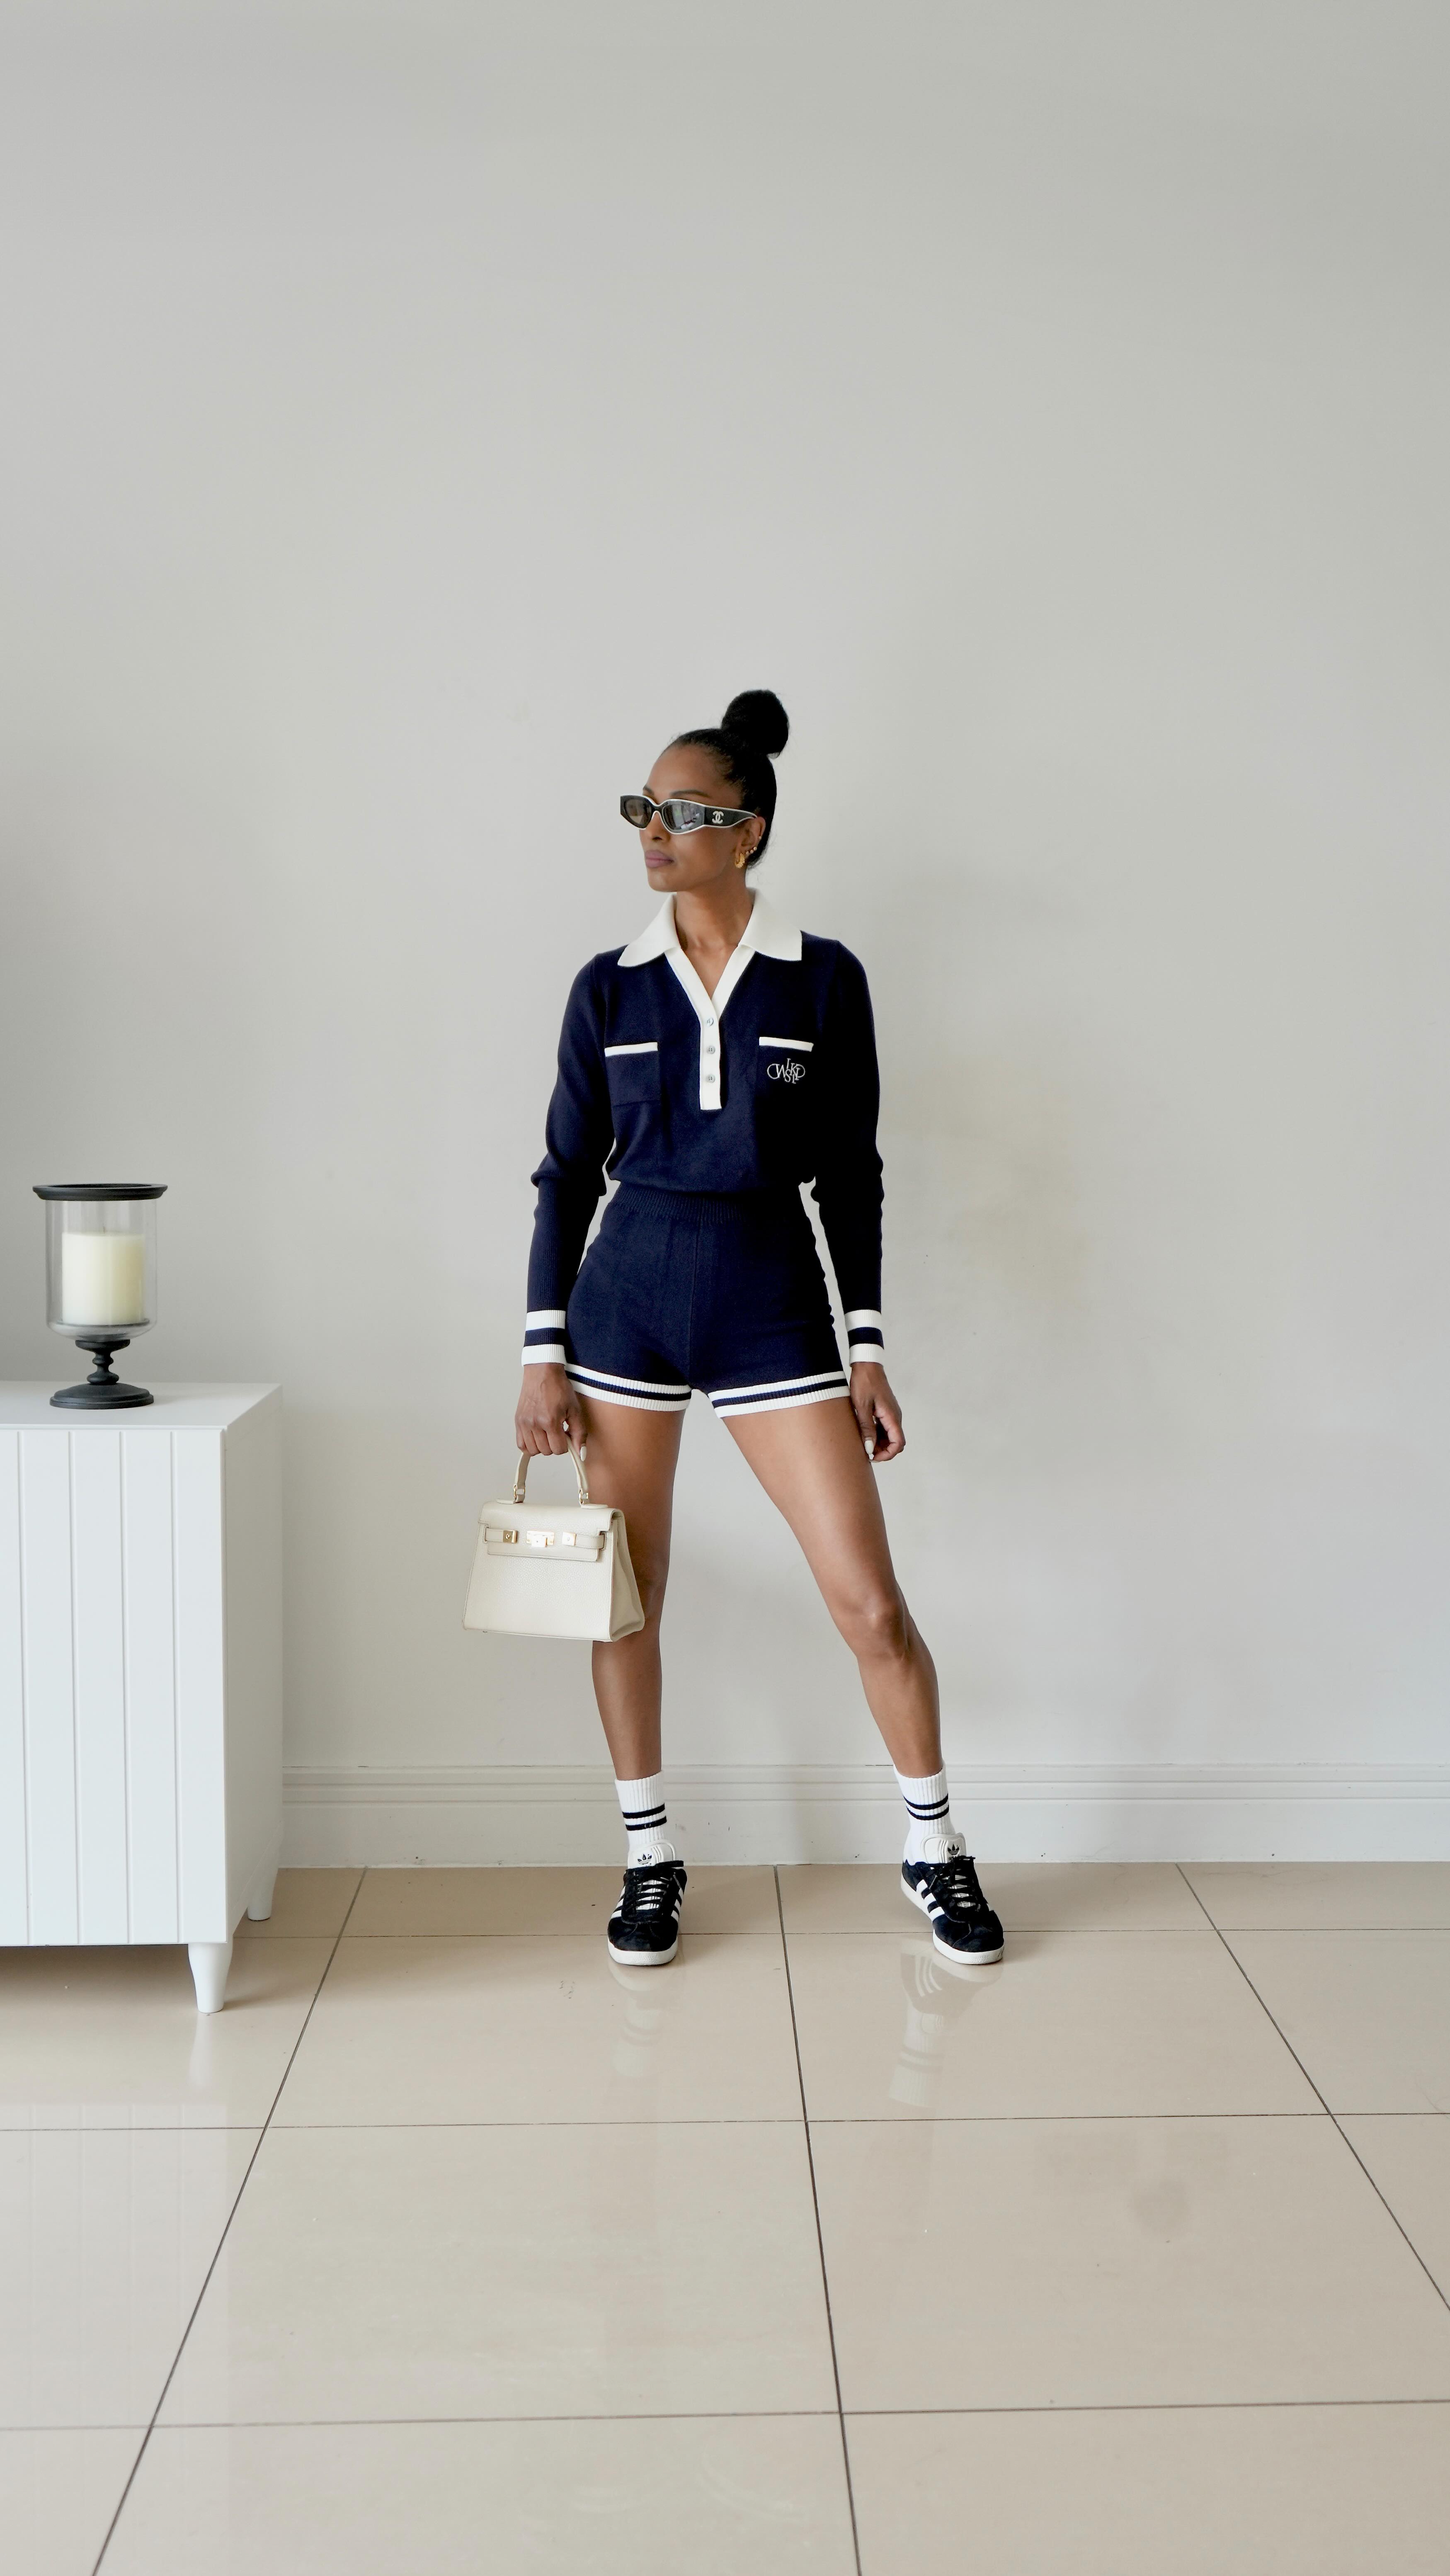
Here is another example of Wiskii Active collaborating with an influencer in United States.
charming_memoirs x Wiskii Active
![Instagram post by @charming_memoirs for Wiskii Active. Caption reads: [...] and productive week ahead. My set is....](https://images.od.modash.io/78903a996468519daae4a77992103b344d8f0c23)
Wiskii Active's influencer activity vs. related brands
Wiskii Active operates in premium activewear, where Alo Yoga and lululemon are leading competitors for yoga, studio, and athleisure consumers. They’re strong references for influencer styling, studio lifestyle content, and ambassador programs.
Total influencer content
Wiskii Active vs. related brands influencer activity
Total sponsored posts tracked (last 12 months)
Alo Yoga leads with 29.8k sponsored posts, marginally ahead of lululemon (29.4k posts) and Wiskii Active (3.8k posts). Across all three brands, the average volume is 21k posts, indicating mature, scaled influencer programs. Alo Yoga and lululemon each have several times more total posts than Wiskii Active.
By social platform
Wiskii Active vs. related brands influencer activity (by social platform)
Sponsored posts by platform
Among these brands, Alo Yoga leads on Instagram and YouTube and lululemon leads on TikTok. The gap is most notable on Instagram, with Alo Yoga at 25.3k, lululemon at 16.8k, Wiskii Active at 3.7k posts. Wiskii Active's activity is particularly concentrated on Instagram. On TikTok, lululemon and Alo Yoga each have several times more posts than Wiskii Active.
By geographical market
Wiskii Active vs. related brands influencer activity (by country)
Estimated sponsored posts in Wiskii Active's top markets
lululemon has the highest estimated sponsored-post volume in United States (15k posts, 51.8%), United Kingdom (2.6k posts, 8.9%), Japan (1.6k posts, 5.5%), while Alo Yoga has the highest estimated sponsored-post volume in Brazil (2.5k posts, 8.4%), India (1.4k posts, 4.7%). Looking at United States specifically, the split is lululemon at 15k posts (51.8%), Alo Yoga at 12k posts (38.7%), Wiskii Active at 1.1k posts (29.3%).
Read more influencer strategy breakdowns
Looking for more like this? Here are 5 similar influencer marketing strategy breakdowns for other brands:
- Alo Yoga's Influencer Marketing Strategy
- lululemon's Influencer Marketing Strategy
- VEGAMOUR's Influencer Marketing Strategy
- LSKD's Influencer Marketing Strategy
- Magic Spoon's Influencer Marketing Strategy
Or, if you want to access data like this for your own software or processes, take a look at Modash's API products:
Frequently asked questions
Scaling your influencer program?
When you outgrow your mishmash of spreadsheets & free tools, try Modash. Find & email influencers, track campaigns, ship products & more - all in one place.