Yepoda Influencer Marketing Strategy
(2026 Data & Insights)
We analyzed 11.1k pieces of influencer content sponsored by Yepoda over the last 12 months.
This report breaks down where & how Yepoda invests in influencer marketing, which social platforms they prioritize, top geographical markets, and more.
The data in this report comes from Modash's Brand Collaborations API.
P.S. for a simple list of influencers who have collaborated with Yepoda, see here: Yepoda influencers.
Influencer activity throughout the year
Yepoda's influencer campaigns are active year-round with notable month-to-month fluctuation. The chart below shows month-by-month data for total sponsored posts tracked.
Yepoda's influencer activity by month
Number of sponsored posts
Yepoda's influencer output appears relatively consistent throughout the year, averaging about 919 sponsored posts per month. October recorded the highest volume at 1.1k posts (23% above average), while June was the quietest at 630 posts.
Social platforms breakdown
In our dataset (which only includes Instagram, YouTube, and TikTok), this is how the volume of Yepoda's sponsored influencer collaborations break down by social platform:
- Instagram: 6.1k posts (55.6%)
- TikTok: 4.9k posts (44.2%)
- YouTube: 27 posts (0.2%)
Yepoda's influencer activity by platform
Share of sponsored content by social network
Instagram influencer marketing is a clear focus for Yepoda.
Here are 3 examples of Yepoda's recent sponsored collaborations (one each for Instagram, TikTok, YouTube).
basya_skincare x Yepoda
Influencer bio
✨skincare & haircare per principianti 🧊 💕noi non invecchieremo mai 🖤tik tok ➡️ basya_rizzi (19k) 💌 babiskin.collab@gmail.com
Collaboration metrics
Get a free trial to find more data on influencer audiences, performance, and collaborations.
inesxb x Yepoda
![TikTok post by @inesxb for Yepoda. Caption reads: [...] @Erborian France @Uriage France @Yepoda....](https://images.od.modash.io/eda2a177ce91cfef1ada65704b8d0bf244f97c40)
Influencer bio
Sc : S.ines Ig : inesxb_ Makeup, Skincare, Lifestyle✨ 💌 inesxb@irismanagement.fr
Collaboration metrics
Get a free trial to find more data on influencer audiences, performance, and collaborations.
daisychoiii x Yepoda

Influencer bio
Hey, I'm Daisy♡ welcome to my digital diary, xoxo. I'm a Korean-Canadian content creator based in AB, Canada. On my channel you can expect to see productivity vlogs, food diaries, fashion and beauty videos.
Collaboration metrics
Get a free trial to find more data on influencer audiences, performance, and collaborations.
If you break this down further by content type on Instagram, this is what it looks like:
- Reels: 94.7%
- Posts: 5.3%
💡 Related resource: How To Find Instagram Influencers.
Influencer audience size breakdown (by views)
For their top social platform (Instagram), here is a breakdown of the type of influencers Yepoda are collaborating with, by audience size.
Note: this breakdown is based on each influencer's average views (not follower/subscriber count), because views typically correlate more closely with influencer pricing and impact.
Yepoda's influencers average views (Instagram)
Based on each influencer's average views per post
With 31.2% of partnerships featuring creators averaging 10K-50K views, Yepoda's strategy suggests cost-efficiency and engagement-focused partnerships. The 100K-500K views segment is also prominent at 24%, indicating investment across adjacent tiers.
Here is an example of a sponsored collaboration with a larger-audience creator on Instagram (1.5M avg views/post):
victoria_mehault x Yepoda
![Instagram post by @victoria_mehault for Yepoda. Caption reads: [...] pour bronzer, c’est à vous que je parle....](https://images.od.modash.io/e4d642a662569ba1321dd7f1efca66a64e318758)
Influencer bio
influenceuse quand g envie mum of Lio victoriamehault@sunymanagement.com
Collaboration metrics
Get a free trial to find more data on influencer audiences, performance, and collaborations.
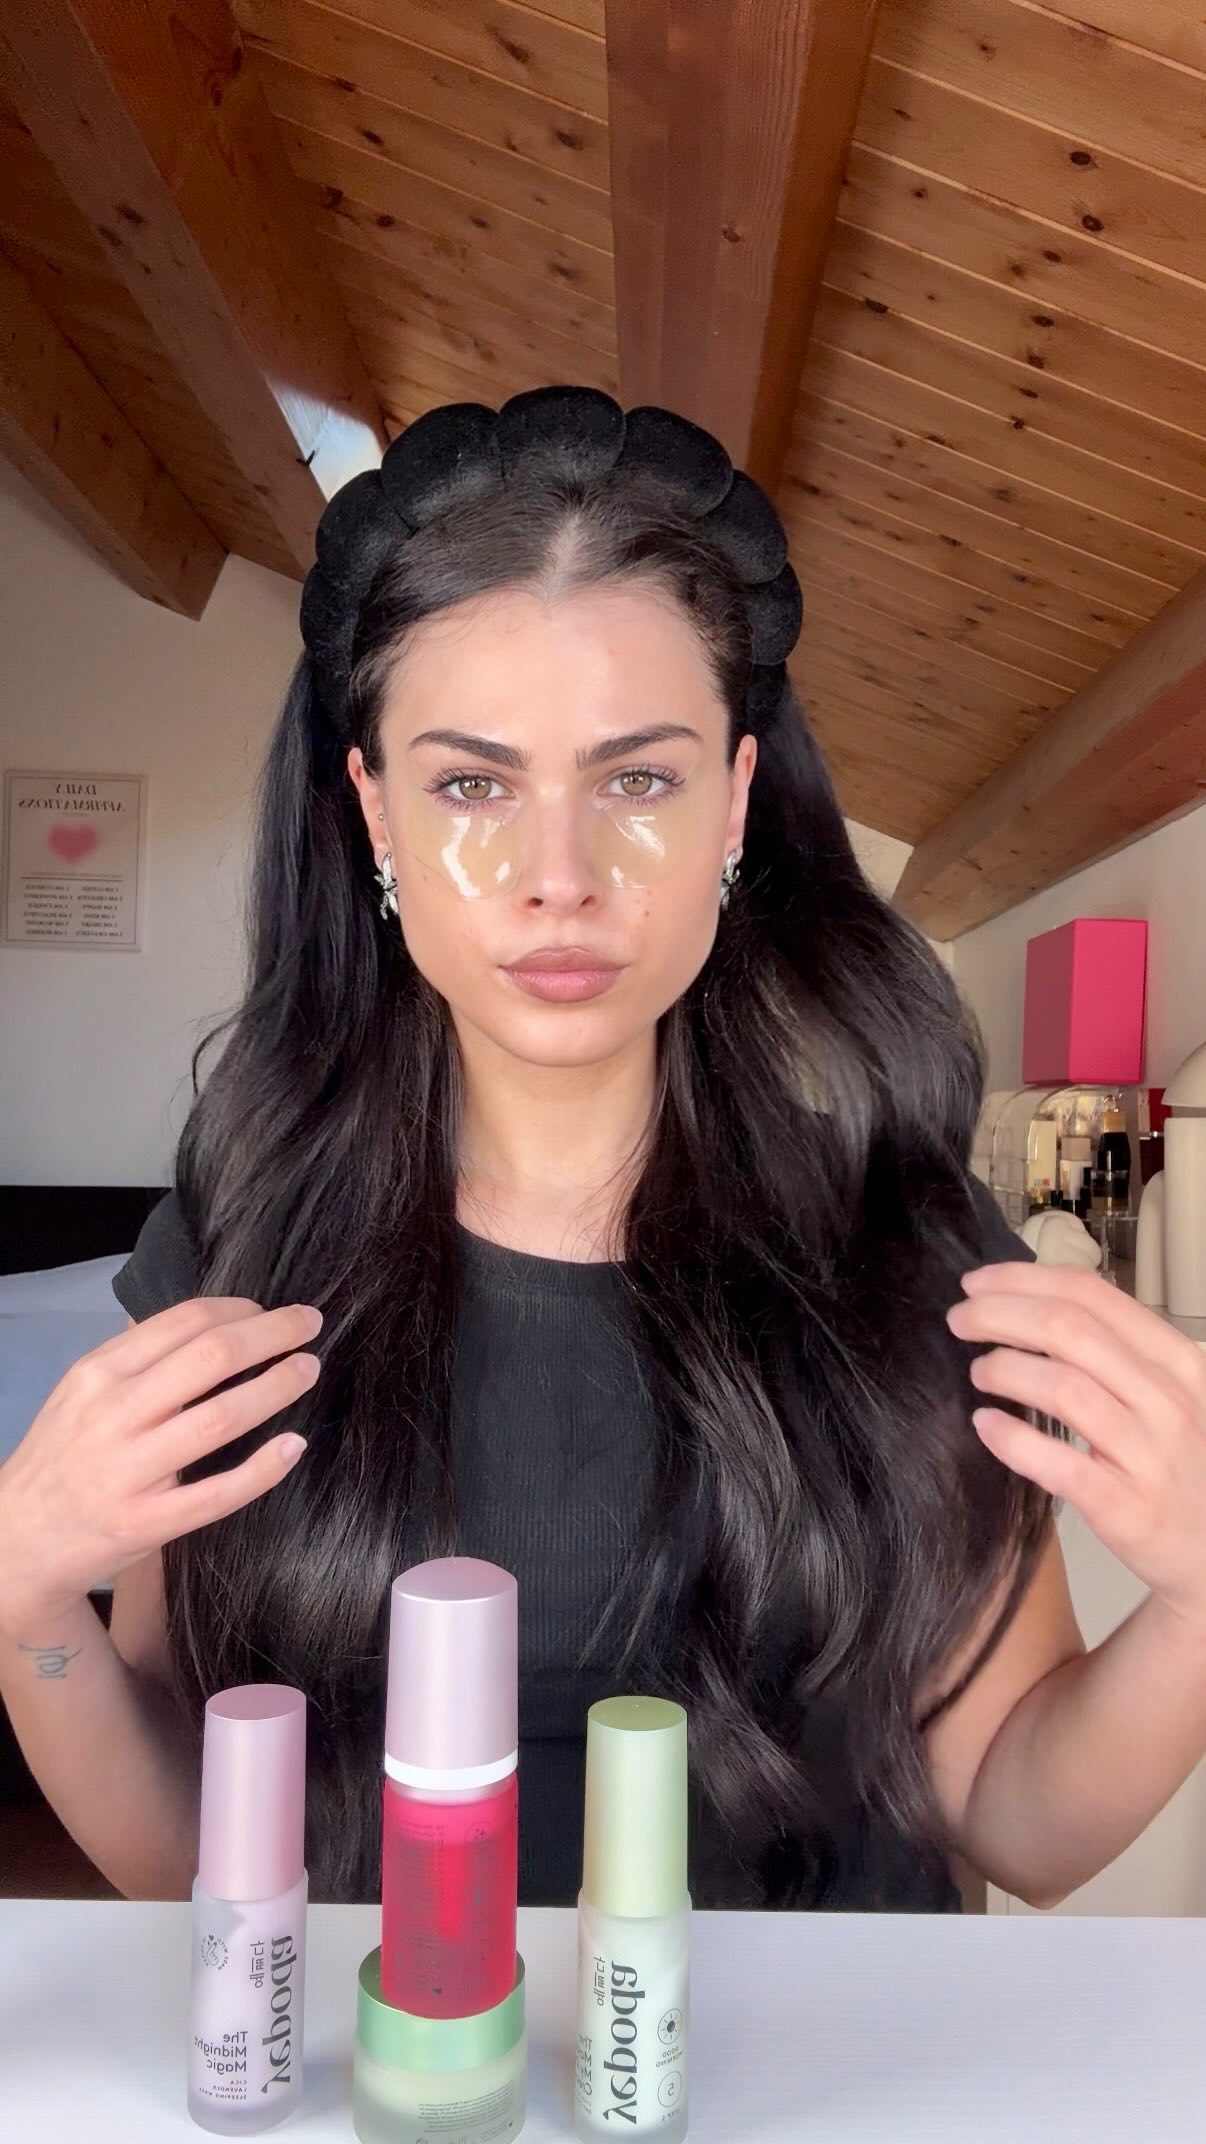
And here is another example with a smaller creator on Instagram (10.0k avg views/post):
al_crean_beauty x Yepoda
![Instagram post by @al_crean_beauty for Yepoda. Caption reads: [...] morning routine, obvs it’s k beauty @yepoda....](https://images.od.modash.io/fb5731d6e78979a008702d482c02dab2d24b27b6)
Influencer bio
International MUA & Brow Stylist | UK 🎥 UGC for beauty brands ✨ Beauty • brows • my life 💄 DM for services | Collabs ↓ alexcrean808@gmail.com
Collaboration metrics
Get a free trial to find more data on influencer audiences, performance, and collaborations.
Yepoda's repeat partnerships
Out of 4.5k unique influencers in our dataset, 1.2k of them (27%) posted content for Yepoda in 3 or more separate calendar months. The most consistent partner is @ilariaagalloni, who has collaborated across 12 months with 12 total posts.
Here are 3 examples of Yepoda's repeat influencer partnerships, with links to the sponsored content.
ilariaagalloni x Yepoda
![Instagram post by @ilariaagalloni for Yepoda. Caption reads: [...] i 🌴SUMMER SALE🌴 sul sito di @yepoda.it,....](https://images.od.modash.io/89452d507f84345fa6f1a910489bee38cbee9622)
![Instagram post by @ilariaagalloni for Yepoda. Caption reads: [...] dei miei preferiti 🧴🫧🤍 #ad @yepoda.it....](https://images.od.modash.io/8c9e566af78efb54986607df24775a02cfd40a8b)
arnau.beauty x Yepoda
![TikTok post by @arnau.beauty for Yepoda. Caption reads: [...] las glass skin coreana de @Yepoda con su....](https://images.od.modash.io/cf1300cd04de58504659a7849f30cbdaab435e46)
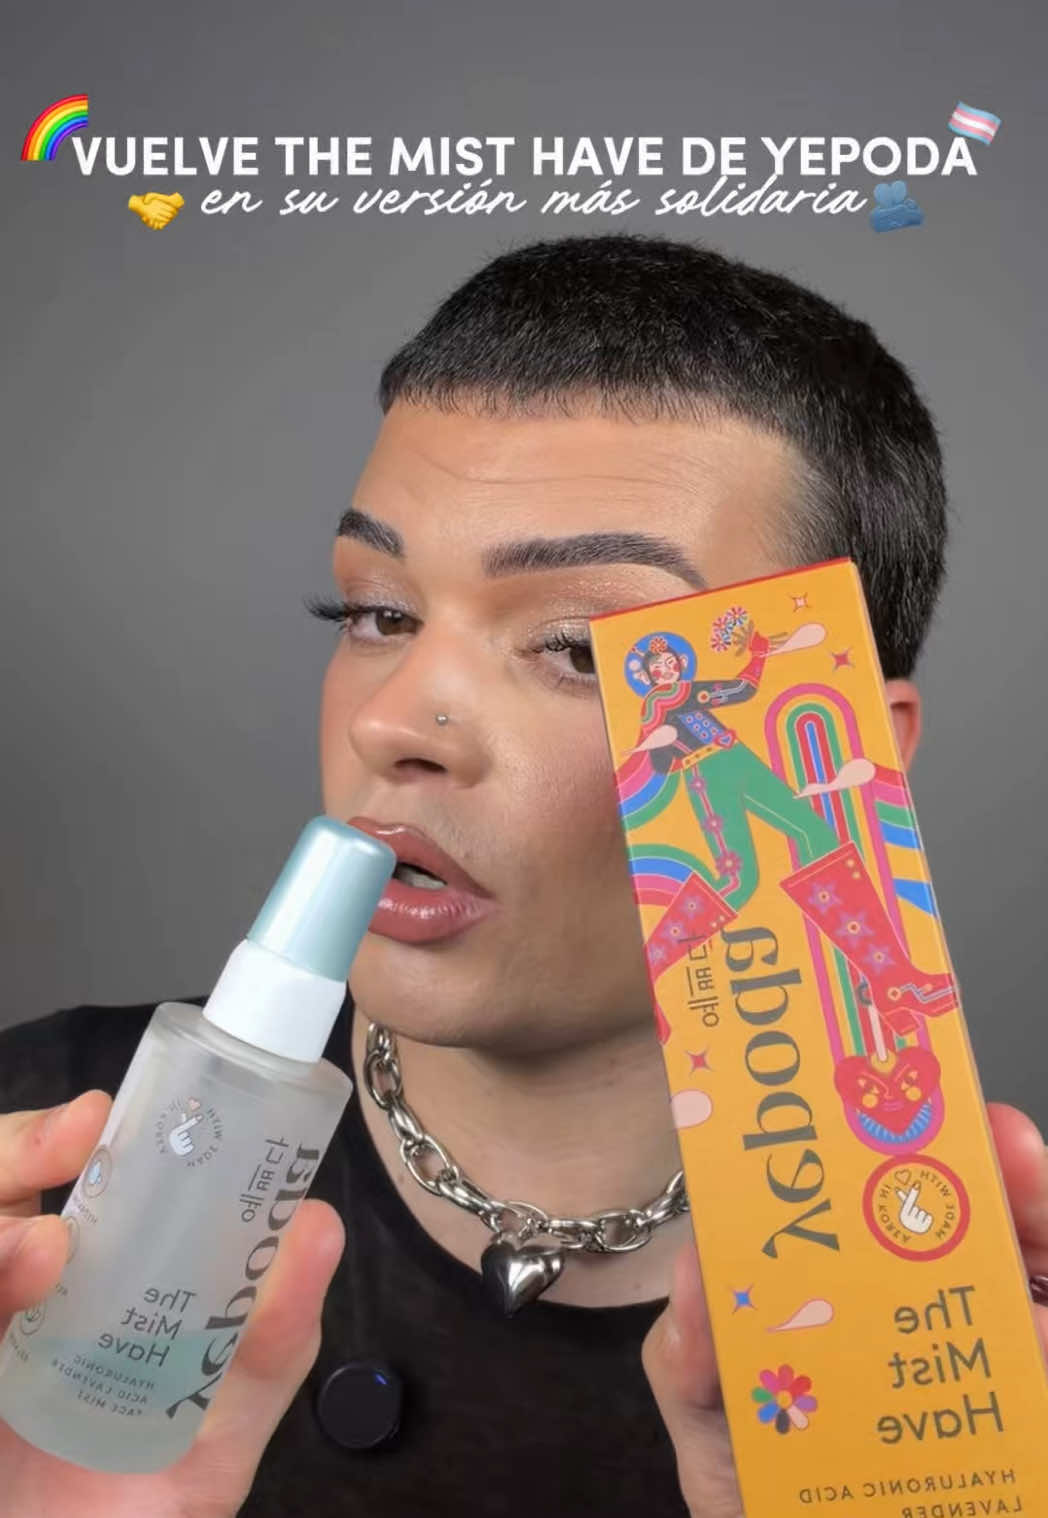
![TikTok post by @arnau.beauty for Yepoda. Caption reads: [...] The Depuff Eyespresso de @Yepoda 🫰🏻✨🫶....](https://images.od.modash.io/135f09f53f322b3a48c49cca1a44f58ff25a8c2b)
arnau.beauty x Yepoda
![Instagram post by @arnau.beauty for Yepoda. Caption reads: otro año más @yepoda.es nos trae una versión [...].](https://images.od.modash.io/c772d7ec13b7b81e495489e87d5dc2d38ce10b5c)
![Instagram post by @arnau.beauty for Yepoda. Caption reads: [...] las glass skin coreana de @yepoda.es ✨🫧 con....](https://images.od.modash.io/9b8c5d8ab364d9fee604f48946ce3c71b438592f)
![Instagram post by @arnau.beauty for Yepoda. Caption reads: [...] con The Full Glow Set de @yepoda.es 💓....](https://images.od.modash.io/a70b76e46b45449313c8667d993f5c4c97a88233)
💡 Related resource: Long-Term Influencer Partnerships: Pros, Cons & How The Pros Manage Them.
Geographical breakdown
In our dataset, Italy is where Yepoda had the most influencer activity. 28.5% of their live influencer content in the last 12 months was posted by Italian influencers.
Based on the percentage of influencer content per market, other important markets include:
- France (13.1%)
- Spain (11.9%)
- United States (11.6%)
Yepoda's influencer activity by market
Here is another example of Yepoda collaborating with an influencer in Italy.
margheritazanatta x Yepoda
![Instagram post by @margheritazanatta for Yepoda. Caption reads: [...] testare per la prima volta i prodotti di....](https://images.od.modash.io/26b2a7ed25f0af2a206c2ca528634b2a1de68f4c)
Yepoda's influencer activity vs. related brands
Yepoda competes in skincare with a routine-first, ingredient-led approach, similar to Typology and The Inkey List. They overlap in audiences who discover products through educational creator content and step-by-step regimens.
Total influencer content
Yepoda vs. related brands influencer activity
Total sponsored posts tracked (last 12 months)
Yepoda leads with 11.1k sponsored posts, significantly outpacing Theinkeylist (8.1k posts) and Typology (2.4k posts). Across all three brands, the average volume is 7.2k posts, indicating mature, scaled influencer programs. Yepoda has more total posts than Typology and Theinkeylist.
By social platform
Yepoda vs. related brands influencer activity (by social platform)
Sponsored posts by platform
Yepoda leads on Instagram, while Theinkeylist has the most activity on TikTok and Typology has the most activity on YouTube. The gap is most notable on Instagram, with Yepoda at 6.1k, Typology at 1.3k, Theinkeylist at 1k posts. Theinkeylist's activity is particularly concentrated on TikTok. Typology has many more YouTube posts than Yepoda and Theinkeylist.
By geographical market
Yepoda vs. related brands influencer activity (by country)
Estimated sponsored posts in Yepoda's top markets
Theinkeylist has the highest estimated sponsored-post volume in United States (3.7k posts, 45.2%), United Kingdom (1.6k posts, 19.6%), Canada (318 posts, 3.9%), suggesting a North America focus, while Yepoda has the highest estimated sponsored-post volume in Italy (3.1k posts, 28.5%), France (1.4k posts, 13.1%), Spain (1.3k posts, 11.9%), suggesting a Europe focus, while Typology leads in Japan with 405 posts (17%). Looking at United States specifically, the split is Theinkeylist at 3.7k posts (45.2%), Typology at 726 posts (30.5%). Yepoda's strength in France may indicate a home-market focus, while Theinkeylist shows broader regional investment.
Read more influencer strategy breakdowns
Looking for more like this? Here are 5 similar influencer marketing strategy breakdowns for other brands:
- Typology's Influencer Marketing Strategy
- Theinkeylist's Influencer Marketing Strategy
- HSIA Lingerie's Influencer Marketing Strategy
- BURGA's Influencer Marketing Strategy
- Dolce Vita's Influencer Marketing Strategy
Or, if you want to access data like this for your own software or processes, take a look at Modash's API products:
Frequently asked questions
Scaling your influencer program?
When you outgrow your mishmash of spreadsheets & free tools, try Modash. Find & email influencers, track campaigns, ship products & more - all in one place.