Yomoment Influencer Marketing Strategy
(2026 Data & Insights)
We analyzed 1.6k pieces of influencer content sponsored by Yomoment over the last 12 months.
This report breaks down where & how Yomoment invests in influencer marketing, which social platforms they prioritize, top geographical markets, and more.
The data in this report comes from Modash's Brand Collaborations API.
P.S. for a simple list of influencers who have collaborated with Yomoment, see here: Yomoment influencers.
Influencer activity throughout the year
Yomoment's influencer campaigns are active year-round with notable month-to-month fluctuation. The chart below shows month-by-month data for total sponsored posts tracked.
Yomoment's influencer activity by month
Number of sponsored posts
Yomoment's influencer output appears relatively consistent throughout the year, averaging about 136 sponsored posts per month. November recorded the highest volume at 189 posts (39% above average), while March was the quietest at 104 posts.
Social platforms breakdown
In our dataset (which only includes Instagram, YouTube, and TikTok), this is how the volume of Yomoment's sponsored influencer collaborations break down by social platform:
- Instagram: 1.6k posts (98.4%)
- YouTube: 27 posts (1.6%)
Yomoment's influencer activity by platform
Share of sponsored content by social network
Instagram influencer marketing is a clear focus for Yomoment.
Here are 2 examples of Yomoment's recent sponsored collaborations (one each for Instagram, YouTube).
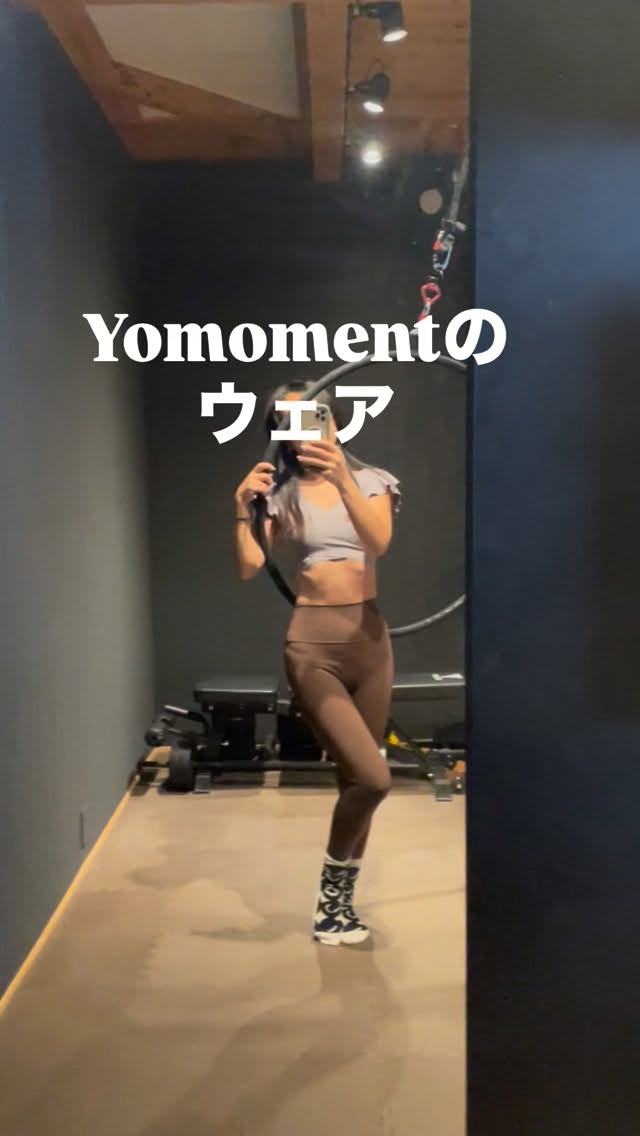
nachi_365diary x Yomoment
![Instagram post by @nachi_365diary for Yomoment. Caption reads: [...] テンションの上がる可愛いウェアが必要不可欠。👆 この日のウェアは....](https://images.od.modash.io/07585a0a14314c1a7a8aaa630380389fae950b01)
Influencer bio
𝗧𝗼𝗸𝘆𝗼|パーソナルトレーナー🏋️ たま〜に撮影モデル📷 パーソナル予約→𝗗𝗠下さい💌 さぶ🦥 @nachidayooo  ̄ ̄ ̄ ̄ ̄ ̄ ̄ ̄ ̄ ̄ ̄ ̄ ̄ ̄ ̄ ̄ ̄ ̄ ̄ 好きな食べ物はソースカツ丼❗️福井出身🦖💨 ⬇️YouTubeはじめました💡
Collaboration metrics
Get a free trial to find more data on influencer audiences, performance, and collaborations.
wanko_bodymake x Yomoment
![YouTube post by @wanko_bodymake for Yomoment. Caption reads: [...] 気持ちのいい範囲でやってみて🙌 【yomomentのアンバサダーになりました🐶】....](https://images.od.modash.io/6b30430fdd128d178c4896442238c97b1bebf4d5)
Influencer bio
\ワーママの脂肪を希望に変える/ ♥100人以上ダイエットサポートしてきた元インストラクター ♥転職のストレス→暴飲暴食で+17kg🍖 ♥着たい服が似合うカラダに👗 MAX69kg ☞ 現在-6.9kg 41歳|160cm|1児の母
Collaboration metrics
Get a free trial to find more data on influencer audiences, performance, and collaborations.
If you break this down further by content type on Instagram, this is what it looks like:
- Posts: 55.5%
- Reels: 44.5%
💡 Related resource: How To Find Instagram Influencers.
Influencer audience size breakdown (by views)
For their top social platform (Instagram), here is a breakdown of the type of influencers Yomoment are collaborating with, by audience size.
Note: this breakdown is based on each influencer's average views (not follower/subscriber count), because views typically correlate more closely with influencer pricing and impact.
Yomoment's influencers average views (Instagram)
Based on each influencer's average views per post
Yomoment's creator selection appears relatively diversified across size tiers, with no single segment dominating. This suggests a balanced approach to influencer partnerships, spreading investment across different audience sizes.
Here is an example of a sponsored collaboration with a larger-audience creator on Instagram (247.9k avg views/post, 17.7k followers):
baba_kirei_ x Yomoment
![Instagram post by @baba_kirei_ for Yomoment. Caption reads: [...] \20~70%offのサマーセール中/ 私が愛用してる....](https://images.od.modash.io/a834c62f93f56e7c9ac5a5b56375f3f505022d5f)
Influencer bio
⋱「隠す服」から「着たい服」を着こなす自分に👗✨⋰ ⌇産後太りで自信も着れる服も失ったアラフォー ⌇ 164cm┆80kg ⇢ 65kg ⇢目標52kg ⌇ バストそげそげ下半身はどっしり🍑 . 鏡の自分に「イケてるじゃん!」って言える自分になる🪞✨
Collaboration metrics
Get a free trial to find more data on influencer audiences, performance, and collaborations.
And here is another example with a smaller creator on Instagram (9.8k avg views/post, 13.9k followers):
kurumi_0628 x Yomoment

Influencer bio
Tokyo⇔Fukuoka 153cm pilates instructor 撮影やお仕事のご依頼はdmまでお願いします💌
Collaboration metrics
Get a free trial to find more data on influencer audiences, performance, and collaborations.
Yomoment's repeat partnerships
Out of 668 unique influencers in our dataset, 82 of them (12%) posted content for Yomoment in 3 or more separate calendar months. The most consistent partner is @shiroancoco, who has collaborated across 13 months with 119 total posts. @shiroancoco alone accounts for 7% of all tracked sponsored content.
Here are 3 examples of Yomoment's repeat influencer partnerships, with links to the sponsored content.
shiroancoco x Yomoment
![Instagram post by @shiroancoco for Yomoment. Caption reads: ・ @yomoment_official の新作ウェア🤎 [...].](https://images.od.modash.io/198a7c41eaadc5a6470a4ccd965a55fd201f023c)
![Instagram post by @shiroancoco for Yomoment. Caption reads: [...] to become 🏋🏻♂️❤️🔥 tops....](https://images.od.modash.io/1ad299503c0787915f0e81ee739e27bca90e4f24)
![Instagram post by @shiroancoco for Yomoment. Caption reads: [...] @derossi_interior leggings....](https://images.od.modash.io/232a355c5d9603999ac0197dee6557d4f3f92bf7)
si.1020_fit x Yomoment
![Instagram post by @si.1020_fit for Yomoment. Caption reads: [...] あっという間に 秋 終わりそう〜😭 . Wear @yomoment_official....](https://images.od.modash.io/c6510d25f33dc4abff9e6a6d26d1574a0918cf4f)
![Instagram post by @si.1020_fit for Yomoment. Caption reads: [...] お尻 目指して頑張り中😇🔥 . 🤍Wear🤎....](https://images.od.modash.io/5d2b4d92e1abba0127896f905b9f14aafb402256)
![Instagram post by @si.1020_fit for Yomoment. Caption reads: [...] . お尻がいい感じに筋肉痛で嬉しい🤤 . 🤎wear....](https://images.od.modash.io/5bace1e1c7daea5b0982ffea23f5c500842e44c9)
y.m.on x Yomoment
![Instagram post by @y.m.on for Yomoment. Caption reads: . ◆YOMOMENT GIRLS◆ 最近あまり自由な時間が作れていなかったから、 [...].](https://images.od.modash.io/dadac9bda637b01b5e4dc19baa4cfdd2707c5d6e)
![Instagram post by @y.m.on for Yomoment. Caption reads: [...] そんなウェアは今日も @yomoment_official です🤍 [...].](https://images.od.modash.io/6770be6f16002e4ac4f64258aad5842adccdbb21)
💡 Related resource: Long-Term Influencer Partnerships: Pros, Cons & How The Pros Manage Them.
Geographical breakdown
In our dataset, Japan is where Yomoment had the most influencer activity. 84.6% of their live influencer content in the last 12 months was posted by Japanese influencers.
Based on the percentage of influencer content per market, other important markets include:
- United States (4.2%)
- Taiwan (2.6%)
- Indonesia (2.5%)
Yomoment's influencer activity by market
Here is another example of Yomoment collaborating with an influencer in Japan.
naaaagi_2929 x Yomoment
Yomoment's influencer activity vs. related brands
Yomoment is best benchmarked against other comfort/lifestyle DTC brands like The Oodie that win through cozy, shareable creator content. Huel is a broader lifestyle DTC comparator with similarly performance-oriented influencer funnels and subscription-style retention tactics.
Total influencer content
Yomoment vs. related brands influencer activity
Total sponsored posts tracked (last 12 months)
Huel leads with 4.7k sponsored posts, significantly outpacing Yomoment (1.6k posts) and The Oodie (934 posts). Across all three brands, the average volume is 2.4k posts, indicating mature, scaled influencer programs. Huel has far more total posts than Yomoment and The Oodie.
By social platform
Yomoment vs. related brands influencer activity (by social platform)
Sponsored posts by platform
Among these brands, Huel leads on Instagram, TikTok, and YouTube. The gap is most notable on TikTok, with Huel at 1.7k, The Oodie at 244, Yomoment at 0 posts. Yomoment's activity is particularly concentrated on Instagram. On TikTok and YouTube, Huel posts far more than Yomoment and The Oodie.
By geographical market
Yomoment vs. related brands influencer activity (by country)
Estimated sponsored posts in Yomoment's top markets
Huel has the highest estimated sponsored-post volume in United States (2.2k posts, 48.2%), United Kingdom (1.3k posts, 27.1%), Canada (149 posts, 3.2%), suggesting a North America focus, while Yomoment has the highest estimated sponsored-post volume in Japan (1.4k posts, 84.6%), Taiwan (43 posts, 2.6%), suggesting a Asia focus, while The Oodie leads in Australia with 188 posts (20.1%). Looking at United States specifically, the split is Huel at 2.2k posts (48.2%), The Oodie at 299 posts (32%), Yomoment at 69 posts (4.2%). Yomoment's strength in Japan may indicate a home-market focus, while The Oodie shows broader regional investment.
Read more influencer strategy breakdowns
Looking for more like this? Here are 5 similar influencer marketing strategy breakdowns for other brands:
- The Oodie's Influencer Marketing Strategy
- Huel's Influencer Marketing Strategy
- BeautyBio's Influencer Marketing Strategy
- BeetlesGelPolish's Influencer Marketing Strategy
- DEZI's Influencer Marketing Strategy
Or, if you want to access data like this for your own software or processes, take a look at Modash's API products:
Frequently asked questions
Scaling your influencer program?
When you outgrow your mishmash of spreadsheets & free tools, try Modash. Find & email influencers, track campaigns, ship products & more - all in one place.