


More tools
Use cases



Most affiliate metrics guides do the same thing: hand you 18 or 20 numbers and call it thorough. More metrics, more rigor, right? Not really.
A metric isn't useful just because you can track it. It's useful because it tells you what to do next – deepen a partnership, cut a dead affiliate, fix a broken offer, move budget.
So we ranked the 10 affiliate marketing metrics worth your attention by one test: does this number change a decision you'd actually make? The ones at the top earn a look every week. The ones at the bottom mostly just fill a report.
Two quick things to hold in mind before the list:
Before we dive in deeper, here’s a quick overview of the top affiliate marketing metrics and what they tell you about your campaigns.
Your affiliate-attributed revenue tells you whether your program is actually making you money.
Affiliate-attributed revenue is the total sales you can trace back to an affiliate's link or code. The catch is that there are two versions of this number, gross and net, and only one of them gives you a good enough insight to act on.
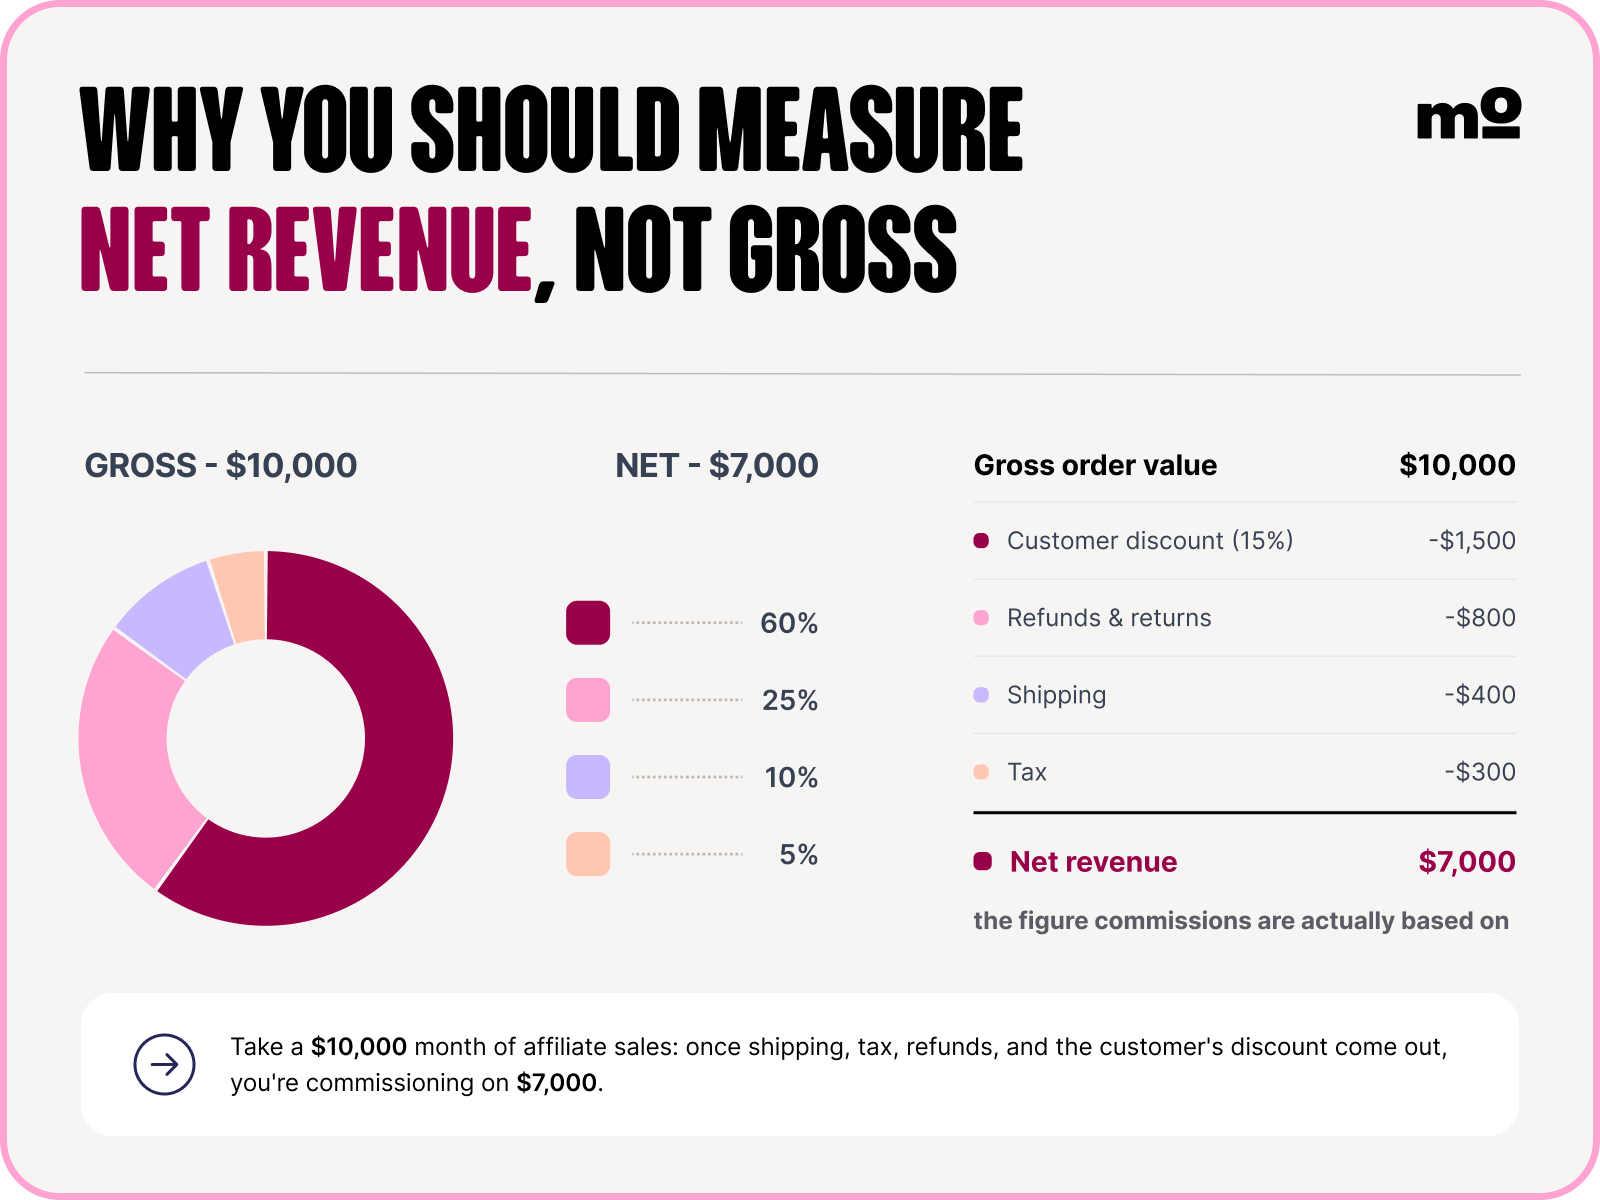
Gross revenue is just the order value. It's the bigger number, so it’s tempting to lean into it. But it also ignores everything that eats into that sale afterward, like shipping, tax, refunds and returns, and whatever discount the customer got for using the affiliate's code in the first place.
Net revenue strips all of that out. Take the order value, subtract shipping, tax, refunds and returns, and the discount. What's left is net revenue.
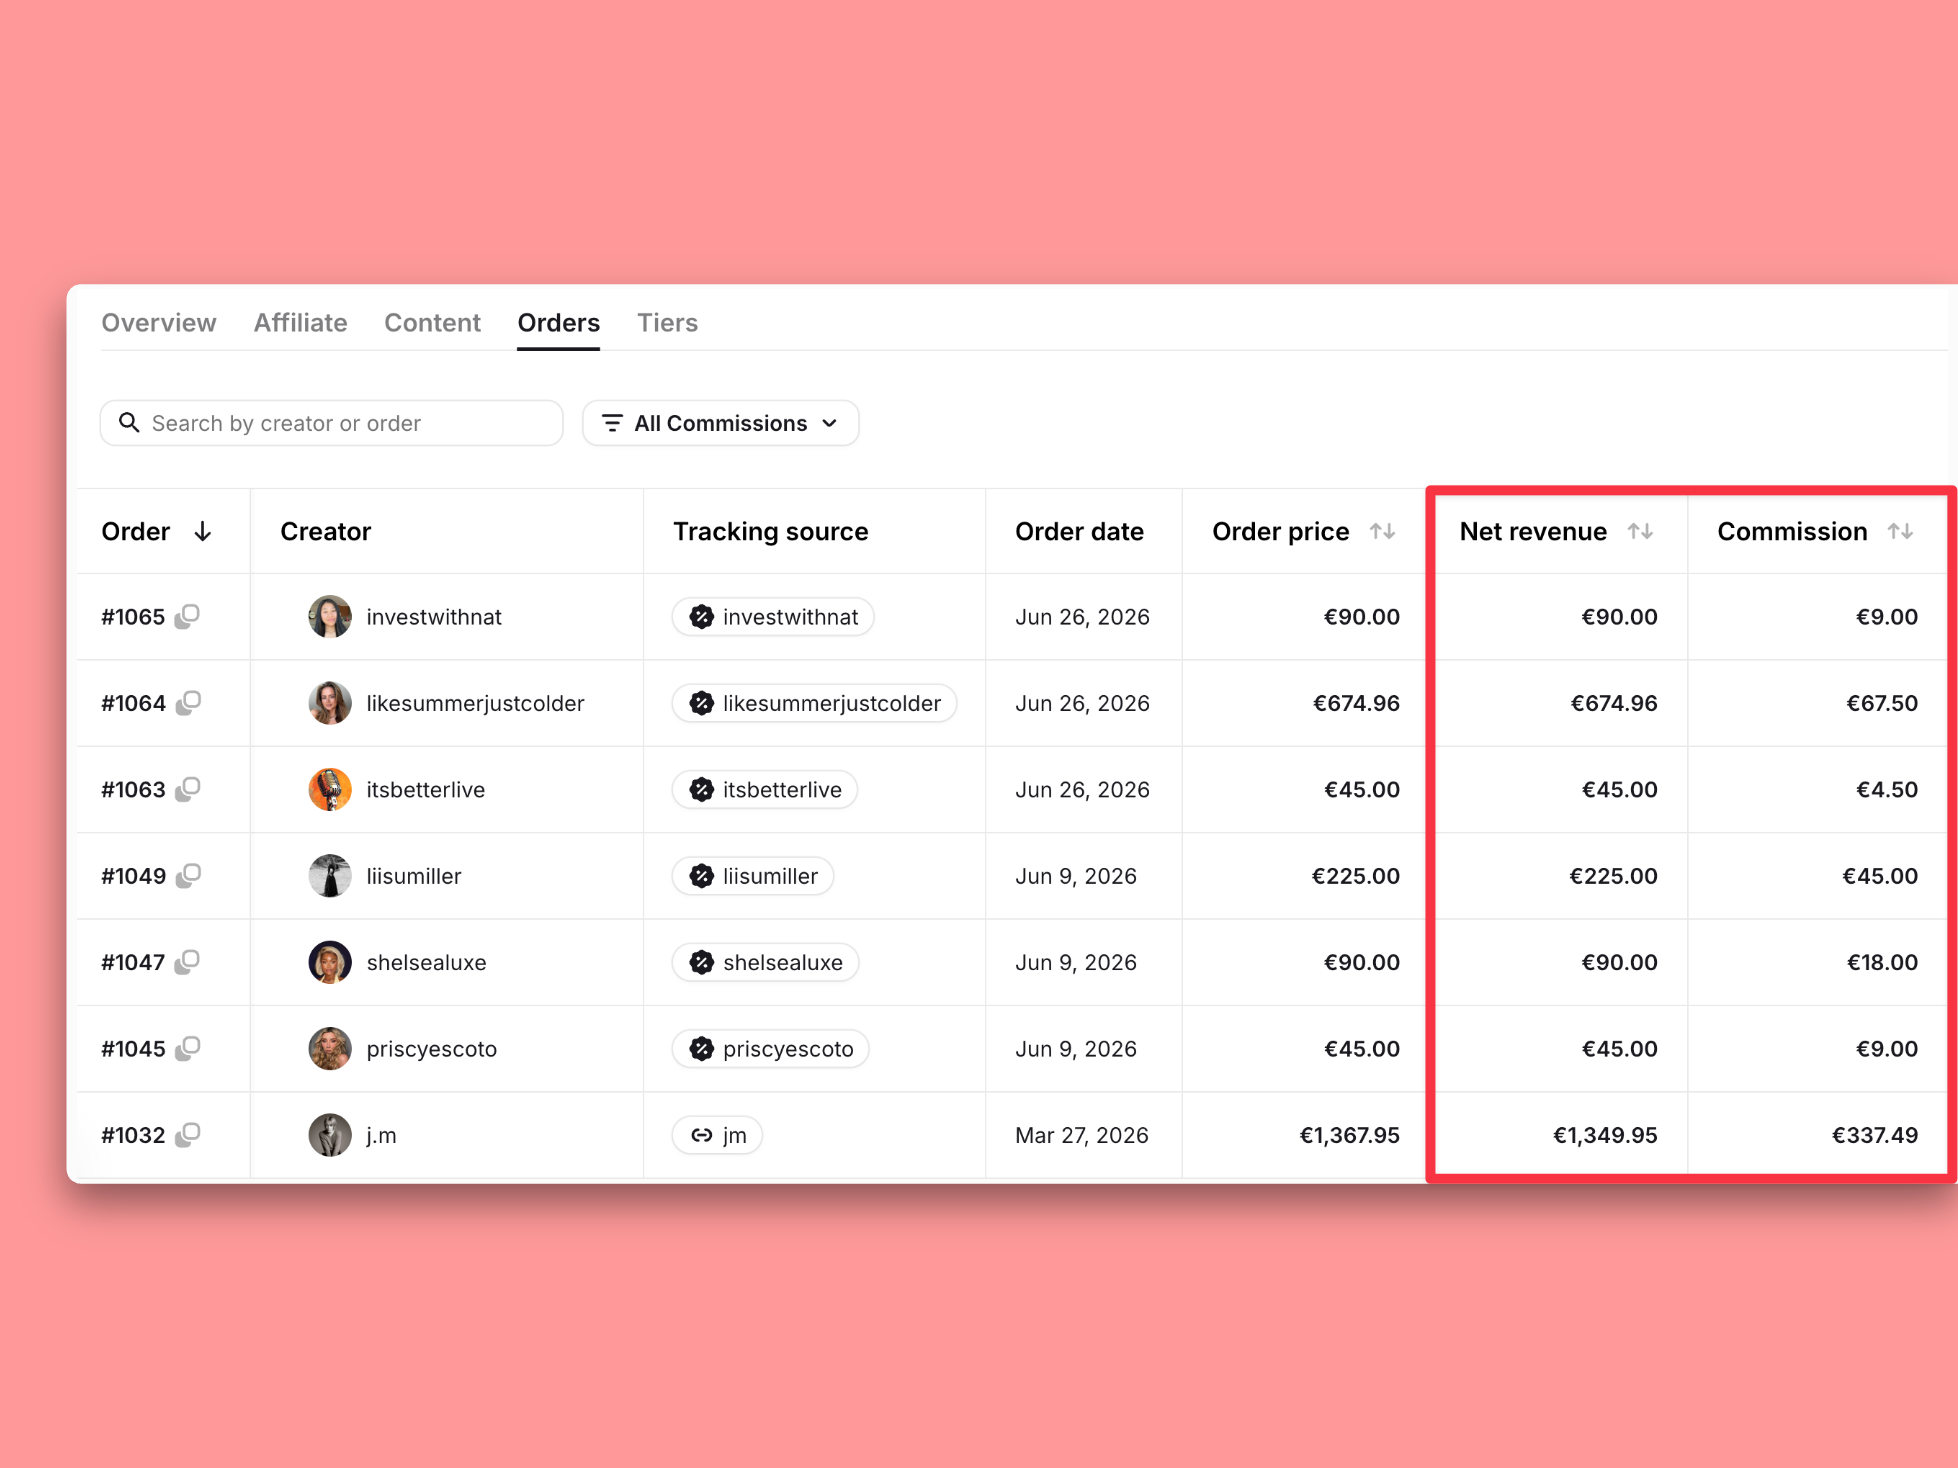
This is exactly how Modash calculates commission, too, on net revenue, not gross.
The common mistake here is reporting gross revenue simply because it's the bigger, better-looking number. It’s definitely flattering, but it doesn’t match the numbers in your bank account so it can cause a whole load of headaches later on.
Active-affiliate rate is the percentage of your enrolled affiliates who did something in a given period. That might be that they posted, drove a click, generated a sale, whatever counts as "active" for your program.
You calculate it by dividing active affiliates by total affiliates and multiplying by 100.
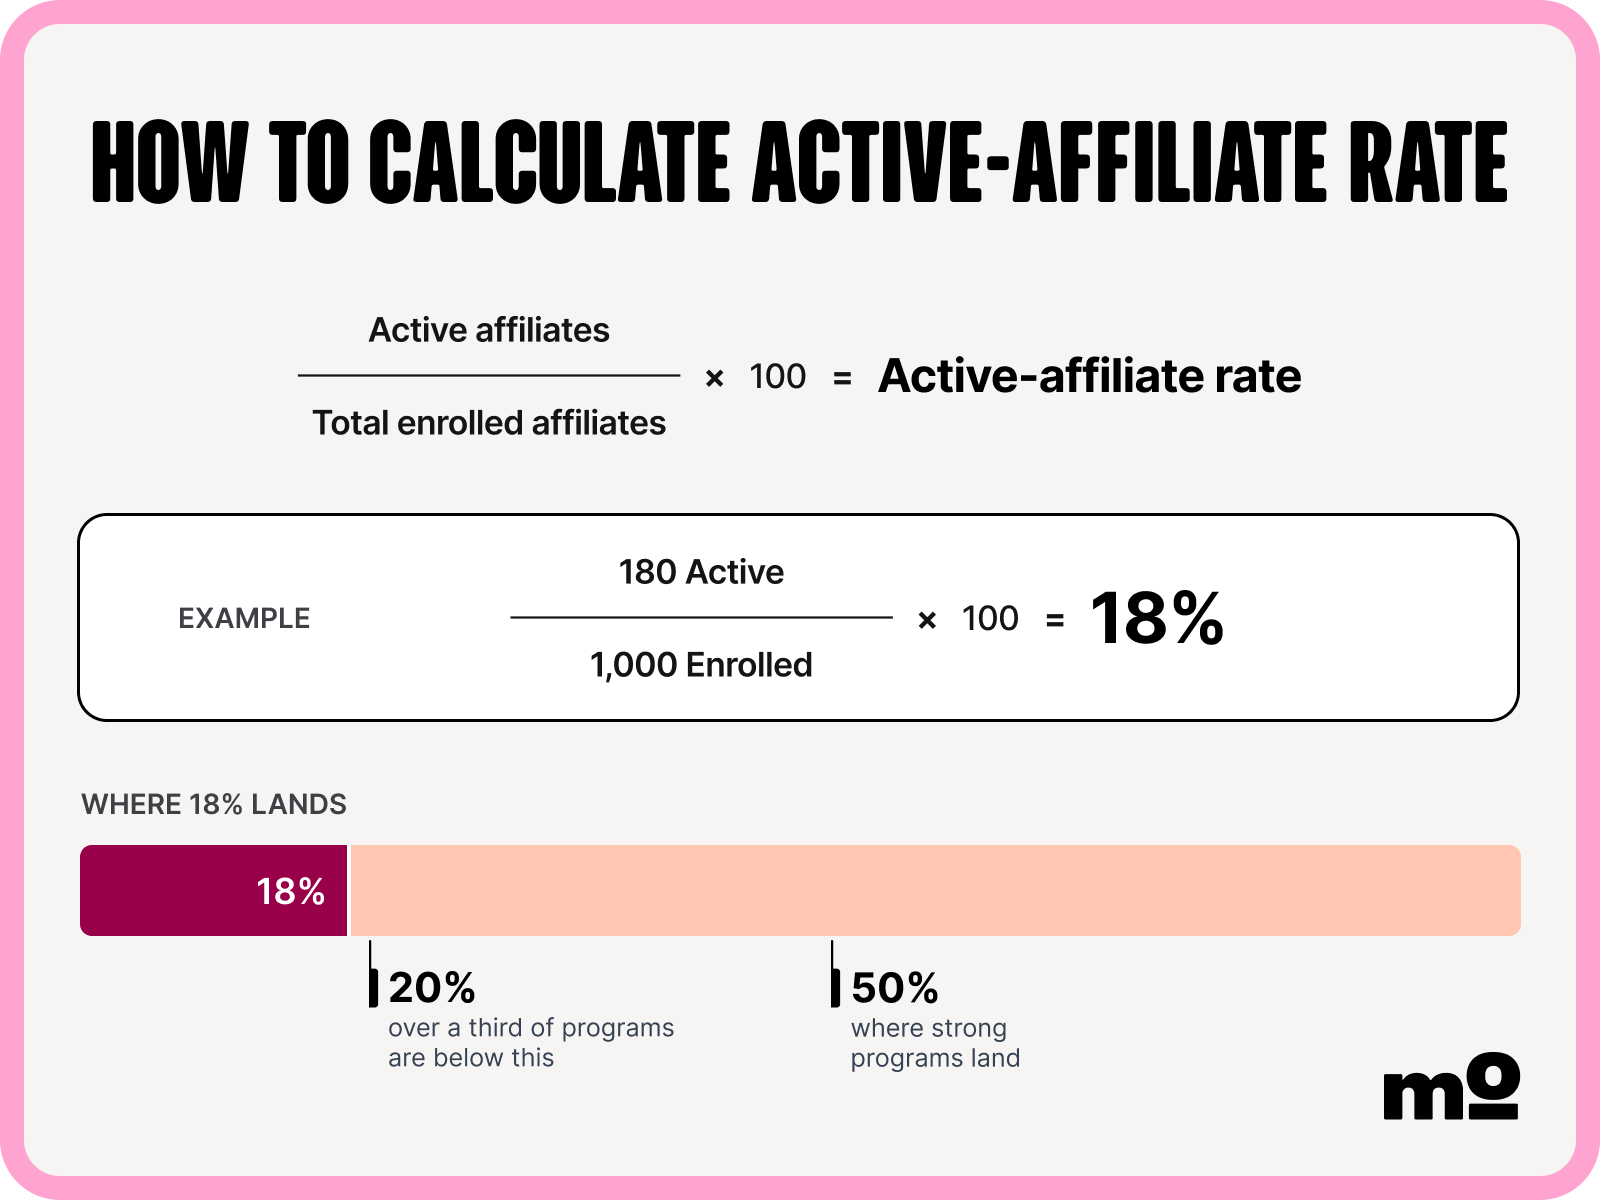
In our survey of affiliate marketers, over a third of programs have fewer than 20% active affiliates. That means most of the "affiliates" on your roster aren't doing anything at all. And most dashboards tend to bury this number under "total affiliates," which only tells you how many people signed up, not whether any of them are actually doing what they said they would.
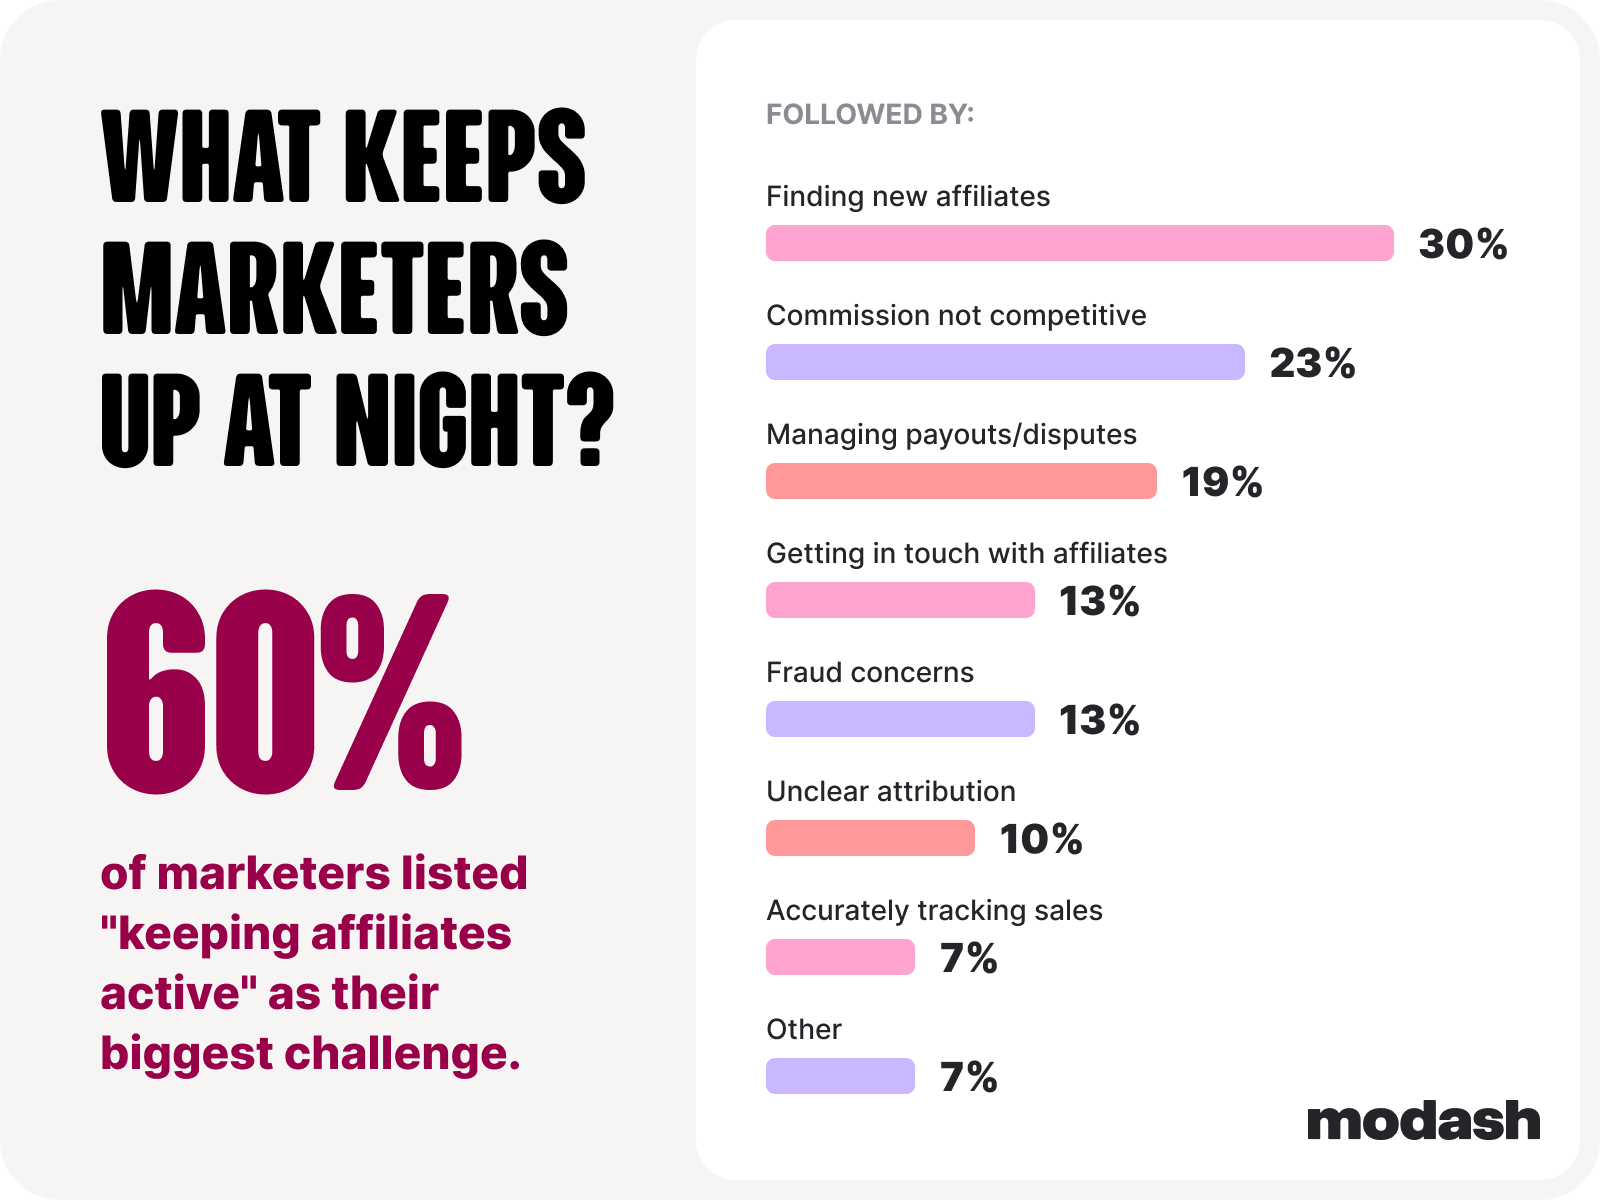
Keeping affiliates active is, in fact, the biggest challenge marketers face.
The good news: the same survey also found that active-affiliate rate tracks almost exactly with how hands-on a brand is. Programs that described themselves as "very involved" saw 71.5% of affiliates active, and that number dropped steadily the more hands-off brands got. By just going from very hands-off to somewhat hands-off, you roughly quadruple your active rate.
Note that an autopilot program can still have a decent active rate if "active" is defined loosely enough. Someone posts once this month, tick, they count as active, even if that one post generated zero sales. Active doesn't mean productive, so it's worth pairing this metric with something that reflects the actual output.
If you're defining "active" by posting frequency, Modash has a "last content" column right in the creator list, so you can see at a glance when each affiliate last posted about you, without digging through their profile yourself.
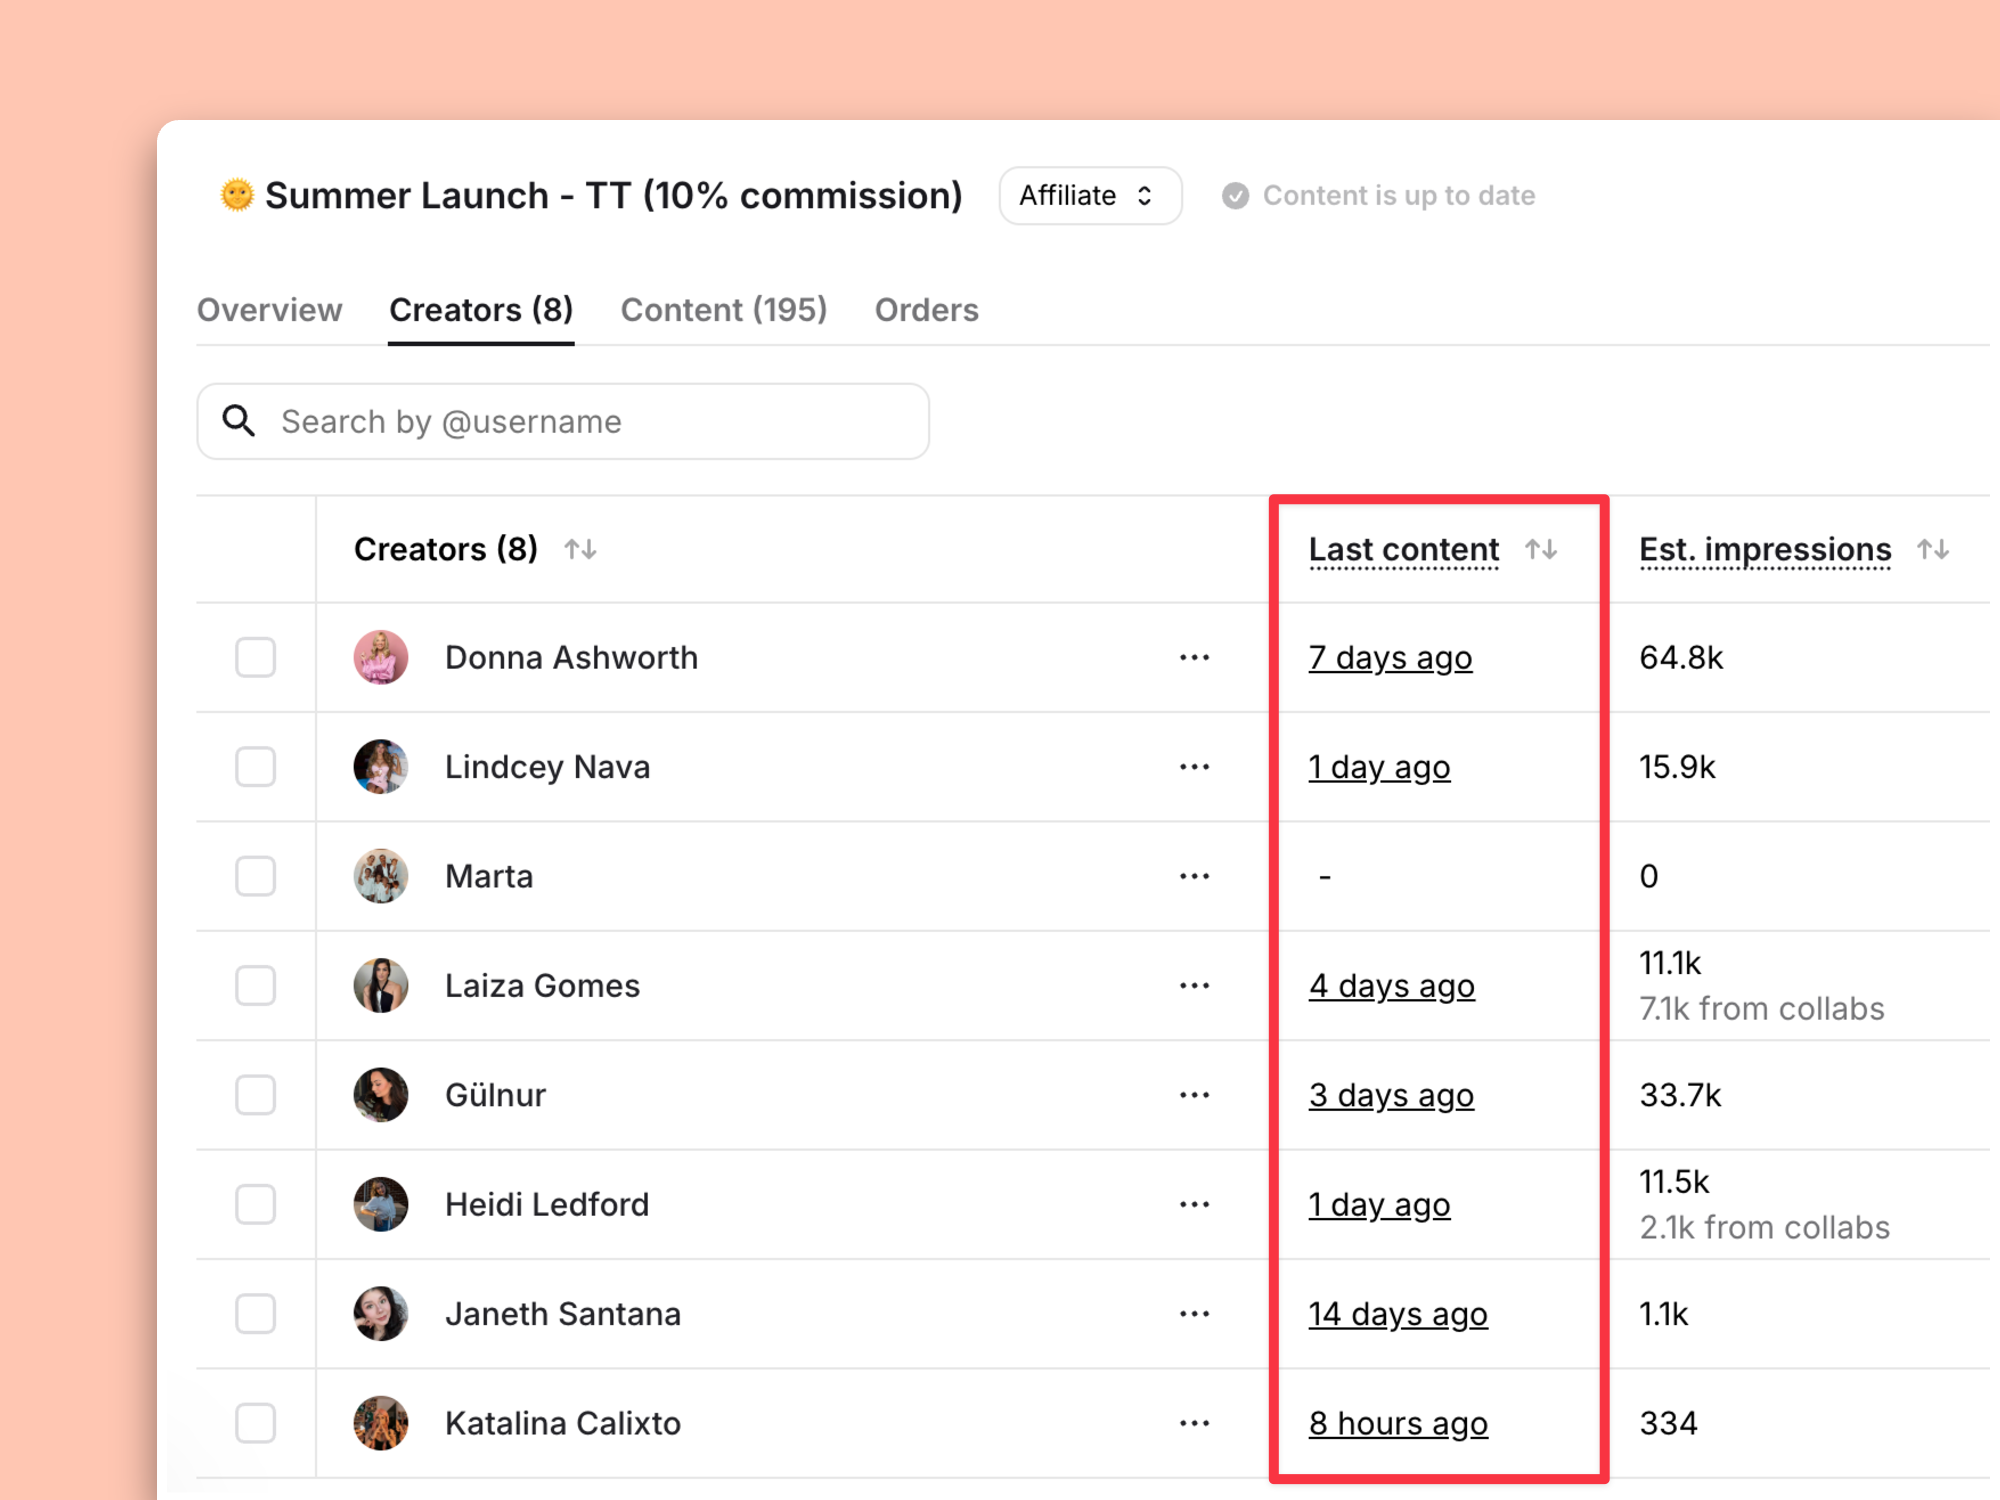
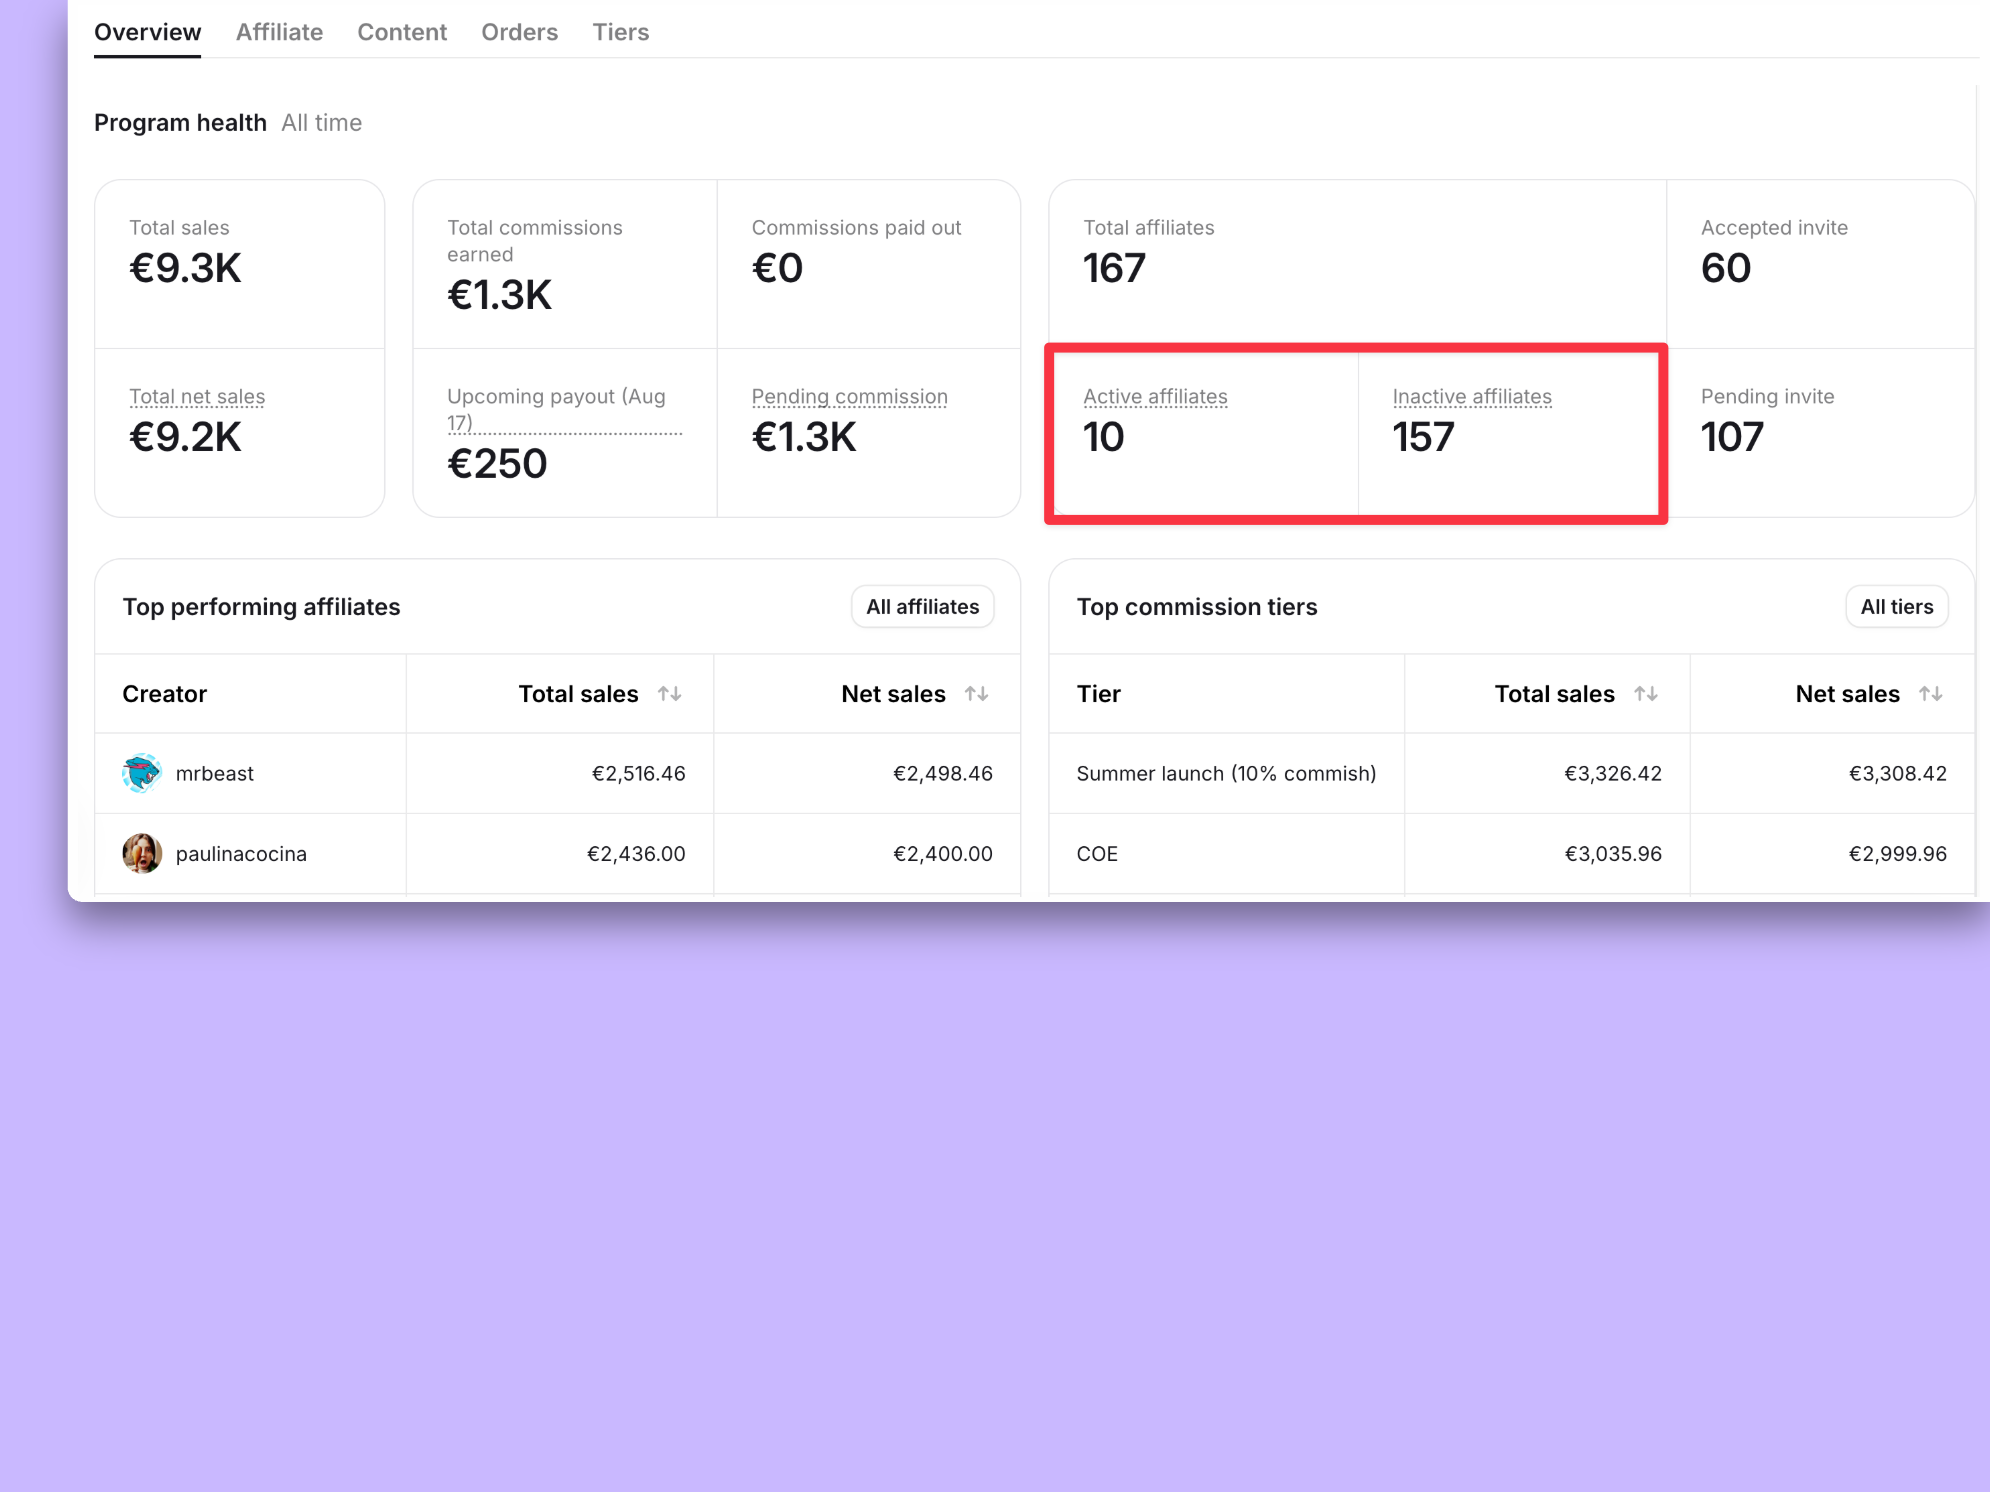
But if you want "active" to mean something closer to conversions, Modash's affiliate hub takes a stricter, revenue-based definition: an affiliate counts as active if they've driven at least one order in the selected period. It shows your total active vs. inactive affiliates at a glance, and you can filter your list by either.
Revenue per affiliate is the total revenue generated by each individual affiliate, usually looked at across your whole roster to see how it's distributed.
You get the number by dividing attributed revenue by each affiliate.
This metric helps you decide whether your revenue is healthily spread across your roster, or resting on two or three people who could walk away (or sign an exclusive with a competitor) at any moment. For example, a program pulling in $50,000 a month sounds great, right up until you find out 90% of it came from a single creator. As Melissa Sorby suggests:
It's important not to become too reliant on a handful of top performers because things can change quickly if they sign an exclusive partnership, start working more closely with a competitor, or become less active.

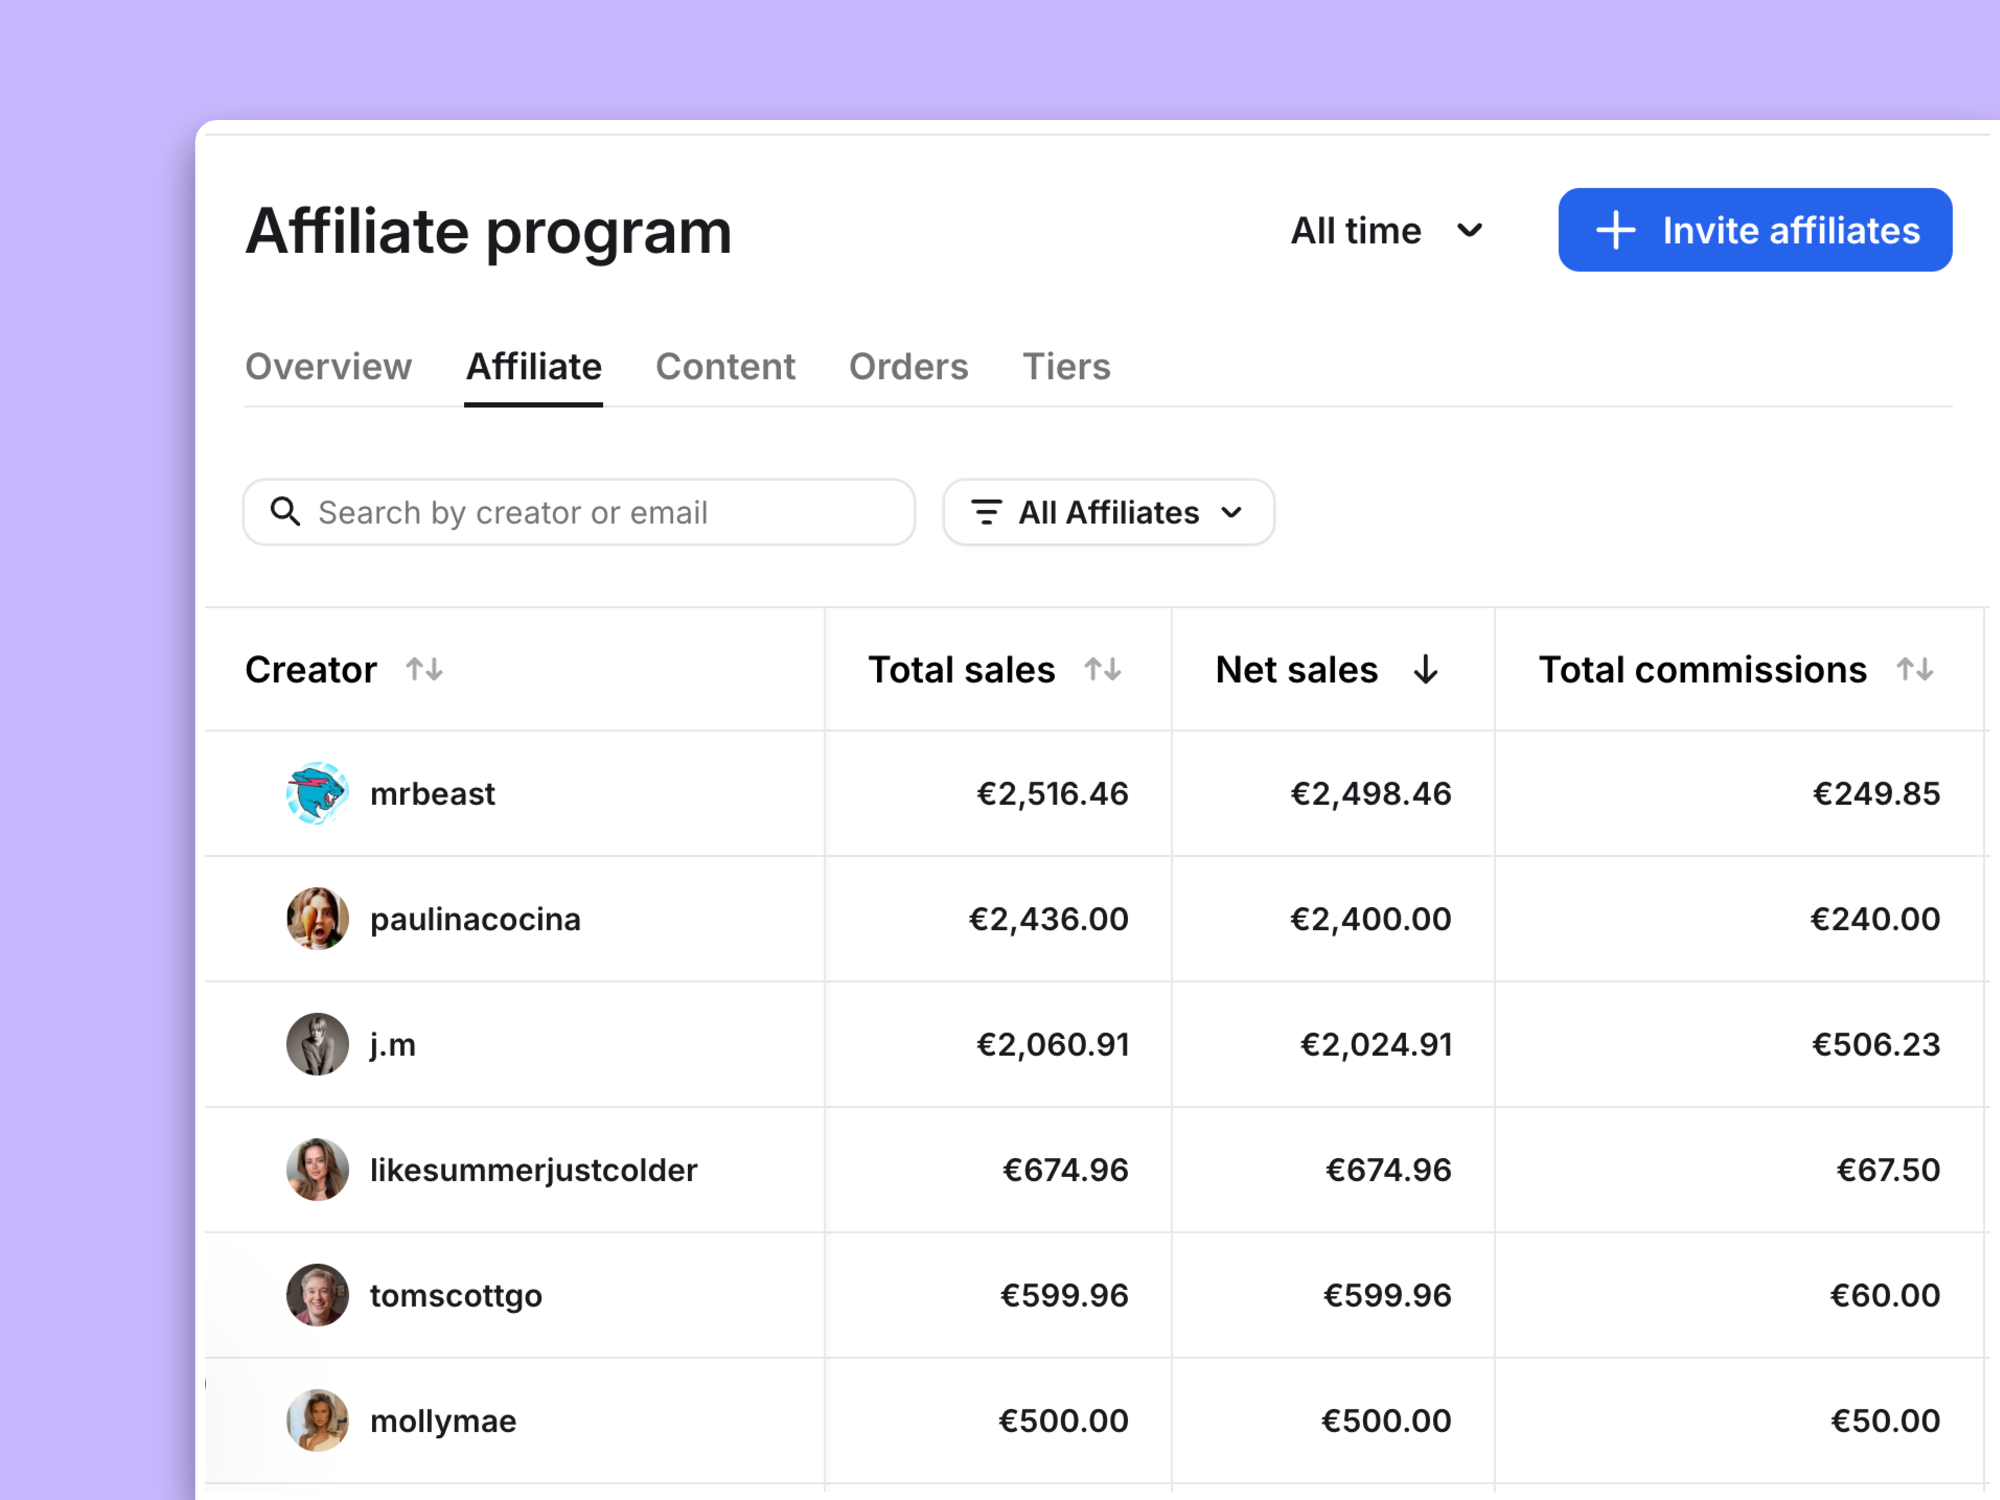
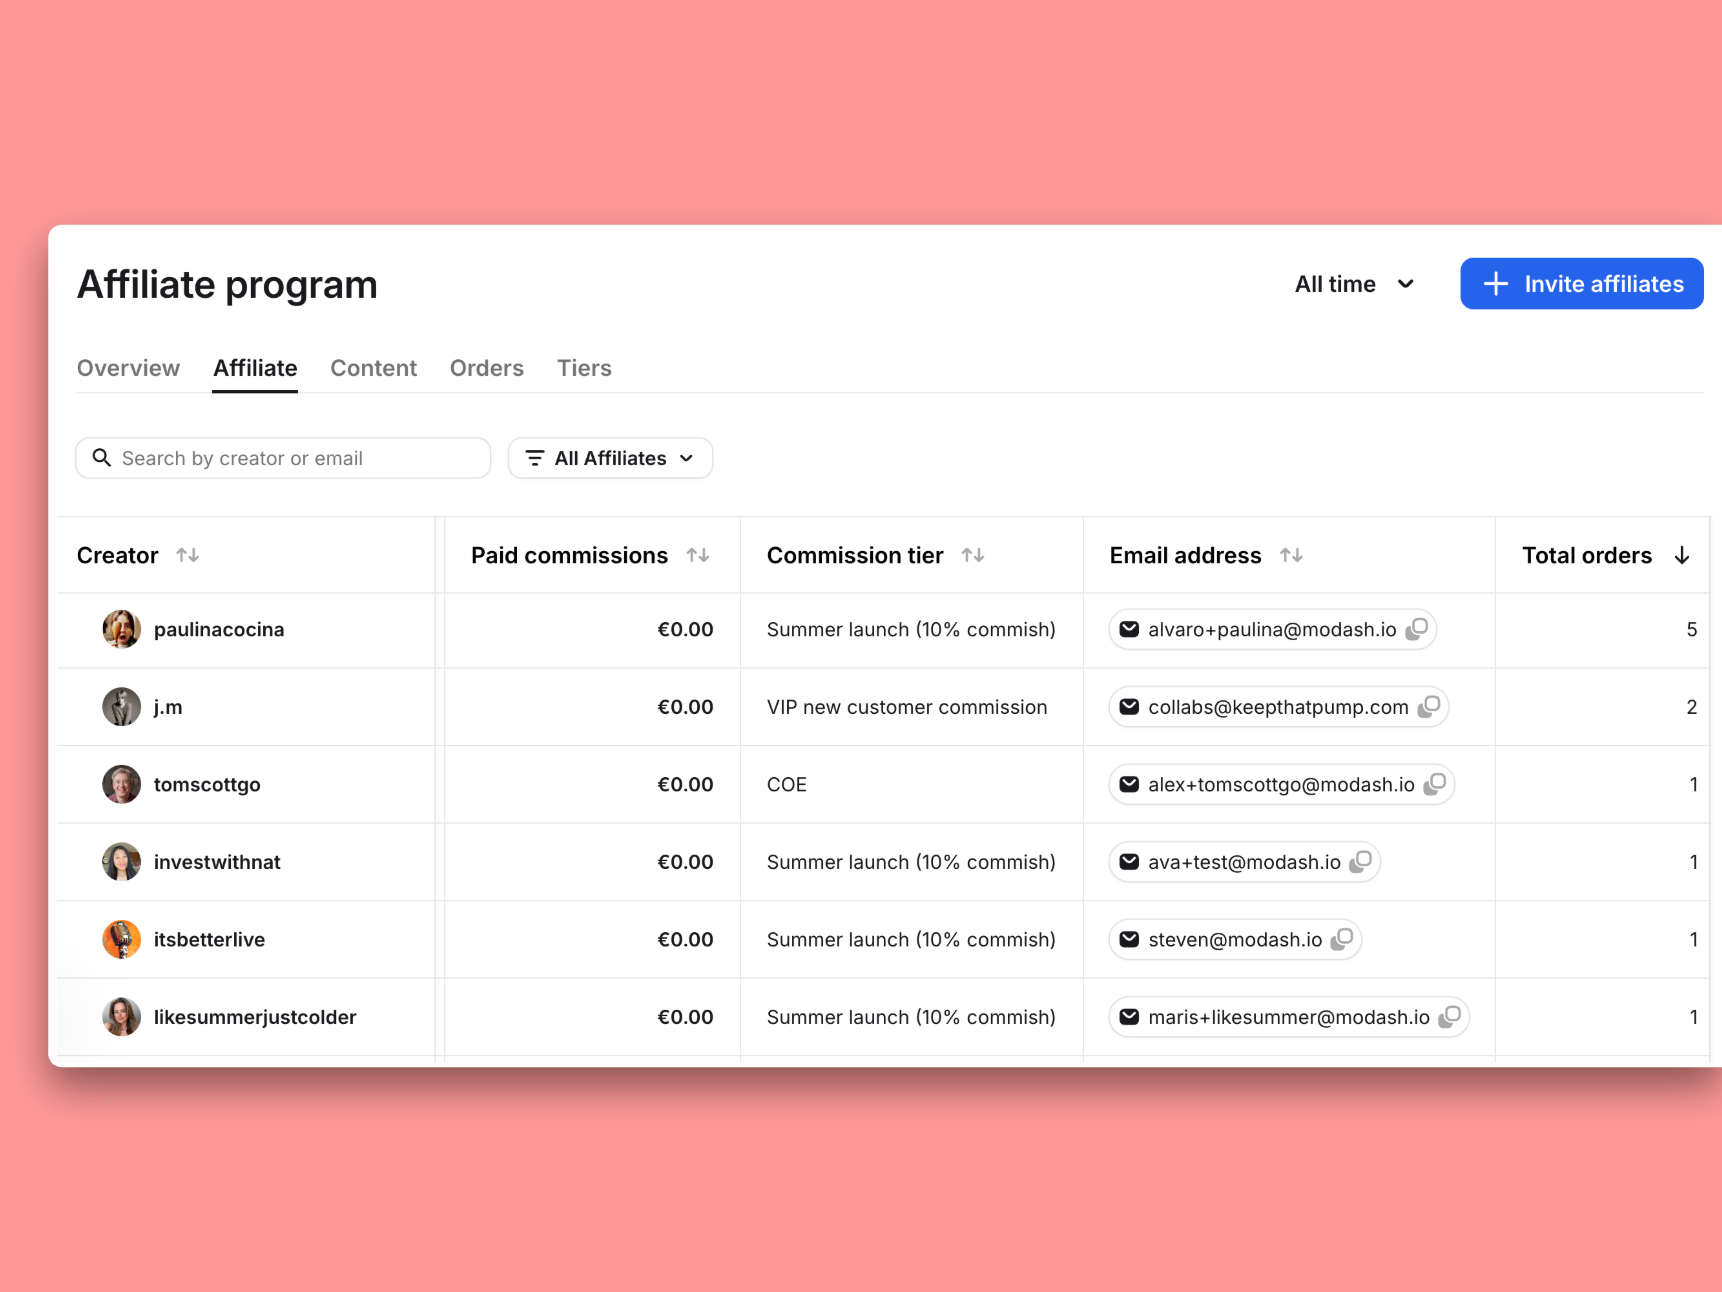
Modash makes this easy to spot without building a pivot table yourself. The revenue-per-creator shows concentration at a glance, and you can also check each affiliate's last piece of content to see how often they're actually posting. This is useful context for whether a top earner is still active or coasting on an old campaign.
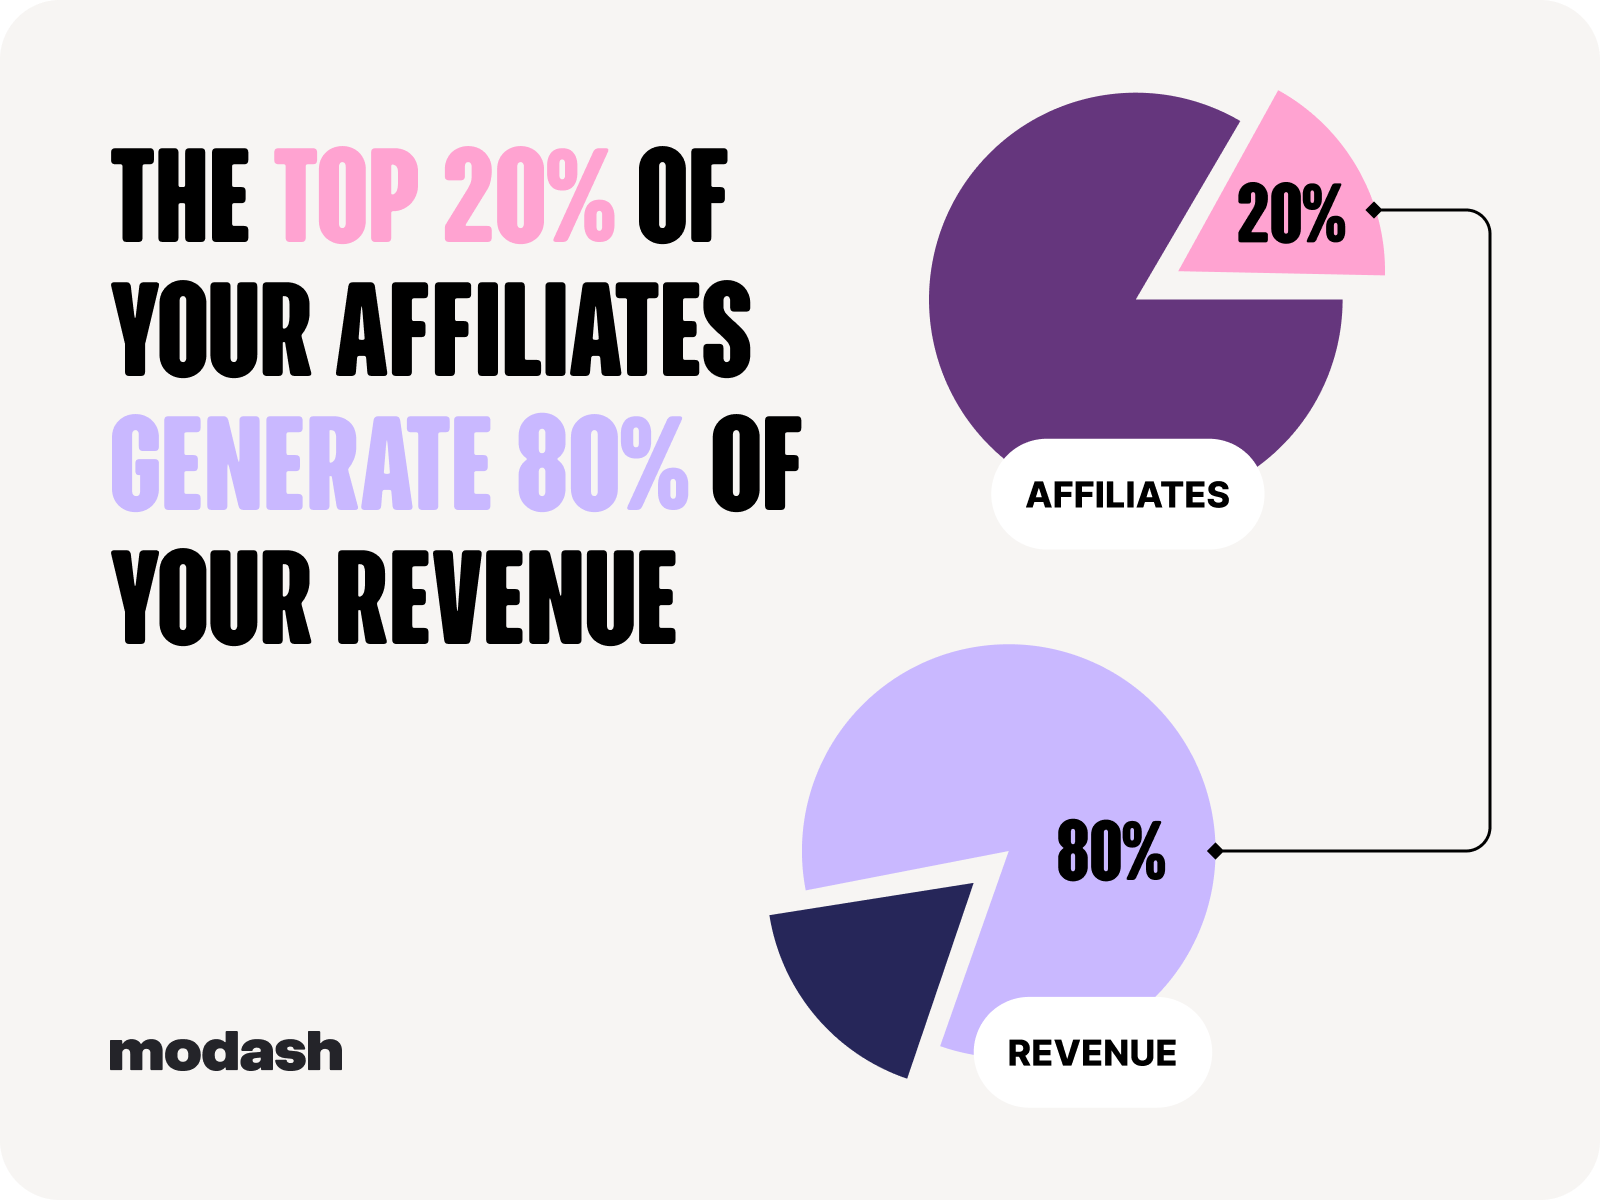
This concentration problem isn't rare, either. It lines up with what's often called the 80/20 rule, where most affiliate programs really do get the bulk of their revenue from a small slice of affiliates.
Effective commission cost tells you what your affiliate program is really costing you, once refunds and discounts have taken their bite out of the top line.
You calculate it by dividing total commissions paid by net attributed revenue.
This tells you whether affiliate marketing is actually as lean a channel as it looks on paper, or whether that’s only true before refunds and discounts get factored in.
Commission should be calculated on the discounted price the customer paid, not the original sticker price. So a $100 product with a 15% customer discount and a 10% affiliate commission doesn't cost you $10 in commission, it costs you $8.50, because the commission is 10% of the $85 the customer actually paid.
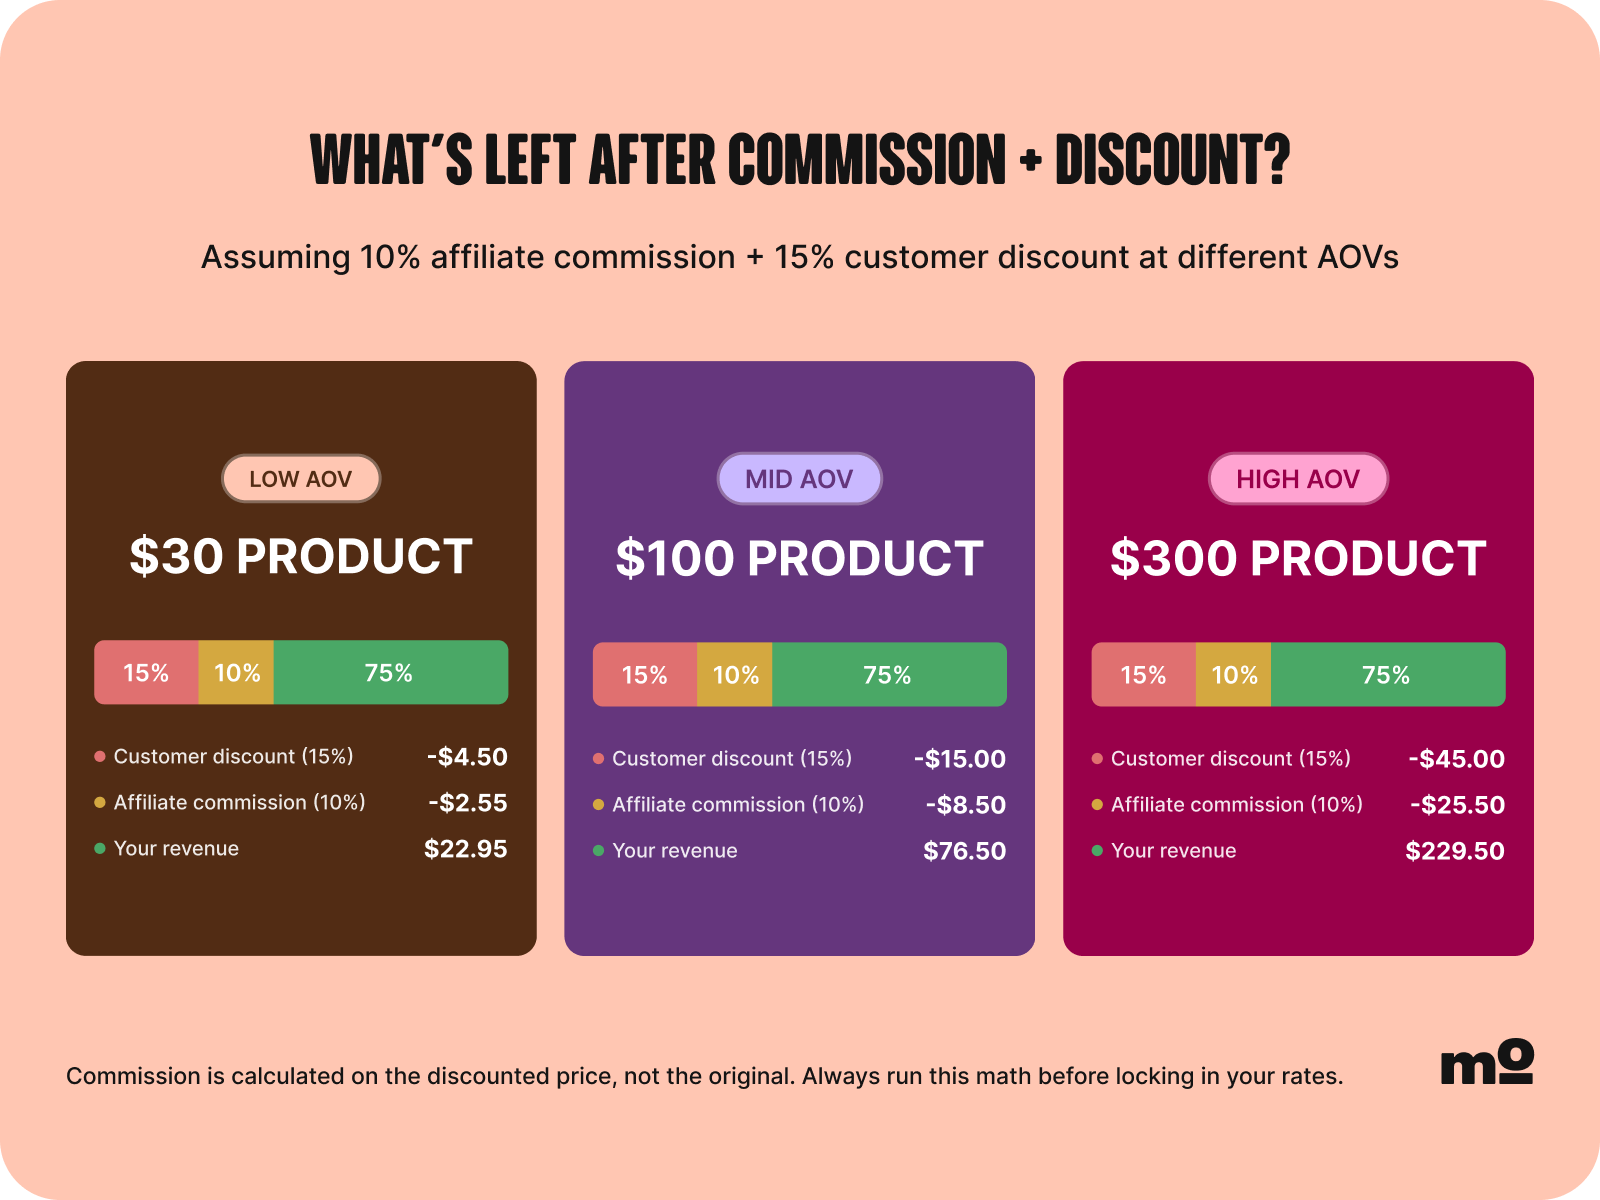
Gifting adds another layer here, too. Most brands aren't just paying commission, they're also sending free products. If you're tracking effective commission cost seriously, it's worth knowing how often you're gifting on top of paying out, since that gives you a better picture of what you’re spending to keep affiliates active.
Conversion rate is the percentage of clicks that turn into a sale. EPC (earnings per click) takes it a step further and tells you the average revenue generated per click, per creator, or per link.
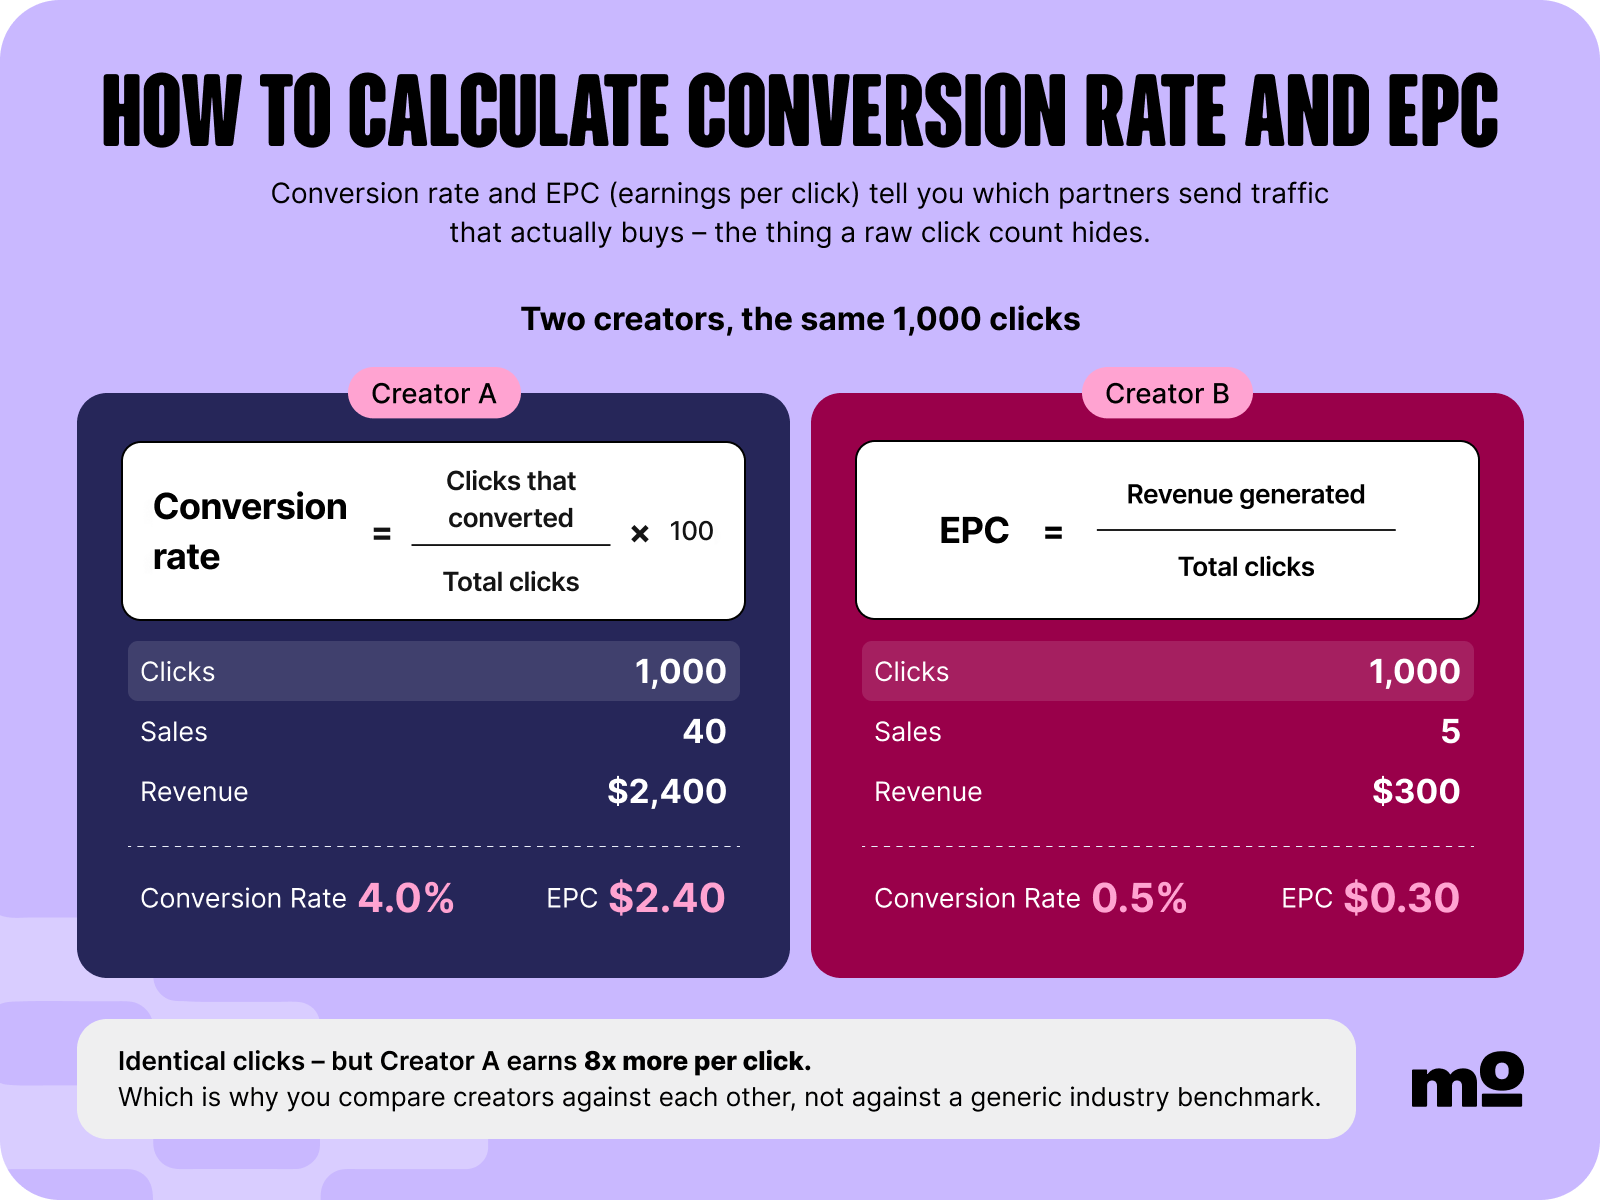
Conversion rate is clicks that converted ÷ total clicks; EPC is revenue generated ÷ total clicks.
Together, these two metrics tell you which partners are sending traffic that buys.
The mistake to avoid here is judging performance on click volume alone. Two creators can send you the exact same number of clicks and get wildly different results, like one converting at 4% and the other at 0.5%. The click count won't tell you why that gap exists, but conversion rate and EPC will.
Note that click and conversion numbers often understate reality the bigger you get. iOS cookie-blocking and cross-device journeys mean a chunk of conversions never get tied back to the click.
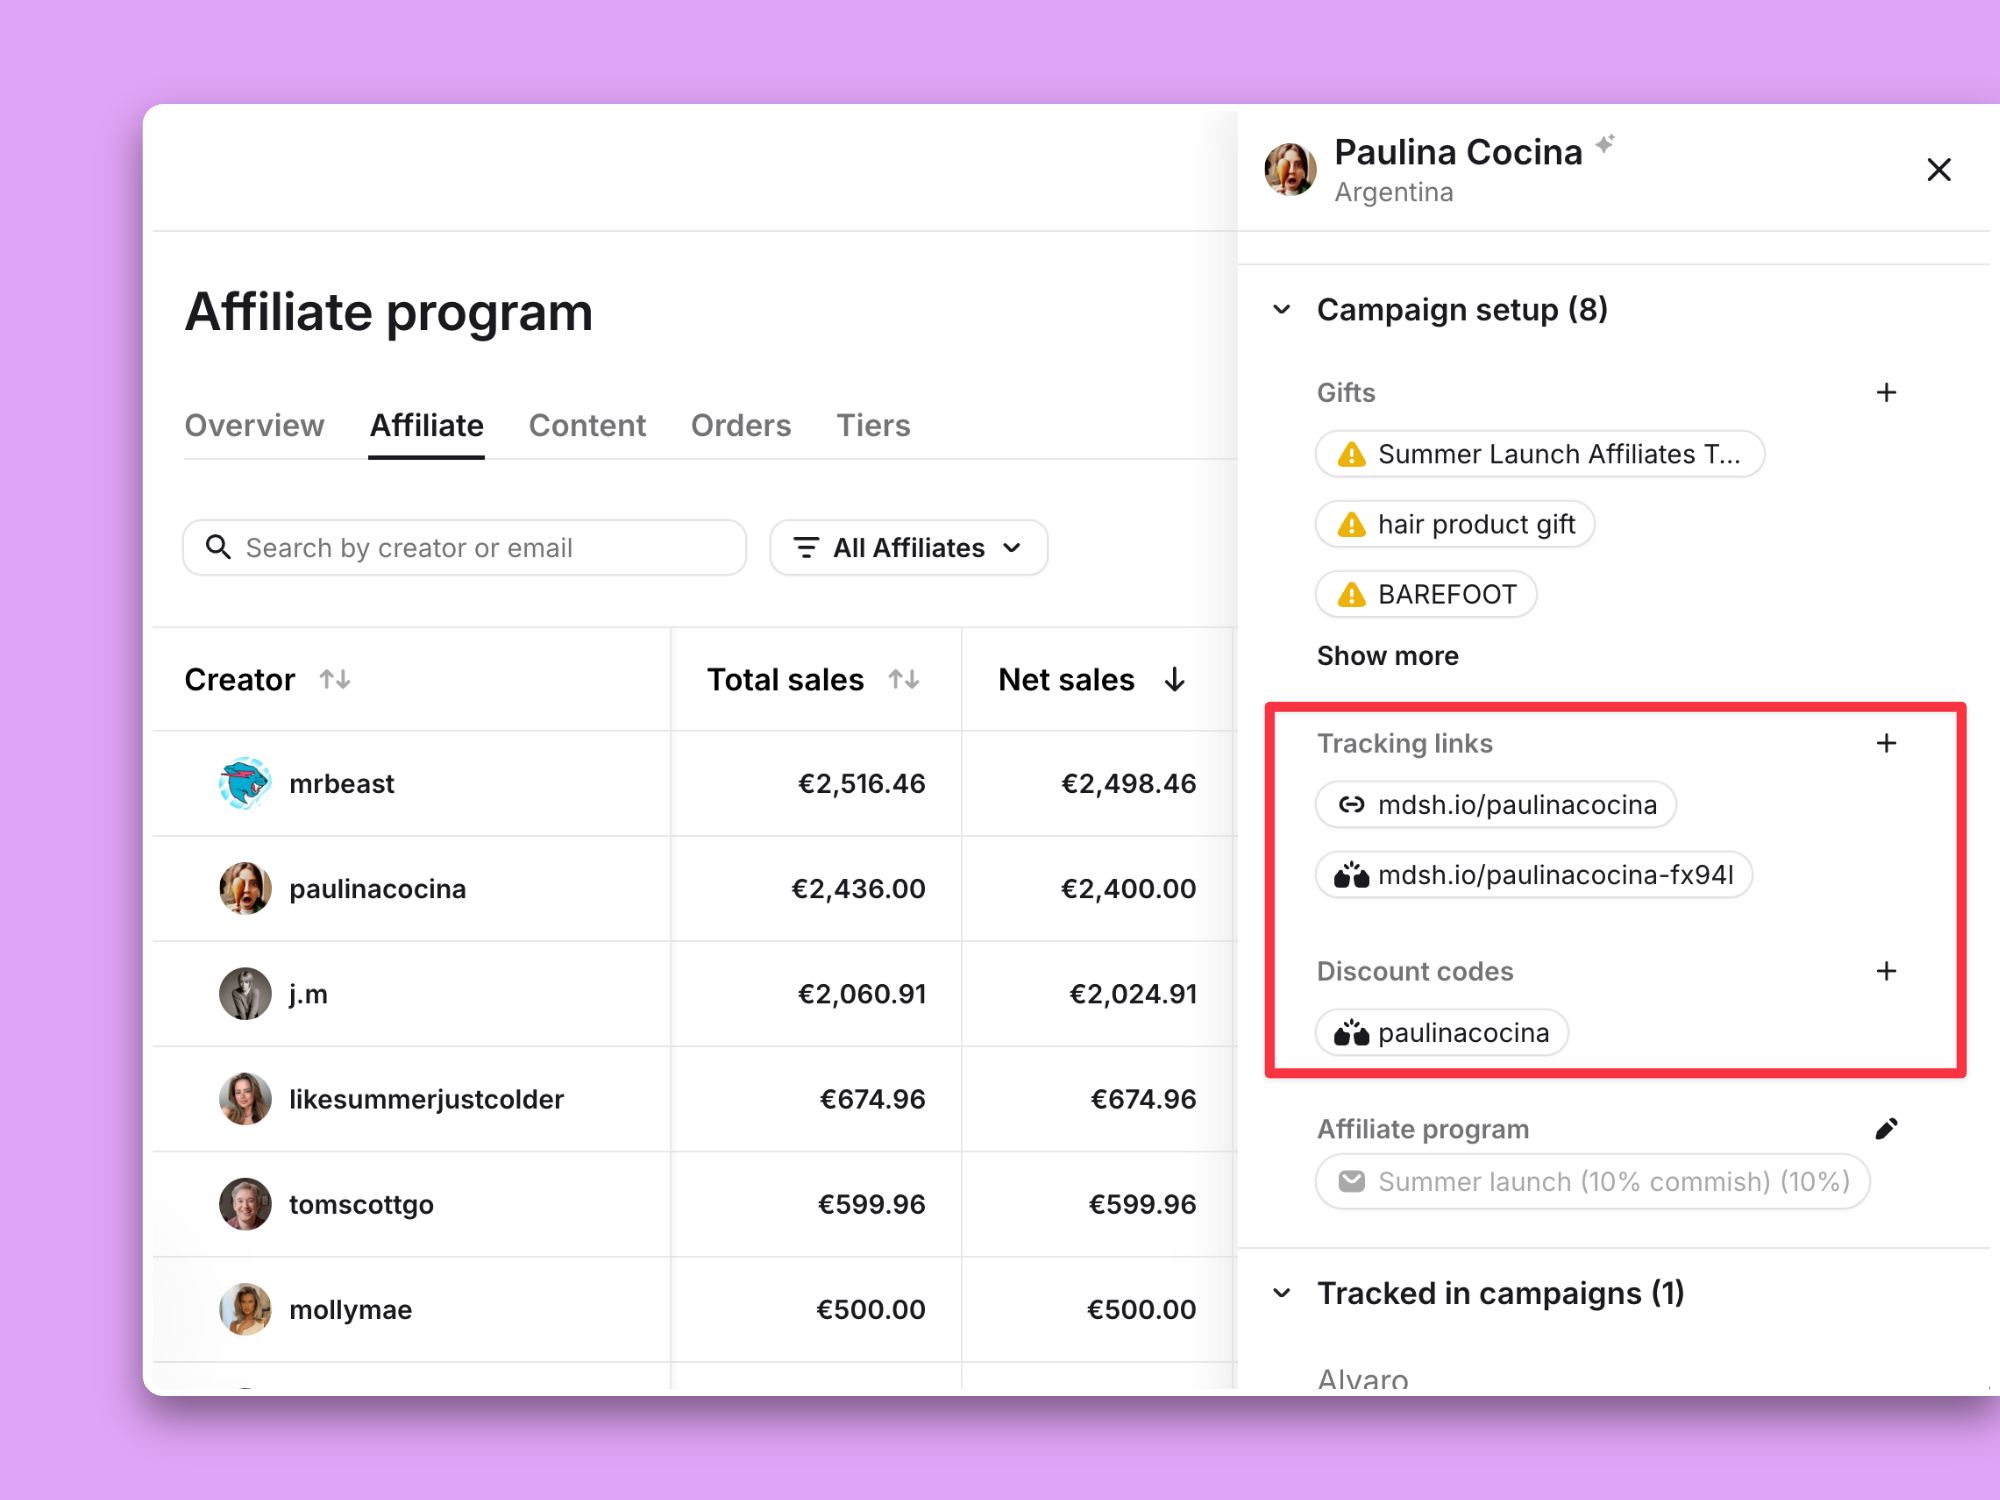
You can't fully fix this, but you can blunt it – give every creator both a tracking link and a discount code so sales still land somewhere when the click goes missing, and treat conversion rates as directional, best for comparing creators against each other rather than as exact numbers.
There's also a related but separate issue in that nearly half of marketers (47.6%) say code poaching is a problem for their program. When a creator's code leaks onto a coupon site, you can end up with a flood of redemptions that have absolutely nothing to do with that creator's influence, which distorts EPC in the other direction, making a partner look more effective than they are.
If a partner's redemptions look inflated next to their actual reach, that's the flag to check – the fix (rotating codes, leaning on tracking links) is a whole topic on its own, covered in this guide to prevent affiliate abuse.
AOV from affiliate-attributed orders is the average amount customers spend per order that's tied back to an affiliate. You calculate it by dividing total affiliate-attributed revenue by the number of affiliate-attributed orders.
The decision this drives is about order quality. A partner sending you five orders at $150 each is doing more for the business than one sending ten orders at $30 each, even though the second one looks busier on a clicks or conversions report.
Modash gives you per-creator revenue and total order data, so you can pull AOV for each affiliate by dividing their attributed revenue by their attributed orders. You can also see all orders in your affiliate program by different creators in a time period.
This metric splits affiliate-attributed orders into two buckets:
You calculate it by tagging each attributed order against your existing customer base, then looking at what share falls into each group.
This metric helps you understand what you're actually paying for. Are your affiliates bringing you new customers, or are they mostly collecting commission on people who already buy from you and would've come back anyway? Both are valuable, but they give you different insights.
You don’t want to end up paying full acquisition-level commission on a sale that was never really an acquisition. This ties back to the code-poaching problem from earlier, too. Some of what looks like "new" affiliate revenue is really just existing customers who came across a leaked code.
To be clear, this isn't about punishing affiliates whose audience is loyal and buys again and again, because hey, that's pretty valuable and worth rewarding in its own right. It’s more about knowing which is which, so you're not paying top-tier acquisition rates for what's actually retention.
Incremental revenue is the sales an affiliate caused, as opposed to attributed revenue, which is the sales that got tagged to them.
These two numbers are rarely the same. Sometimes the attributed revenue is too high, sometimes it's too low:
This is the halo effect we flagged in the intro. It's also exactly why no attribution model will ever give you a perfectly accurate incremental revenue figure. The closest you can get is triangulating with a few extra signals, like asking how someone heard about you at checkout, watching branded search volume for spikes around creator activity, or running a brand awareness survey.

Clicks are the number of people who clicked an affiliate's link. Code redemptions are the number of times an affiliate's discount code got used at checkout. Both are counted as raw totals over whatever period you're reporting on.
Note that these two figures aren't really success metrics, they're more inputs. Clicks and redemptions are useful as a pulse-check (e.g. is this creator generating any activity at all?) and they're the denominator you need to calculate EPC and conversion rate. But on their own, they don't tell you whether any of that activity mattered. Raw activity isn't the same thing as value, so don’t mistake a busy-looking dashboard for a productive one.
A spike in clicks or redemptions with no matching spike in revenue can be the first sign of a code-poaching problem. So, if the numbers go up but nothing downstream changes, you might need to dig a bit deeper.
Modash shows each creator's clicks and code redemptions in the same place, so if redemptions jump while clicks and posts stay flat, it's easy to notice.
Follower count is obviously the size of a creator's audience. Likes are how many likes an affiliate post gets. Gross merchandise value (GMV) is the total value of affiliate-attributed orders before anything gets taken off.
All three get labeled as "vanity metrics" because they're the easiest numbers to pull, so they tend to end up front and center on a dashboard regardless of whether they mean anything.
Gross GMV runs into the same problem as affiliate-attributed revenue: it's the bigger, better-looking number because nothing's been subtracted yet. On its own, it makes your program look good without telling you anything about what you actually made.
Follower count and likes are a little more nuanced, though. They're not worthless, but they’re pretty incomplete when you look at them on their own. Used in isolation, follower count says nothing about whether an audience is real, active, or anywhere close to your customer base. And likes are about as low-effort as engagement gets, so they don't tell you whether anyone trusts the recommendation enough to act on it.
But paired with the metrics above, both can become useful signals. Here are some scenarios where they can be helpful:
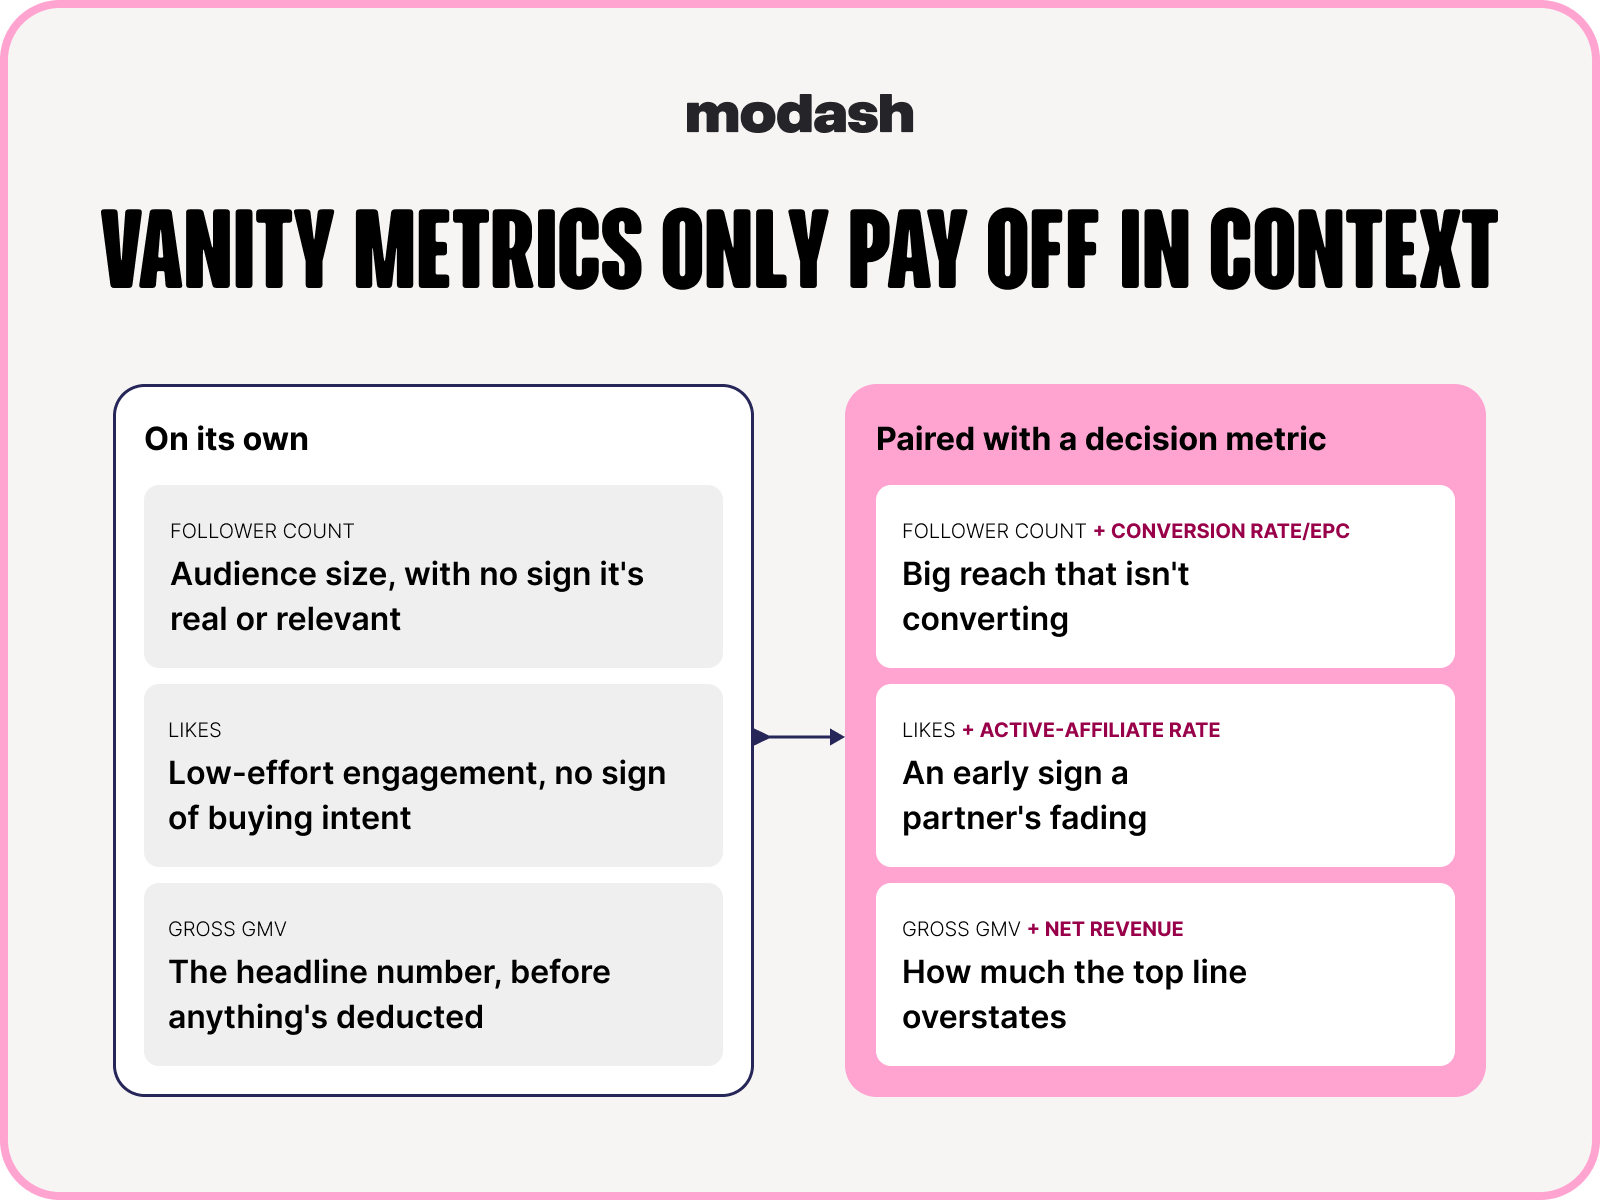
You don't need all 10 of these every week. Pick the 2 or 3 that map to the decision in front of you right now – sorting out who to pay more is a revenue-per-affiliate and AOV question, diagnosing a quiet program is an active-rate one – and leave the rest until they're relevant.
That's a lot easier when the numbers aren't scattered. Modash pulls clicks, redemptions, revenue, and commissions together per creator, so the 2 or 3 you care about this week are already in front of you instead of spread across Shopify, a spreadsheet, and your socials.
Take a 14-day free trial of Modash today and see how easy the numbers are to gather yourself.
The most important metrics are the ones that tell you what to do next. That said, affiliate-attributed revenue (net, not gross) and active-affiliate rate are usually the strongest starting point, since they answer the two biggest questions: is the program making money, and are your affiliates actually doing anything? Everything else, like AOV, EPC, and conversion rate, helps you fine-tune from there.
Metrics are just numbers you can measure, like clicks, likes, revenue, and follower count. KPIs are the handful of metrics you've decided matter for your program's goals. Basically, every KPI is a metric, but not every metric deserves to be a KPI.
There's no universal benchmark, but a good starting point is clearing 20%. Our survey found that over a third of programs come in below that. The more hands-on you are with your affiliates (regular communication, fresh products, tiered commissions), the higher this number tends to climb.
Honestly, there's no clean formula here. "Return" is murky (does it include margin? incremental sales only?) and "investment" is just as slippery, since a creator's impact can show up months after you paid them. Most marketers get further tracking net revenue, effective commission cost, and incremental revenue separately, rather than forcing everything into one ROI number.
Shopify shows you sales by discount code and referral source out of the box, which is fine for a rough overview. But it doesn't tie codes and referrals together per affiliate, so once you've got more than a handful of partners, you're stuck manually cross-referencing everything.