


More tools
Use cases



Influencer content doesn’t always have to sell something. At least, not directly.
What it can do instead is get people to stop scrolling, save, share, and comment. In other words, it gets attention.
And if you’re paying for attention, it’s worth paying attention to what each bit of it costs you 👀
Enter cost per engagement (CPE), the simplest way to compare which creators get you the most bang for your buck when it comes to making their audience live, laugh, love… sorry, like, comment, and share.
But there’s a catch (there always is).
CPE relies heavily on what you count as “engagement” and whether engagement is even your goal in the first place. The stakes are high if you get it wrong, because you could end up rebooking a creator who looked nice and affordable on paper but did absolutely nothing for you (gasp!).
In this article, I’ll show you how to calculate CPE so you can compare it across creators, and when to ditch it for CPM or CPA instead.
Let’s get into it…
CPE is the average amount you pay for each engagement a creator’s content generates. That means each like, comment, share, or save.
It tells you how much interaction a creator gets you for every dollar you spend, and it’s pretty handy for comparing creators against each other.
CPE = total cost ÷ total engagements
Say you spent $1,500 to partner with a creator for an Instagram Reel and it gets 3,000 likes and 400 comments. That’s 3,400 engagements in total, so the math would be:
$1,500 ÷ 3,400 = $0.44 per engagement
Easy peasy, right?
Just remember to count everything it cost you to get that post live, including the creator fee, the price of the product, even the shipping if you gifted that, and any affiliate commission paid out on it.
To figure out how to set your creator fees in the first place, see our influencer pricing guide.
Just to muddy the waters a bit more, “engagement” doesn’t refer to one thing.
In fact, it can mean many different things on different platforms:
So, most tools count engagement differently depending on the platform.
Modash’s campaign analytics, for example, counts likes and comments on Instagram and YouTube, and likes, comments, shares, and saves on TikTok.
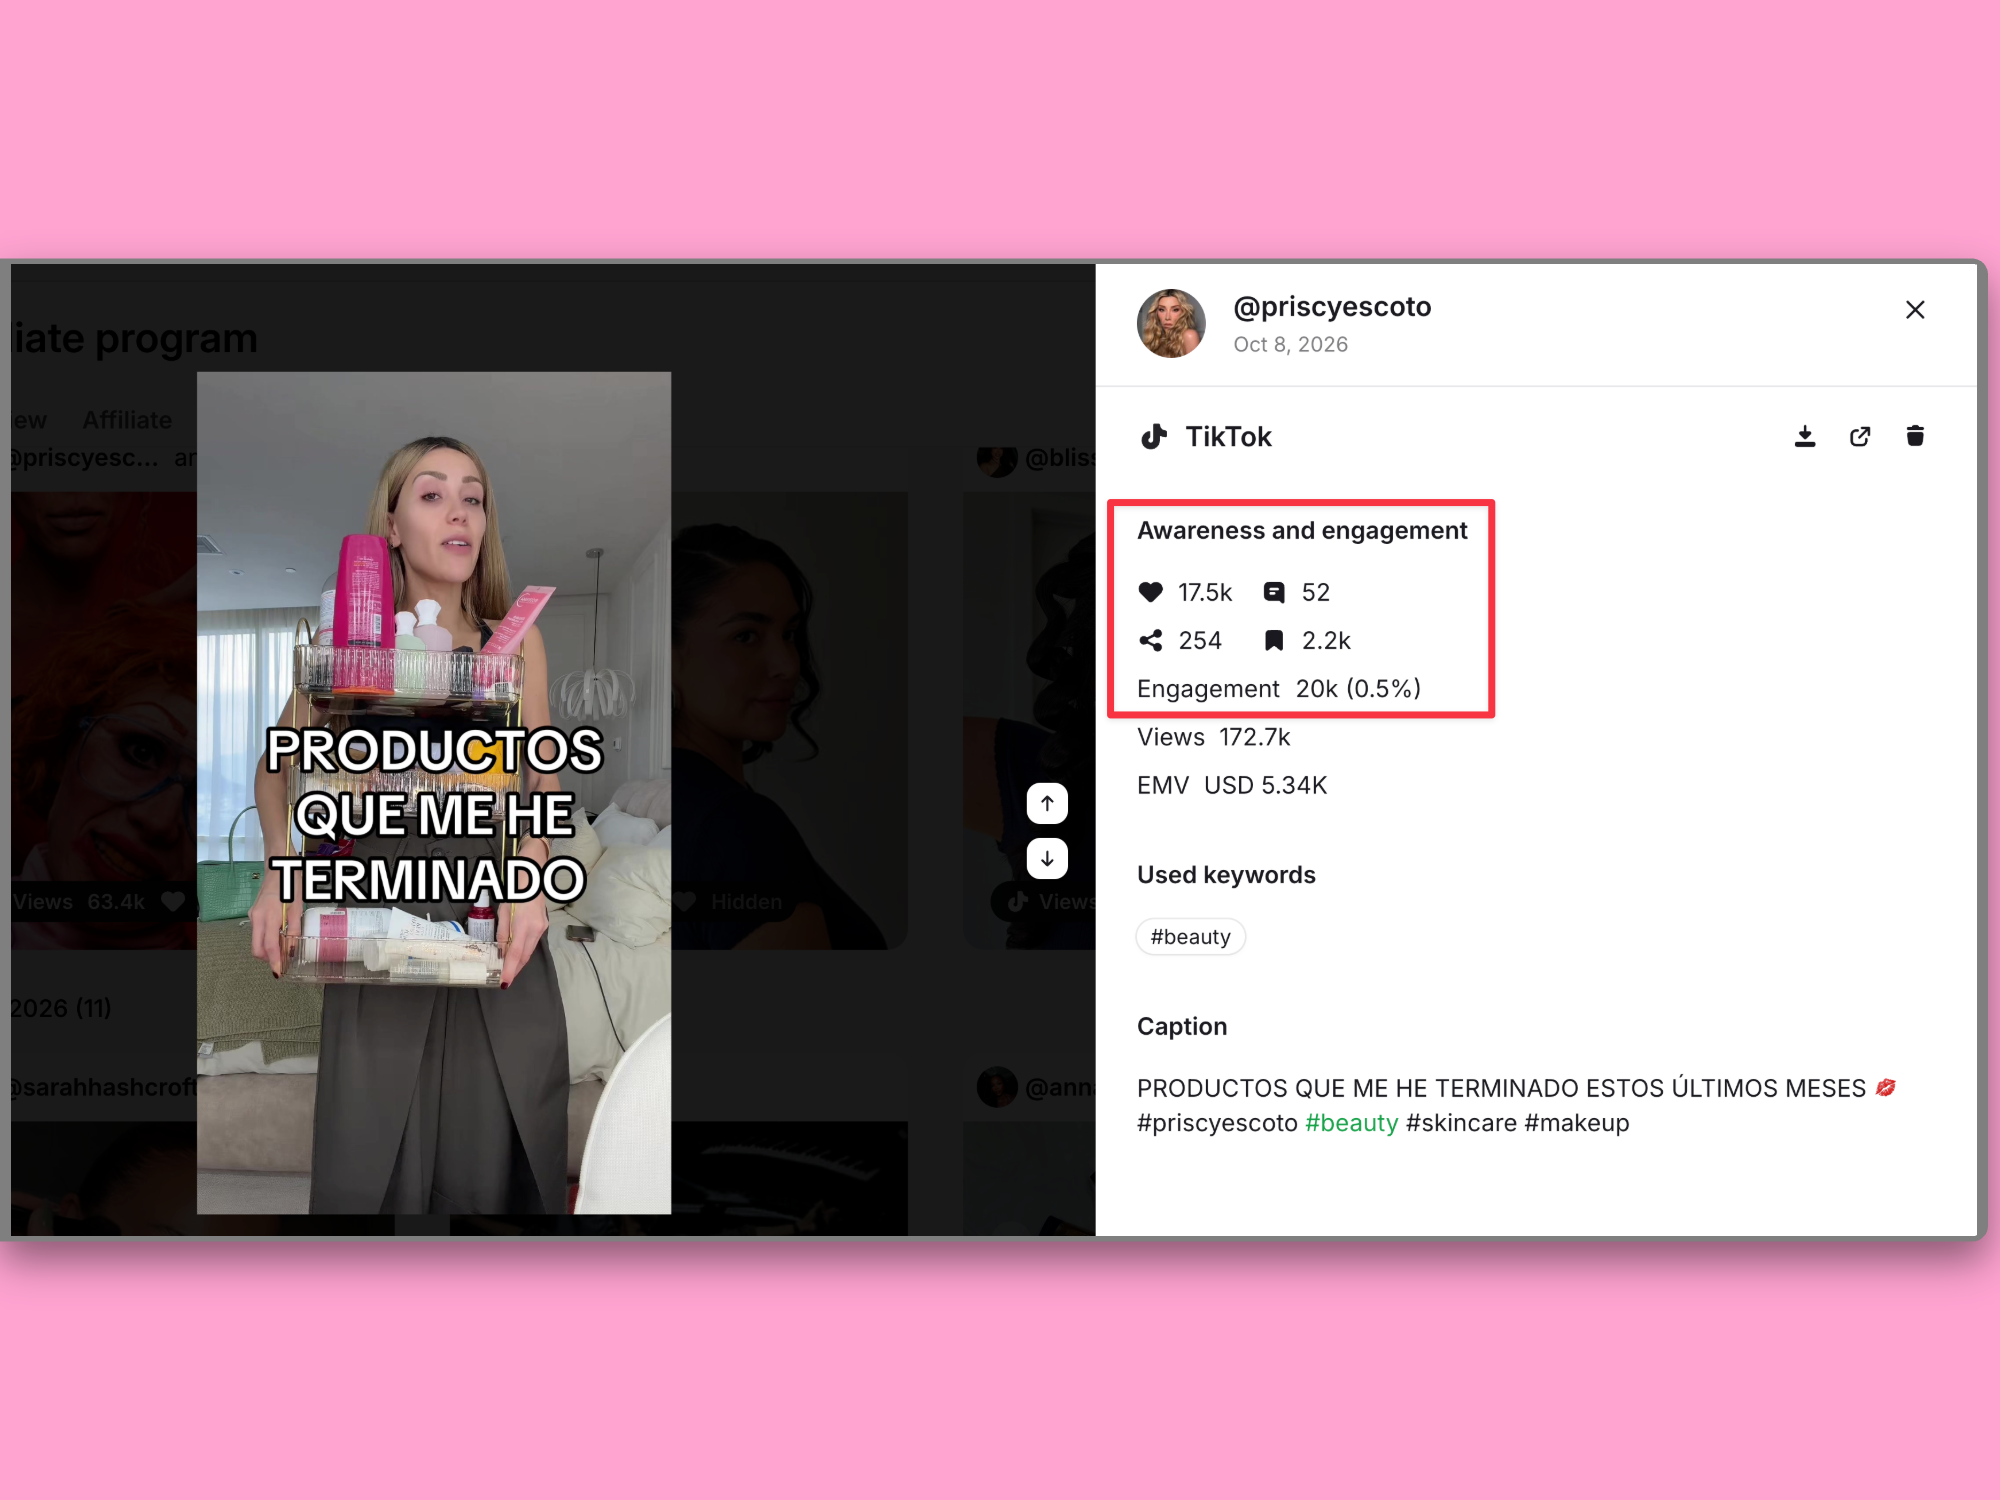
Let’s see what that does to your numbers. Say you spent the same $1,500 in total on a TikTok creator, and their video gets 2,800 likes, 250 comments, 900 shares, and 1,100 saves (big ol’ numbers).
If we:
Put those next to the Instagram Reel’s $0.44 and you get a different answer depending on how you count. With all four counted, the TikTok beats the Reel at $0.30. With only likes and comments, it loses at $0.49.
This is why it makes almost zero sense to pit TikTok and Instagram CPEs against each other.
Top tip: be choosy about what an “engagement” means to you too: is it everything including likes, comments, shares, saves, or is it just comments and saves? Something else?
Once you’ve picked your engagement lineup, don’t change it.
Also something else to be aware of here: if you’re manually tracking these numbers (which is totes fine if you’re dipping your toe in or a small operation), make sure everyone on your team is calculating engagement the same way.
If you’re using Modash, the tool applies the same formula to every creator on a platform, so your internal comparisons are always consistent.
So what do you do when you’ve chosen your engagement lineup and the numbers start rolling in? Let’s take a look at what info you can take from it.
The honest-to-god-truth is that there’s no reliable public benchmark. You’ll find numbers online (you can find anything online if you look hard enough), but they tend to mix platforms, niches, regions, and engagement definitions, so it’s all a bit… vague.
The comparisons that can help are:
Once you’ve got that, there’s a second caveat 🤓
A low CPE might look very nice because it tells you attention didn’t cost much, but it doesn’t tell you whether the attention was worth anything…
…and that’s because not all engagements are equal.
A comment section choc-full of heart-eye emojis costs the same per engagement as a thread of people asking where to buy your product. Only one of those is a decent indicator that the content has done its job. I don’t have to tell you which one.
Andreea Moise doesn’t rely on one signal. Alongside likes and comments, she also checks the ratio of saves and shares. Together, they give her a fuller picture of how a piece of content landed.
I started looking at the ratio of saves and shares in the past few years, and it has significantly reduced flops and poor performance on TikTok.

On their own, likes, comments, and even engagement rate can easily slip into vanity metric territory. They look good in a report, but without context they tell you zilch about whether someone trusts the recommendation.
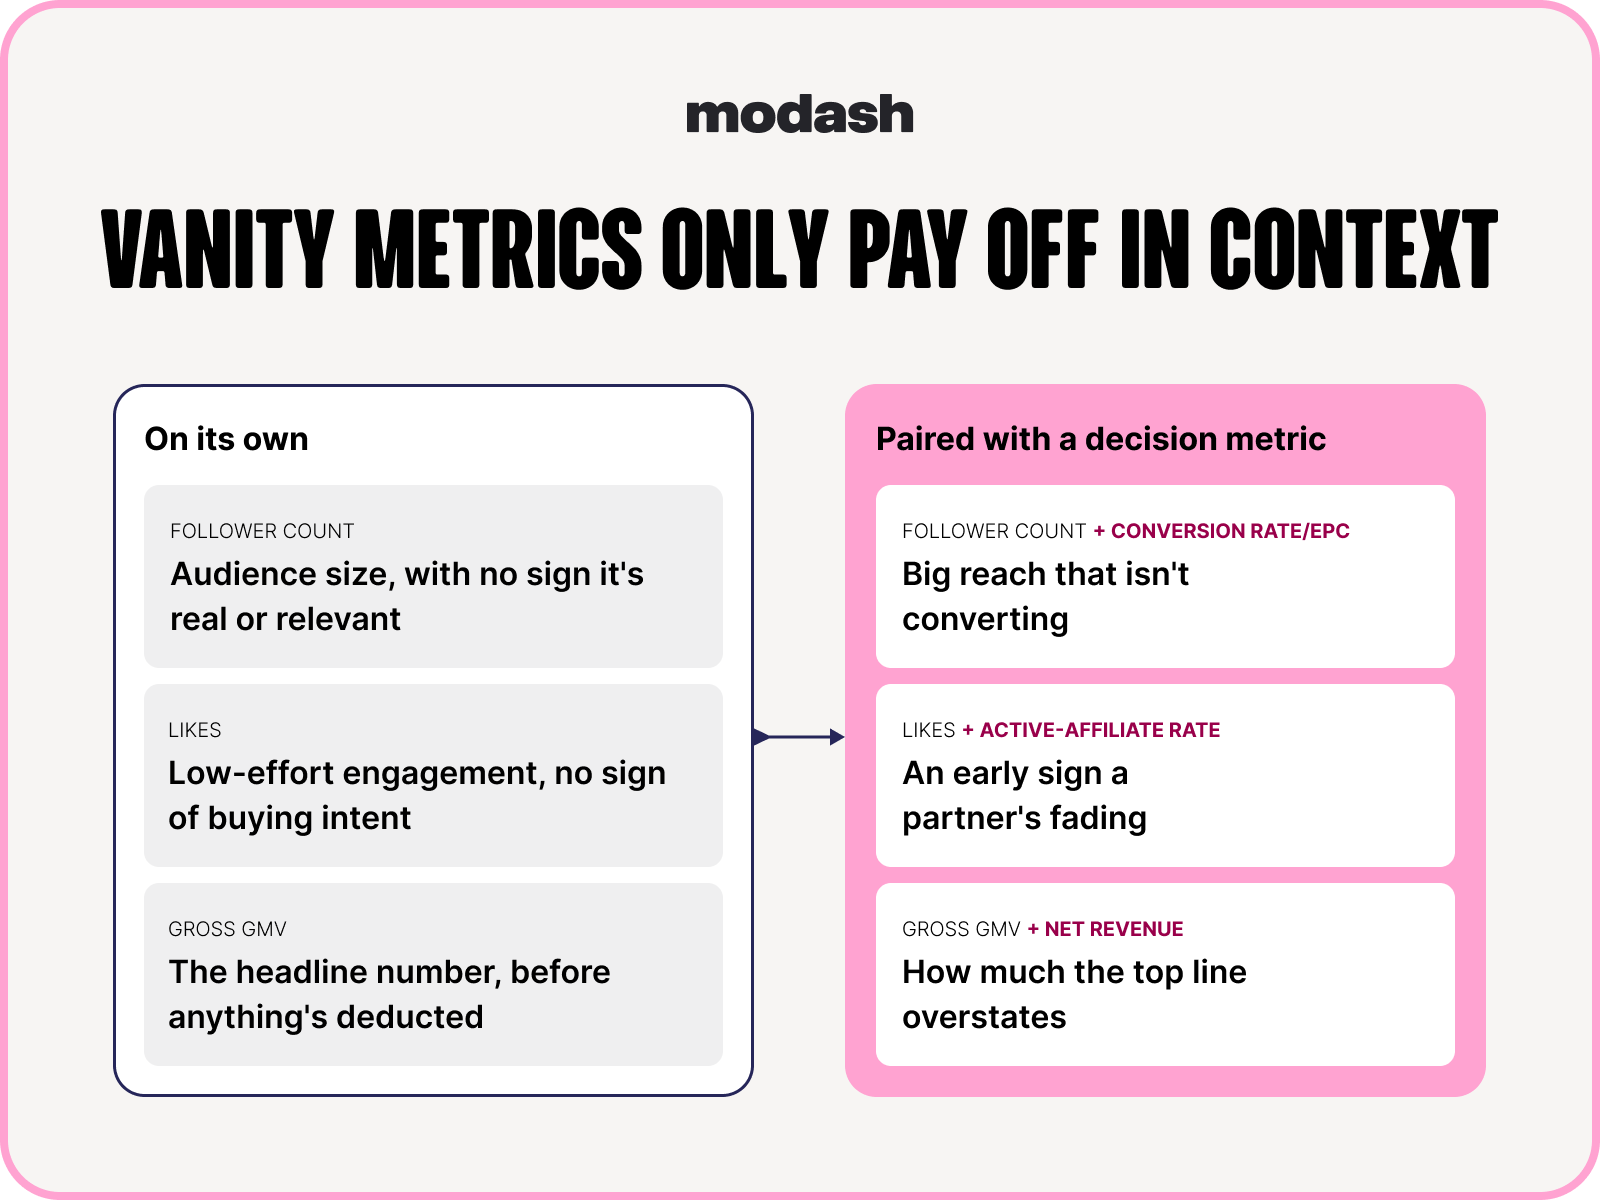
So pair your CPE with a quick quality check. Skim the comments, look at the saves-and-shares ratio where you get them (on platform or from creators), and be suspicious of a CPE that looks too good to be true.
Because CPE varies so wildly across platforms, we don’t recommend trying to compare your Instagram engagement with TikTok and vice versa.
Instead, you can use it to rank your creators by how much engagement they get for the money. When you’re comparing them in this way, keep it to one platform and one engagement set, so pit Instagram creators against other Instagram creators, and TikTok against TikTok.
Say your average TikTok CPE is $0.40 and your average Instagram CPE is $0.55:
Each creator is measured against their own platform, so the TikTok creator is a little further ahead of their peers than the Instagram creator.
You can absolutely do this by hand. If you’re a small brand, you can pull engagement counts from every post and match them to the dollars you’ve paid out to each creator.
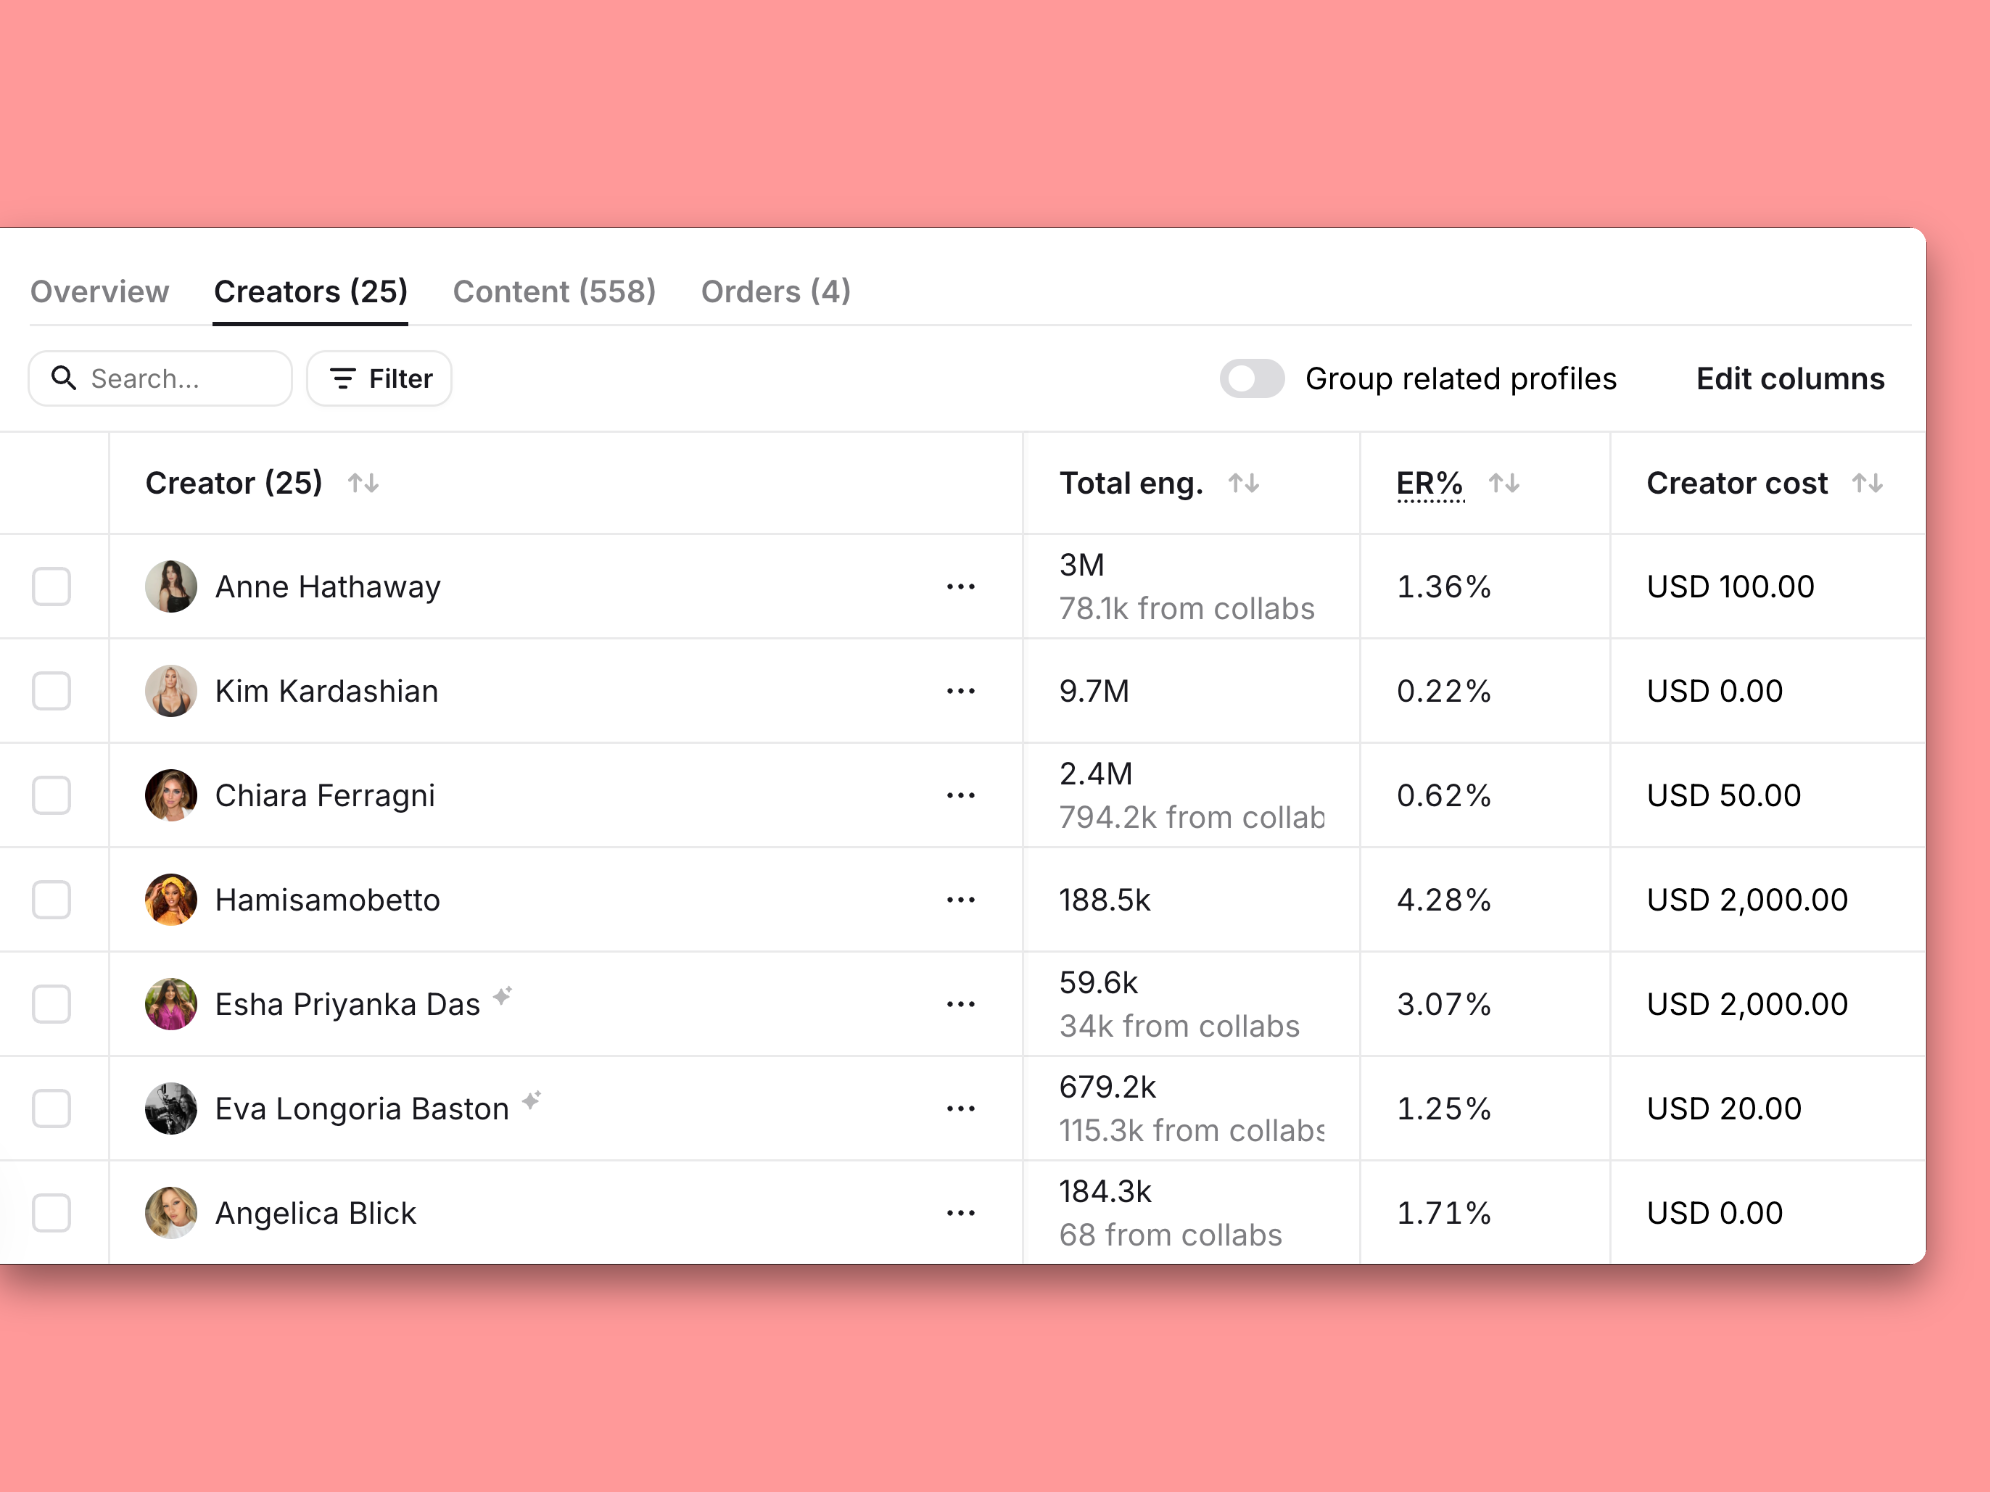
But just FYI, in case you don't fancy doing the math yourself, Modash campaign analytics breaks performance down by creator. Engagement per creator rubs shoulders with cost per creator (that’s manual costs and affiliate commissions).
I often like to think that each metric answers a specific question, like Cost Per Mille (CPM) answers how much I’m paying to get in front of 1,000 people and Cost Per Acquisition (CPA) answers how much I’m paying for each sale.
But what about CPE?
Well, it tells me how much I’m paying each time someone likes, comments, shares, or saves.
That makes it a good tool for:
What it’s not particularly good at is tracking sales, because whichever way you look at it, engagement doesn’t always mean a conversion.
It's not uncommon to have a creator whose CPE is the golden pinnacle of all CPEs, yet barely a sale shows up next to their name.
Sure, their audience adores them and engages with every post. But that doesn't mean they're ready to buy from you today. They might buy after seeing your product a few more times, when a discount code pops up in their feed, or simply when they need what you sell.
That creator is still pulling their weight, because they're building awareness that turns into sales down the line. It just won't show up in your dashboard as a neat little conversion.
Andreea puts it well:
Statistically, it's impossible to have 80% influencers that drive sales in your program. In reality, it's more like 10-20% that will perform and most of that performance will come from the cumulative effect too.
So a creator with an average CPE could still be doing plenty for you. Treat CPE as one input, and judge creators over more than a single campaign.
A good filter is: does this number change a decision? If you’re deciding which creator to rebook for an awareness push, CPE definitely does help you make a decision.
But if you’re deciding who to put more sales budget behind, you want CPA or ROAS.
Now we’re in a wormhole of metrics beginning with ‘C’, let’s take a deeper look at which one works best for what goal.
Try and say CPE, CPM, and CPA three times really quickly.
It’s tricky, but I digress. As metrics, they’re pretty close relatives. Each one tells you the cost of something:
These can be neatly mapped to three common goals: engagement, reach, and conversions.
Basically:
CPM is best when you want lots of people to see something, like a product launch or a new market. Read more about the benchmarks and limitations in our CPM guide.
CPA is best when the goal is sales. It's also a payment model, and many brands pay creators per sale through commission. Our CPA guide goes into more detail. For the tracking side of things, see our guide to affiliate reporting.
In practice, most programs use all three, and to confuse things even further (🤪) a creator can have an average CPE, a great CPM, and a strong CPA, so… CPE can be misleading if you look at it in isolation.
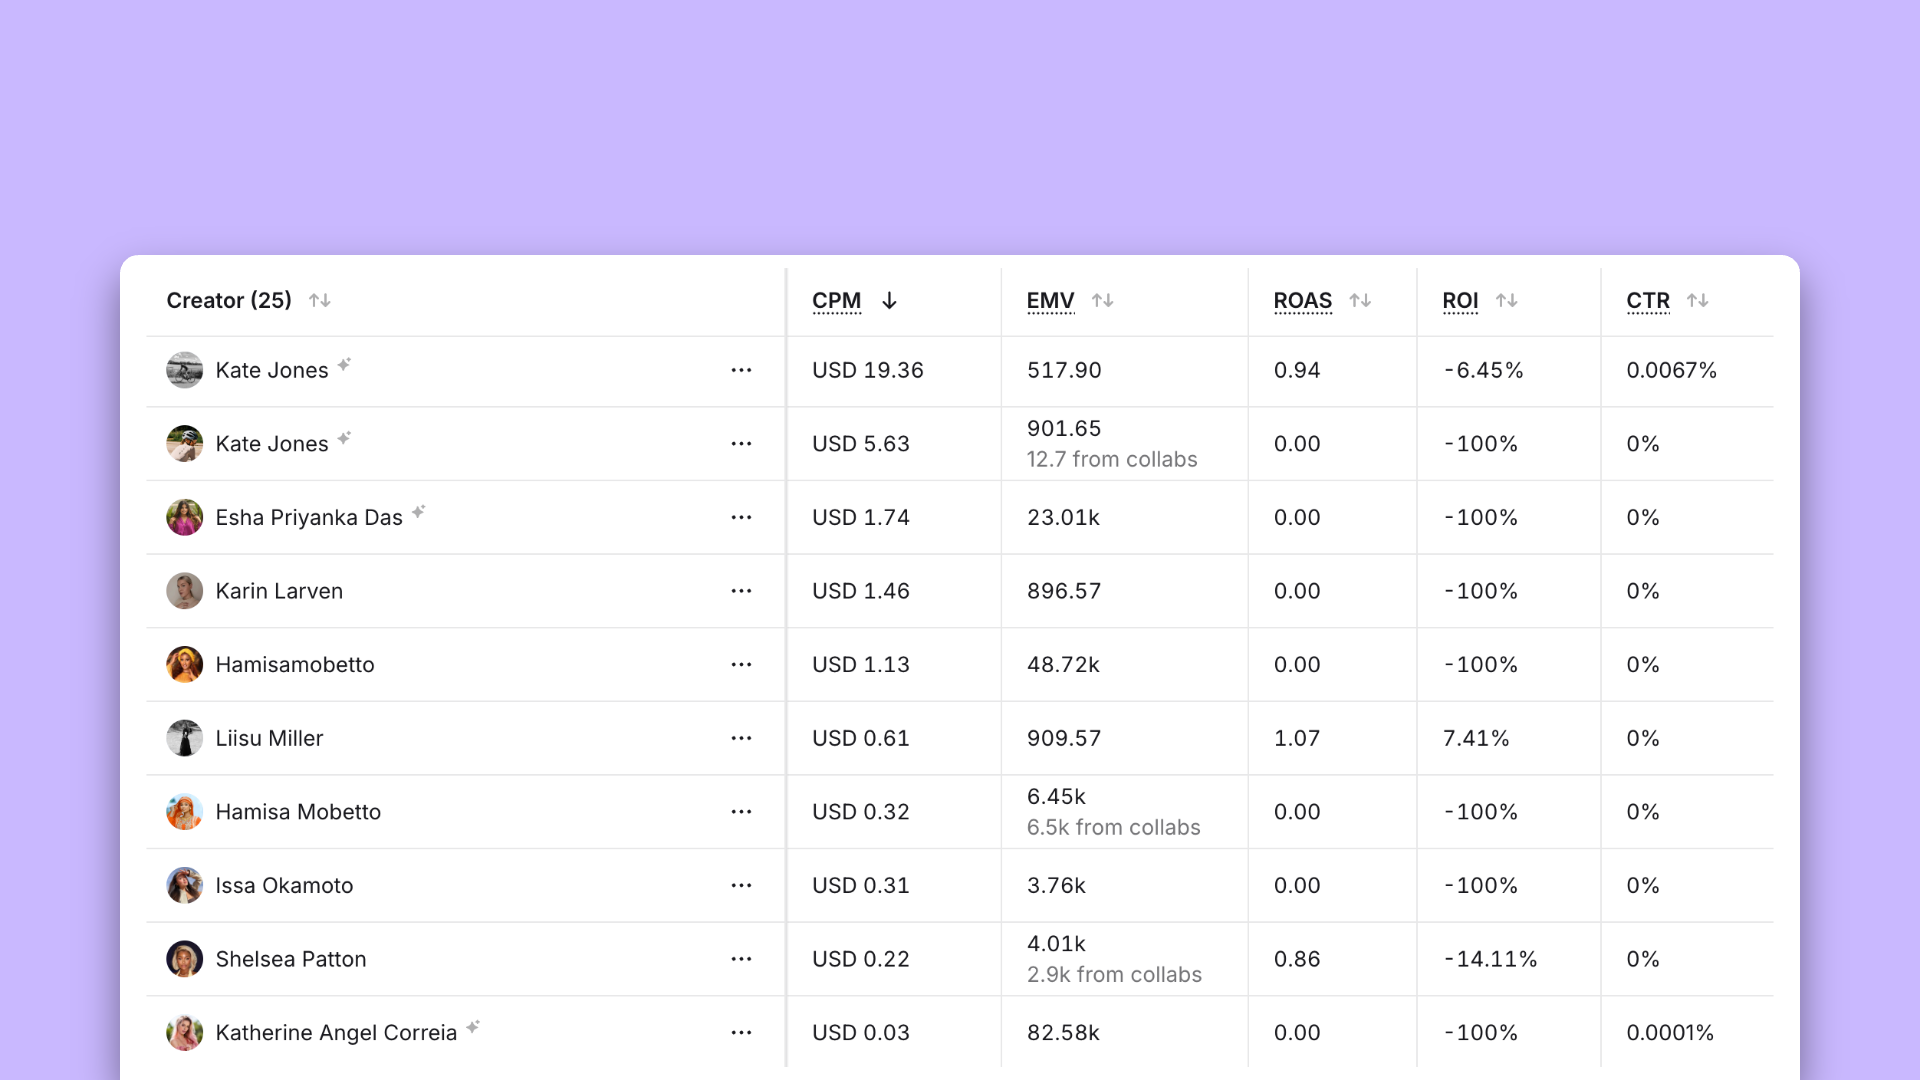
Luckily, Modash calculates CPM, return on ad spend (ROAS), and engagement rate from the same campaign data it uses for engagement and cost, so you can calculate and compare CPE.
If there's one thing to take away from this article, it's this:
CPE doesn't lie. But it will happily tell you whatever your engagement set tells it to.
So keep things real honest by:
Simple enough, right?
Well, in theory. In practice, most CPE problems start in a spreadsheet 😬
You know the drill: someone pulls engagement counts from each platform. Someone else matches them to spend. One month saves are in, the next they're out. And a few months later, your "comparable" CPEs aren't comparable at all.
That's where Modash comes in. It shows engagement per creator right next to cost per creator, calculated and counted the same way every time.
It also shows CPM, ROAS, and engagement rate from the same data, so the only math left is one division: cost ÷ engagements.
👉 Start your 14-day free Modash trial to see for yourself.
There's no reliable universal benchmark. Published figures mix platforms, niches, and engagement definitions. Instead, compare CPE against your own baseline over time and against the other creators in your program.
Divide total cost by total engagements. Include everything it cost to get the content live (fees, product, shipping, and commissions) and use the same engagement set every time. For example, $1,500 total cost ÷ 3,400 likes and comments = $0.44 per engagement.
It depends on the platform and the tool. Platforms show different public counts and tools count them differently, so a total that includes shares and saves gives a lower CPE than the same post counted as likes and comments.
Neither is better than the other. They answer different questions. CPE is what you pay per interaction, CPM is what you pay per 1,000 views, and CPA is what you pay per action, usually a sale. Pick the one closest to your goal: CPE for awareness, CPM for reach, CPA for sales. Most programs track all 3.
Mostly because the engagement set differs. Platforms show different public counts and tools count them differently, so a total that includes shares and saves gives a lower CPE than the same post counted as likes and comments.
Only if attention or awareness was the goal. A low CPE means engagement costs less, not that it was valuable or that it drove sales. Check engagement quality, and check CPA if sales were the aim.