Mike's Hot Honey Influencer Marketing Strategy
(2026 Data & Insights)
We analyzed 1.1k pieces of influencer content sponsored by Mike's Hot Honey over the last 12 months.
This report breaks down where & how Mike's Hot Honey invests in influencer marketing, which social platforms they prioritize, top geographical markets, and more.
The data in this report comes from Modash's Brand Collaborations API.
P.S. for a simple list of influencers who have collaborated with Mike's Hot Honey, see here: Mike's Hot Honey influencers.
Influencer activity throughout the year
Mike's Hot Honey's influencer campaigns are active year-round with notable month-to-month fluctuation. The chart below shows month-by-month data for total sponsored posts tracked.
Mike's Hot Honey's influencer activity by month
Number of sponsored posts
Mike's Hot Honey's influencer output appears relatively consistent throughout the year, averaging about 93 sponsored posts per month. February recorded the highest volume at 113 posts (22% above average), while March was the quietest at 68 posts.
Social platforms breakdown
In our dataset (which only includes Instagram, YouTube, and TikTok), this is how the volume of Mike's Hot Honey's sponsored influencer collaborations break down by social platform:
- Instagram: 608 posts (54.1%)
- TikTok: 507 posts (45.1%)
- YouTube: 8 posts (0.7%)
Mike's Hot Honey's influencer activity by platform
Share of sponsored content by social network
Instagram influencer marketing is a clear focus for Mike's Hot Honey.
Here are 2 examples of Mike's Hot Honey's recent sponsored collaborations (one each for Instagram, TikTok).
ima.kabil x Mike's Hot Honey
![Instagram post by @ima.kabil for Mike's Hot Honey. Caption reads: [...] get any better… then I added @mikeshothoney....](https://images.od.modash.io/19a025288930cfe9fa10f9bc6c06ca8fd7ba7023)
Influencer bio
🇺🇸 US comfort food 🇺🇸 📩 imakabil.collabs@gmail.com 🛒 Shop my favorites 👇🏻
Collaboration metrics
Get a free trial to find more data on influencer audiences, performance, and collaborations.
whereissondra x Mike's Hot Honey
Influencer bio
Indianapolis Based 📍 Lifestyle & Travel Creator ✨ Food & Hidden Gems in Indiana and beyond 📩 Collabs: email in link
Collaboration metrics
Get a free trial to find more data on influencer audiences, performance, and collaborations.
If you break this down further by content type on Instagram, this is what it looks like:
- Reels: 81.6%
- Posts: 18.4%
💡 Related resource: How To Find Instagram Influencers.
Influencer audience size breakdown (by views)
For their top social platform (Instagram), here is a breakdown of the type of influencers Mike's Hot Honey are collaborating with, by audience size.
Note: this breakdown is based on each influencer's average views (not follower/subscriber count), because views typically correlate more closely with influencer pricing and impact.
Mike's Hot Honey's influencers average views (Instagram)
Based on each influencer's average views per post
Mike's Hot Honey's creator selection appears relatively diversified across size tiers, with no single segment dominating. This suggests a balanced approach to influencer partnerships, spreading investment across different audience sizes.
Here is an example of a sponsored collaboration with a larger-audience creator on Instagram (44.1k avg views/post, 178.4k followers):
lindustriebk x Mike's Hot Honey
![Instagram post by @lindustriebk for Mike's Hot Honey. Caption reads: [...] 5th Annual Block Party sponsored by....](https://images.od.modash.io/d6e318252008f8e110d6ae7dec2552fd2bf43795)
Influencer bio
📍254 south 2nd (Brooklyn) 12-10pm 📍104 Christopher street (new York ) 12-10pm @50toppizza #1
Collaboration metrics
Get a free trial to find more data on influencer audiences, performance, and collaborations.
And here is another example with a smaller creator on Instagram (9.2k avg views/post, 97.3k followers):
oliversimsiv x Mike's Hot Honey
![Instagram post by @oliversimsiv for Mike's Hot Honey. Caption reads: [...] much for these🍿🧴!! @garrettpopcorn....](https://images.od.modash.io/26cfcd7197d06e0e15d1651929af5dc9ae447156)
Influencer bio
It’s more lifestyle Mgmt: @therealdba 1911♦️| Dallas, Texas 🎙️ @oliversrealitypodcast 📧 Allison.Hahn@thedigitalbrandarchitects.com
Collaboration metrics
Get a free trial to find more data on influencer audiences, performance, and collaborations.
Mike's Hot Honey's repeat partnerships
Out of 811 unique influencers in our dataset, 7 of them (1%) posted content for Mike's Hot Honey in 3 or more separate calendar months. The most consistent partner is @amdhomemade, who has collaborated across 9 months with 12 total posts.
Here are 2 examples of Mike's Hot Honey's repeat influencer partnerships, with links to the sponsored content.
jennahkaye x Mike's Hot Honey
![TikTok post by @jennahkaye for Mike's Hot Honey. Caption reads: [...] finish. #thanksgiving #mikeshothoney....](https://images.od.modash.io/ff63323249e5c5b5b905f5ffe879695249c56a87)
![TikTok post by @jennahkaye for Mike's Hot Honey. Caption reads: [...] Serve warm. #easyrecipe #mikeshothoney....](https://images.od.modash.io/4844945b84fe9293e111f05f7b6ab646a77caf35)
![TikTok post by @jennahkaye for Mike's Hot Honey. Caption reads: [...] 7. Enjoy warm! #hosting #mikeshothoney....](https://images.od.modash.io/80366b6dcb987709431a953664cf709c67fbfbd1)
wherewebouttaeatatt x Mike's Hot Honey
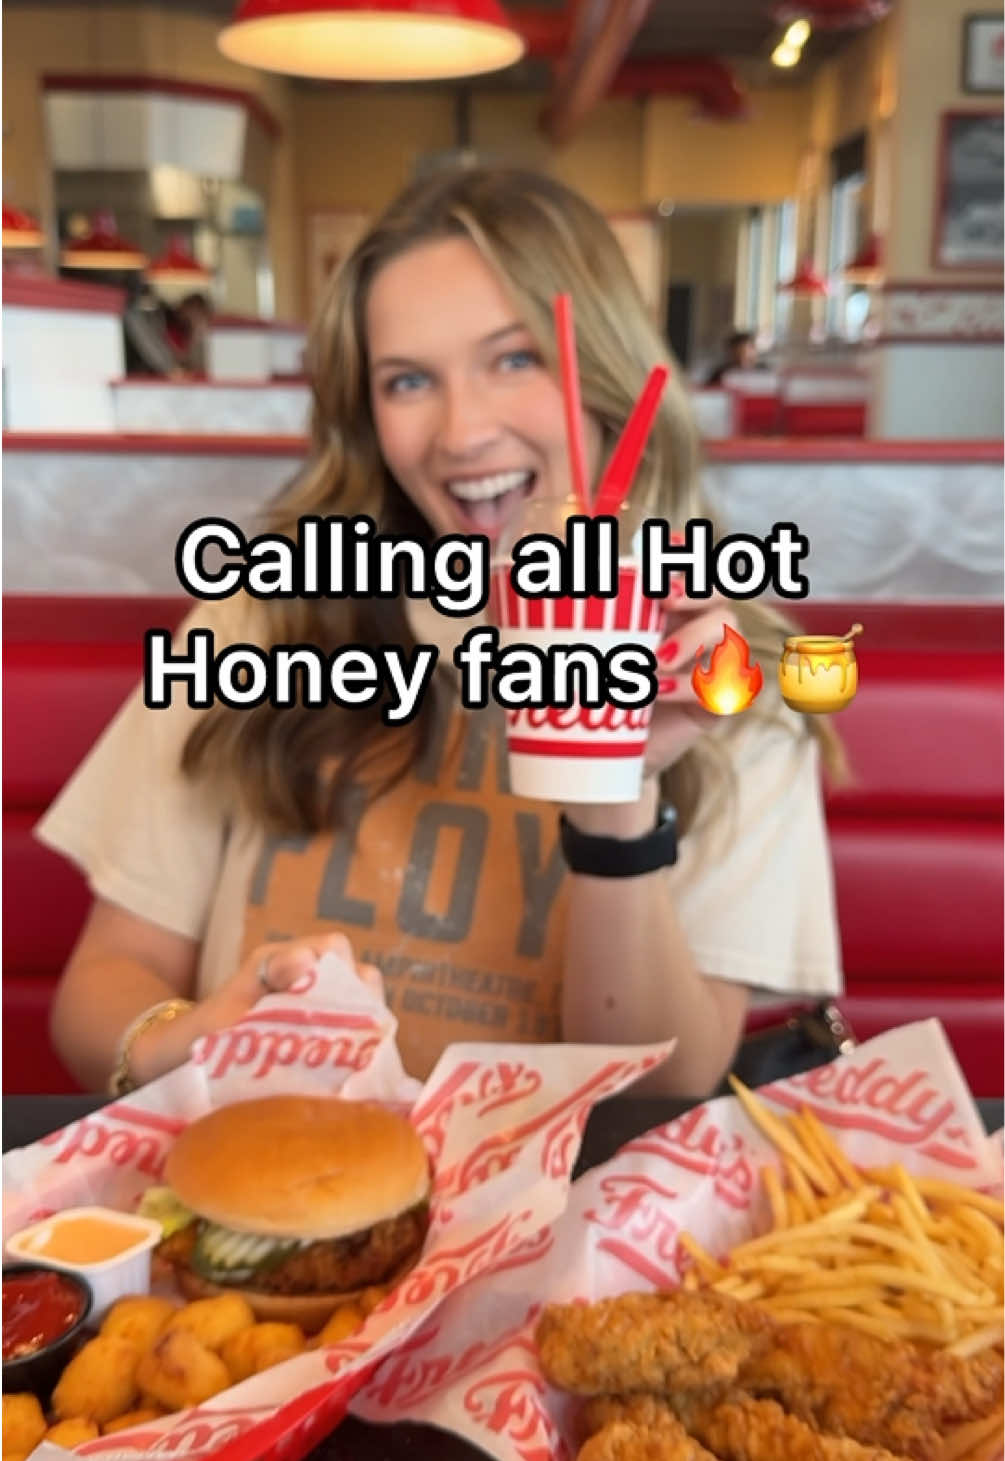
![TikTok post by @wherewebouttaeatatt for Mike's Hot Honey. Caption reads: [...] @Mike’s Hot Honey 😍😍 #mikeshothoney....](https://images.od.modash.io/7dfd783c7eaeefb79659278c0fbd5657893009d6)
![TikTok post by @wherewebouttaeatatt for Mike's Hot Honey. Caption reads: [...] every pizza I’m eating 🔥 #mikeshothoney....](https://images.od.modash.io/0546f2e15887bef1e1f441d6f227a75376dda69e)
💡 Related resource: Long-Term Influencer Partnerships: Pros, Cons & How The Pros Manage Them.
Geographical breakdown
In our dataset, United States is where Mike's Hot Honey had the most influencer activity. 83.7% of their live influencer content in the last 12 months was posted by American influencers.
Based on the percentage of influencer content per market, other important markets include:
- United Kingdom (3.6%)
- Canada (3.5%)
- Brazil (1.8%)
Mike's Hot Honey's influencer activity by market
Here is another example of Mike's Hot Honey collaborating with an influencer in United States.
hannahschibi x Mike's Hot Honey
Mike's Hot Honey's influencer activity vs. related brands
Mike’s Hot Honey overlaps with Graza and Siete Foods in pantry staples that benefit from recipe-led creator content and viral food moments. They compete for the same home-cook and foodie audiences through quick, repeatable usage demonstrations.
Total influencer content
Mike's Hot Honey vs. related brands influencer activity
Total sponsored posts tracked (last 12 months)
Siete Foods leads with 1.9k sponsored posts, significantly outpacing Mike's Hot Honey (1.1k posts) and Graza (991 posts). Across all three brands, the average volume is 1.3k posts, suggesting established influencer marketing investments.
By social platform
Mike's Hot Honey vs. related brands influencer activity (by social platform)
Sponsored posts by platform
Among these brands, Siete Foods leads on Instagram and TikTok and Graza leads on YouTube. The gap is most notable on TikTok, with Siete Foods at 960, Mike's Hot Honey at 507, Graza at 247 posts. On TikTok, Siete Foods posts far more than Mike's Hot Honey and Graza.
By geographical market
Mike's Hot Honey vs. related brands influencer activity (by country)
Estimated sponsored posts in Mike's Hot Honey's top markets
Siete Foods has the highest estimated sponsored-post volume in United States (1.5k posts, 80.4%), Canada (85 posts, 4.5%), United Kingdom (70 posts, 3.7%), suggesting a North America focus. Looking at United States specifically, the split is Siete Foods at 1.5k posts (80.4%), Mike's Hot Honey at 940 posts (83.7%), Graza at 788 posts (79.5%).
Read more influencer strategy breakdowns
Looking for more like this? Here are 5 similar influencer marketing strategy breakdowns for other brands:
- Graza's Influencer Marketing Strategy
- Siete Foods's Influencer Marketing Strategy
- Magic Spoon's Influencer Marketing Strategy
- VELVET CAVIAR's Influencer Marketing Strategy
- Daniel Wellington's Influencer Marketing Strategy
Or, if you want to access data like this for your own software or processes, take a look at Modash's API products:
Frequently asked questions
Scaling your influencer program?
When you outgrow your mishmash of spreadsheets & free tools, try Modash. Find & email influencers, track campaigns, ship products & more - all in one place.